XLF - Financials In Focus Ahead Of CPI And The Fed: VFH A Buy
2023-06-07 16:18:01 ET
Summary
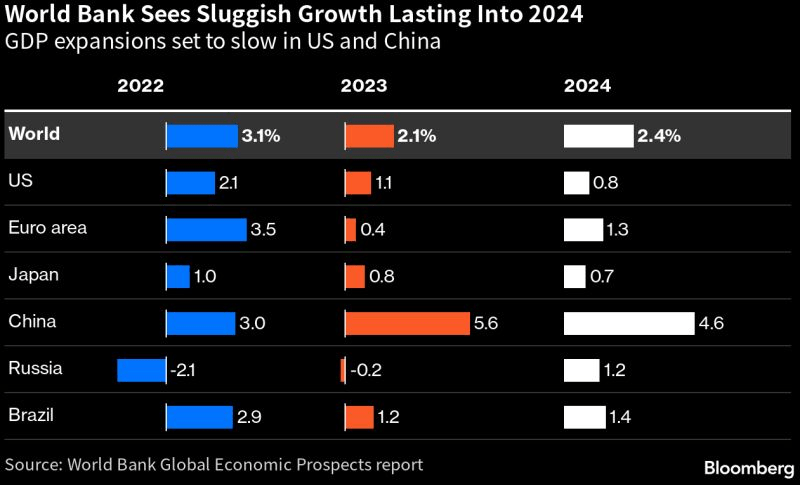
- The World Bank raised its global real GDP growth outlook for 2023 to 2.1% but cut 2024 expectations from 2.7% to 2.4%.
- Vanguard Financials Index Fund ETF is recommended for its low valuation and high yield, despite potential risks.
- VFH's performance will be influenced by the upcoming CPI report and Fed meeting, with a historically bullish stretch expected in late June.
The World Bank recently raised its outlook for global real GDP growth for 2023. They now expect 2.1% economic expansion this year, but also cut 2024 GDP growth rate expectations from 2.7% to 2.4%. Better prospects in the United States and China are near-term tailwinds, but the ever-looming recession calls continue to get pushed out, threatening how the economic picture shapes up in the out year.
The financial sector is particularly vulnerable to a slower pace of economic expansion. But I have a buy rating on the Vanguard Financials Index Fund ETF ( VFH ) due to its low valuation and high yield amid dismal sentiment.
Better 2023 Global GDP Growth Forecasted
According to the issuer , VFH seeks to track the performance of a benchmark index that measures the investment return of stocks in the financial sector. It is passively managed and employs a full-replication strategy when possible and a sampling strategy if regulatory constraints dictate. Launched in January 2024, the ETF sports an exceptionally low 0.10% annual expense ratio and a median 30-day bid/ask spread of just 5 basis points. Vanguard lists the 50-day average volume at more than 500,000 shares, so tradeability is robust. The yield, meanwhile, is significantly above that of the S&P 500.
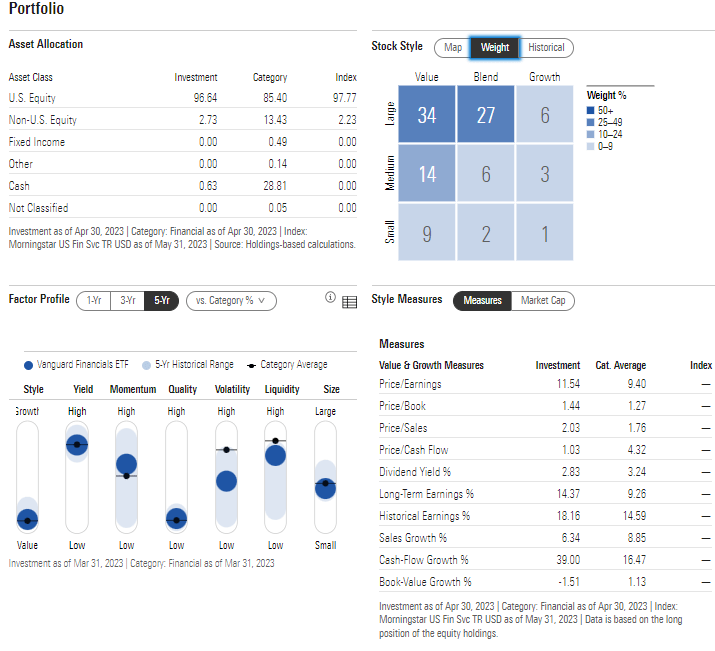
Investors expecting a mean-reversion trade away from mega-cap tech back toward true value should consider going overweight VFH. According to Morningstar , the fund's allocation is heavily tilted toward the left side of the Style Box. Value accounts for more than half of the ETF, while growth is a mere 10%. While the factor profile shows a high yield, earnings quality among the allocation is weak, so that's a risk. But with a low 11.5 price-to-earnings ratio and strong long-term earnings growth, I like the PEG ratio here.
VFH: Large-Cap Value Focused
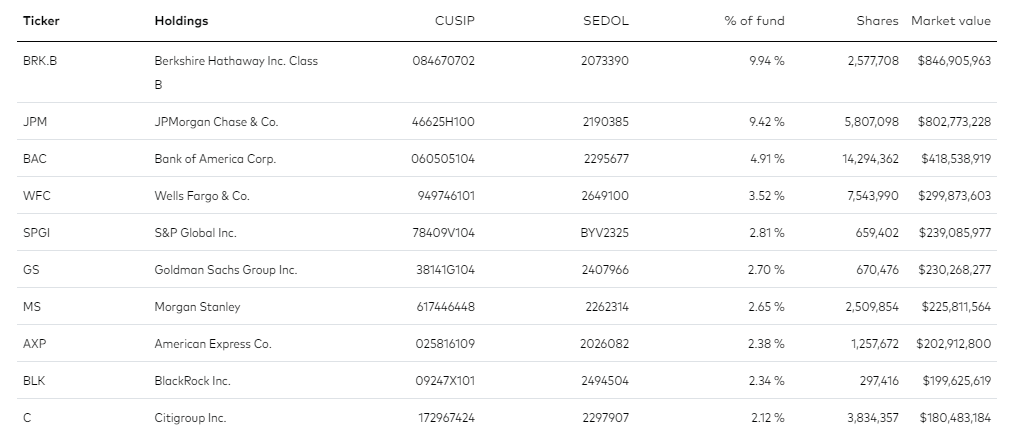
Vanguard notes that nearly a quarter of VFH's assets are within the Diversified Banks industry, with a healthy and diversified mix of other financial sector industries. But the ETF is somewhat concentrated in a handful of names. Berkshire Hathaway ( BRK.B ) and JPMorgan Chase ( JPM ) represent more than 19% of the portfolio. Overall, the top 10 positions account for 43% of the 4-star, gold-rated fund (Morningstar).
VFH: Buffett & Dimon
What will play a crucial role in how financial-sector stocks perform will be next week's CPI report and Fed meeting. I will cover both events, so be on the lookout for key charts in my CPI review and FOMC preview articles. For now, the market expects a Fed skip in its rate hiking cycle before a final July rate rise.
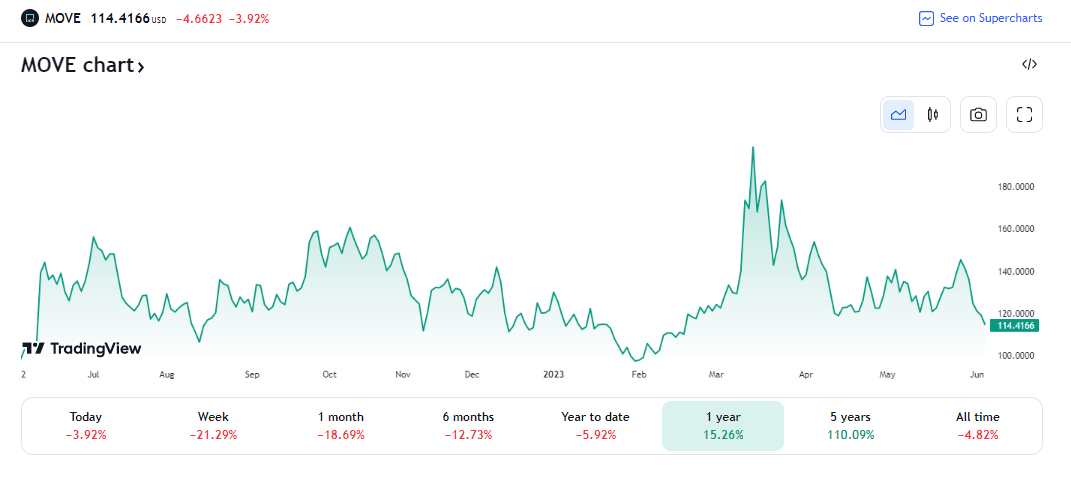
Rate Market Volatility Eases As the Fed Hiking Cycle Nears An End
CME FedWatch Tool
Treasury Volatility: Lowest Since February
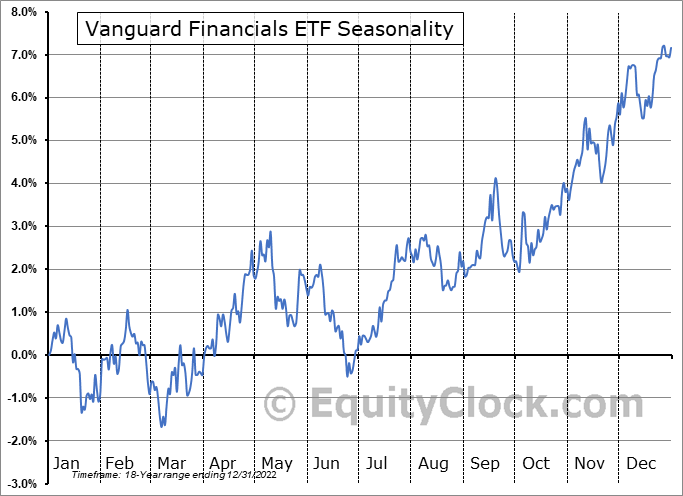
Seasonally, VFH tends to rally starting in late June, according to data from Equity Clock . A bullish stretch typically ensues in about two weeks, so having dry powder available to go overweight the area may be the right play.
Financials Historically Find Buyers Starting In Late June
The Technical Take
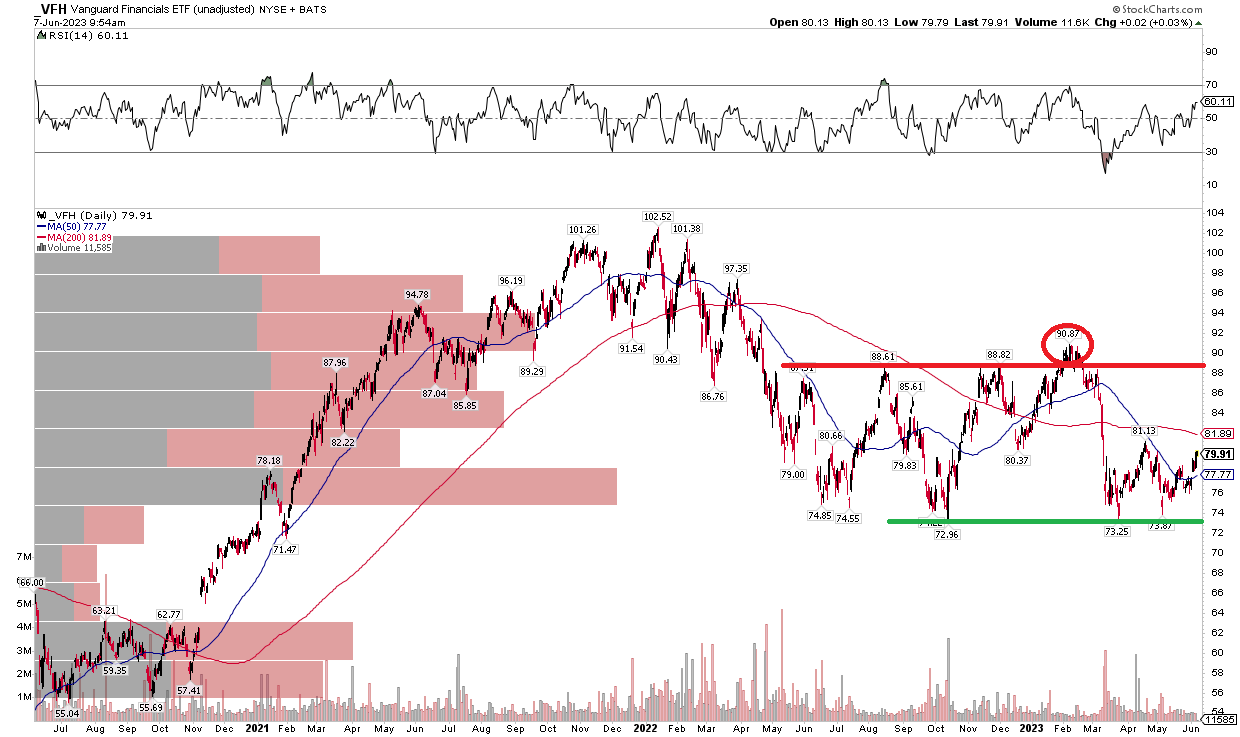
With a favorable valuation and decent dividend yield, the chart shows some stabilization. Notice in the graph below that VFH has established a trading range, with key support in the $72 to $74 zone. So long as that range holds, then a long position is viable. I see resistance, however, in the upper $80s. The ETF notched a bearish false breakout back in February before it collapsed around the US regional banking crisis.
In technical analysis, we like to describe such a move as: "From false moves come fast moves in the opposite direction." But buyers stepped up to the plate right where you would expect them to. The story is not totally sanguine - the long-term 200-day moving average is negatively sloped, indicating the bears are still in charge, but with ample volume by price just above important support, I like the risk/return ratio despite soft momentum.
VFH: Shares Stabilize After A First-Half 2022 Swoon
The Bottom Line
I have a buy rating on VFH. I like its low cost and valuation, but recognize a few technical risks.
For further details see:
Financials In Focus Ahead Of CPI And The Fed: VFH A Buy