ARCC - Finding The Sweetspot Across The Yield Curve At 7-10% Yields
2023-07-07 09:18:08 ET
Summary
- Many investors oversimplify the investment process with respect to duration by thinking about the concept on a single spectrum.
- They also overly focus on today's yield rather than considering reinvestment risk as well as capital gains consequences.
- We discuss two of these investment process shortcomings and highlight a number of attractive holdings in the context of the current market environment.
This article was first released to Systematic Income subscribers and free trials on June 27.
Income investors have many decisions to make in their allocation process. One of these decisions is where along the yield curve to allocate their marginal capital.
Many investors approach this by using the concept of duration relative to today's yield on offer across the yield curve. However, this overly simplistic approach ignores a broader understanding of duration as well concepts like reinvestment and capital gains risk. In this article, we review this fuller approach and highlight a number of securities that look attractive at present.
Reviewing Duration
Many investors hold misconceptions about one of the key metrics in fixed-income: duration. Specifically, they view duration as existing on a single-spectrum from low to high. Low duration means low sensitivity to changes in yields and high duration means high sensitivity to changes in yields.
Investors with this view are often surprised when, supposedly low duration assets like bank loans, drop in price along with bonds when yields rise. The reality is that yields are composed of both risk-free rates and credit spreads which means that investors should really consider both credit duration and interest rate duration.
The following matrix breaks it down across both of these duration dimensions. As a technical sidenote, there are financial instruments with negative duration such as mortgage servicing rates or MSRs and interest-only CMOs or IOs however these are not typically directly accessible to retail investors, outside of relatively small funds like ( RISR ).
Systematic Income
Assets with low durations on both counts are cash and very short-maturity credit such as, say, corporate bonds maturing a year or two.
Assets with high credit duration and low interest rate duration are various floating-rate credit assets such as bank loans, securitized assets and floating-rate bonds. These assets can be highly sensitive to changes in credit spreads but much less sensitive to changes in interest rates.
Assets with low credit duration and high interest rate duration are Treasuries, Agencies and high-quality Munis. Technically, for Treasuries and Agencies, credit duration is undefined rather than low because they don't have any credit risk (Agencies do have an option-adjusted spread over Treasuries however this is due to their negative convexity than anything else). Purists would object for Treasuries and Agencies to be included here but this is one of the rare cases where intuition trumps math. Assets in this quadrant are attractive in a period of high interest rates and tight credit spreads. If 10Y Treasury yields move north of 4% while high-yield corporate bond credit spreads move below 4% we would consider adding to this quadrant.
Assets with high credit and interest rate duration are corporate bonds with longer-term maturities.
Gauging Risk/Reward
Investors looking to allocate across the duration matrix need to also consider risk and reward. These include current compensation/yield, reinvestment risk and capital gains/losses.
Many investors consider cash or very short-dated assets as the absolutely no-brainer choice in the current market because the Treasury yield curve is inverted as the following chart shows. This picture is not dissimilar for corporate bonds where shorter-dated bonds also tend to trade at higher yields than longer-dated bonds.
Systematic Income
It is true that in many cases short-dated exposure can deliver a higher yield than longer-dated exposure. However, apart from current compensation across the yield curve we also need to consider reinvestment risk and potential capital gains/losses.
The downside of very short-dated assets is that their attractive yield can roll off very quickly. Specifically, if the Fed decides to move rates lower swiftly, the high short-term yields on offer will disappear. Investors who locked in today's lower yields for 2-3 years may actually end up generating a higher overall level of yield over that period than investors who stuck with very short-dated assets. And vice-versa, if the Fed instead continues to push rates higher or leaves them stable longer than the market thinks, short-dated assets can deliver more yield over the same period than longer-dated ones.
Turning to potential capital gains/losses, shorter-duration assets will be less sensitive to changes in yields than their longer-duration counterparts. If yields fall, perhaps as inflation continues to grind lower, longer-duration assets will outperform, generating capital gains for investors. And vice-versa, if inflation stalls here or even reverses higher, longer-duration assets will likely deliver capital losses to investors.
In short, all three components need to be taken into account - today's yield, reinvestment risk and potential capital gains/losses.
Some Ideas
Our own view is that there are several attractive places in the duration matrix. We like being in the low interest rate duration/higher credit duration space to take advantage of the extremely inverted yield curve.
Here we hold a number of business development companies which allocate primarily to floating-rate loans. We recently topped up our allocation to the Ares Capital Corp (ARCC) which dipped to a discount to book and a relatively low valuation premium relative to the sector over the past year. ARCC trades at a 10.5% yield and has a 13% net income yield.
Systematic Income
We also like investment-grade CLOs which boast a double-digit internal yield. They are held by funds like the Janus Henderson B-BBB CLO ETF ( JBBB ).
Elsewhere in the duration matrix, we also like the low interest rate duration/low credit duration space of shorter-maturity baby bonds such as the Ready Capital 2026 bond ( RCB ) and the Arlington Asset 2026 bond ( AAIN ), trading at 9.2% and 8.4% yields respectively. We view these bonds as resilient drier-powder assets that can be deployed to higher-beta opportunities when the market dips.
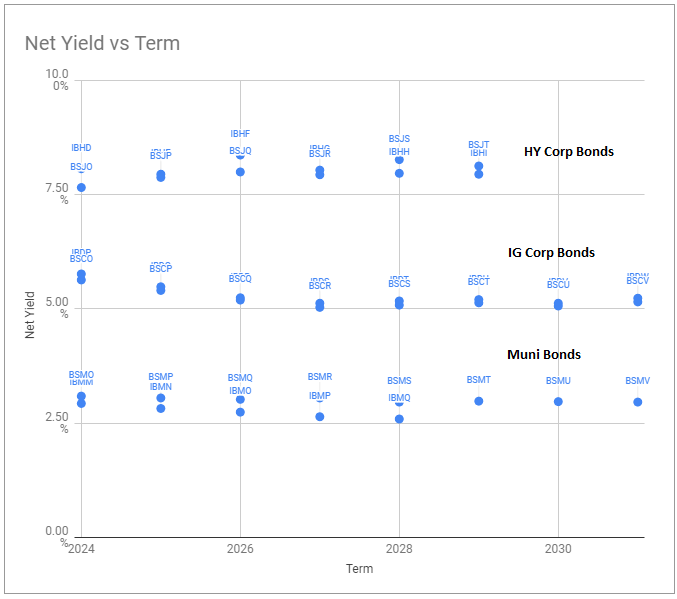
As the following chart from our Funds Tool shows, HY bond yields tend to top out around 2026 so there is no reason to extend duration past that point unless investors want to explicitly increase their duration profile in expectation of falling interest rates.
Takeaways
Many investors view duration allocation in their portfolios on a single spectrum while also focusing entirely on the current yield on offer. In our view, it makes more sense to think in terms of a duration matrix, incorporating both interest rate and credit duration. It also helps to think in terms of reinvestment and capital gain risk in addition to today's yield. This enhanced perspective, in our view, is likely to lead to a more sound investment process.
For further details see:
Finding The Sweetspot Across The Yield Curve At 7-10% Yields