FINV - FinVolution: Dividend Trends By The Numbers
2023-07-06 12:14:18 ET
Summary
- FinVolution Group's shares have been consolidating, but its 4.69% dividend yield has protected investors' purchasing power. The company's annual dividend payout has increased by over 80% since 2020.
- The company's free cash flow dividend payout ratio of 40.3% indicates that the dividend is sustainable. FinVolution's strong cash position of $1.128 billion further protects the dividend.
- Despite a drop in net earnings in fiscal 2022, the company is expected to return to earnings growth this year, with strong growth expected in subsequent years.
Intro
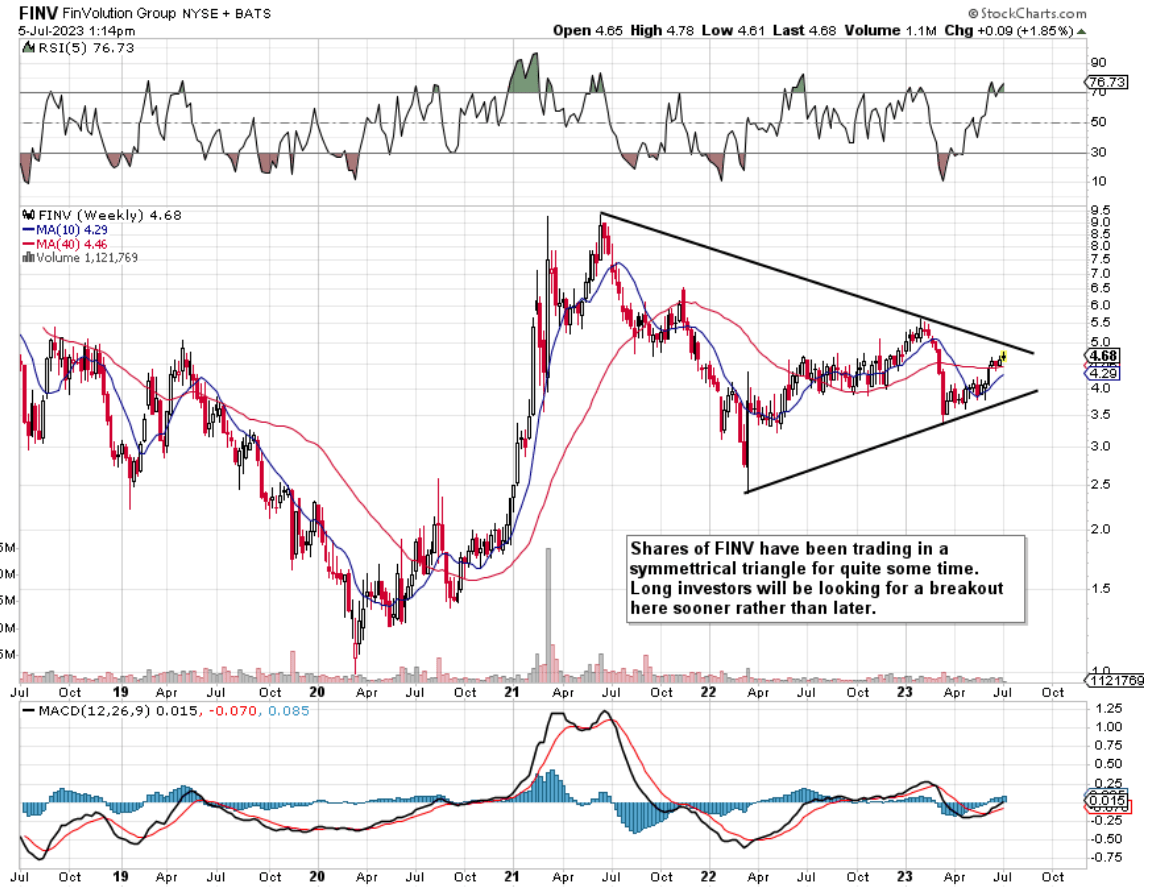
FinVolution Group ( FINV ) is a company that has been on our radar for quite some time. In fact, we have issued multiple buy ratings in recent times ( January and April of last year) on this company due to its very keen valuation, strong profitability as well as strong growth profile. However, as we see from the technical chart below, shares seem to be caught in a symmetrical triangle formation which more often than not tends to play itself out as a continuation pattern (bullish). This means that our January-2022 'Buy' rating for example comes in pretty much flat in terms of FINV's share-price appreciation over the past 18 months. The generous dividend however means that the 'total return' of this position to date comes in at almost 14%. This number really demonstrates the power of a regular dividend payment especially in stocks that continue to consolidate month after month.
Another key point regarding symmetrical triangles is the following. As FINV's share-price day by day gets closer to the apex, the pattern begins to lose some of its potency. Therefore, given the recent encouraging Q1 report and how transaction volume is on the rise again, we are looking for the share price to finally breakout out of resistance in this current up move (which has been very aggressive since the end of May). If this does not happen, and FINV continues to trade within a range, the dividend as always is crucial in order to protect the purchasing power of the investor. Therefore, let's go through the strength of FINV's dividend as here we can gain insights into the fundamental strength of this Fintech outfit.
Dividend Yield
FinVolution's forward annual dividend of $0.22 per share equates to a present dividend yield of 4.69%. This yield comes in higher than the company's 5-year average of 4.38%. When shares of a company have been consolidating for quite some time, it is crucial that the investor's purchasing power is protected as much as possible. As mentioned, FinVolution's elevated dividend yield has been the principal reason why long-term investors have reported gains in this investment over the past few years.
Dividend Growth
Although FinV's dividend increased by only $0.01 per share over the past 12 months, the annual payout is up over 80% since 2020 when the annual payment was $0.12 per share. Dividend growth is important because it builds trust regarding future growth plus it also protects against purchasing power erosion. Growth rates though have been slowing somewhat so let's see if this is a consequence of lower cash-flow generation over the past year or so.
Free Cash-Flow Dividend Pay-Out Ratio
Over the past four quarters, FINV has generated $142.2 million of operating cash flow of which only a mere $7.7 million was put towards capital spending. This means free cash flow came to $134.5 million of which $54.2 million was paid out in dividends to qualified shareholders. Dividing free cash flow by FinVolution's trailing dividend payments gives us a free-cash-flow dividend payout ratio of 40.3% which demonstrates that the dividend in its current state is sustainable.
Strong Cash Position Protects Dividend
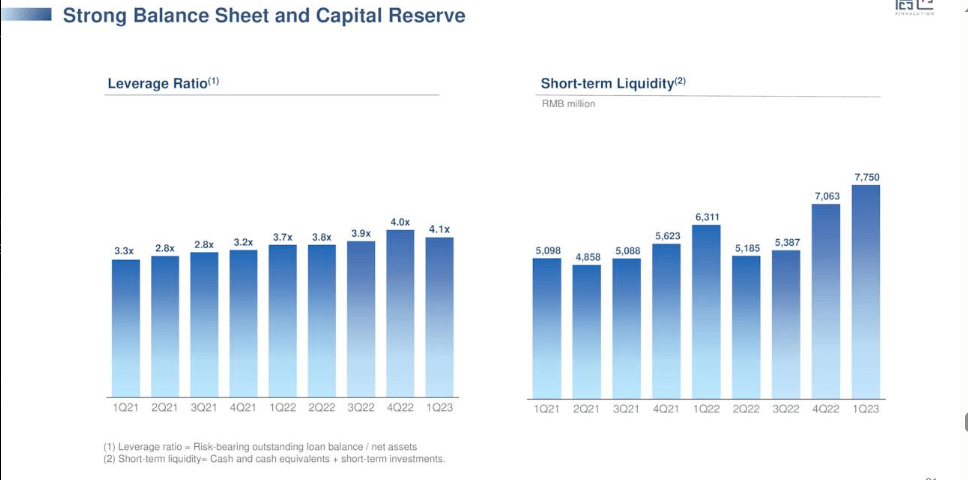
At the end of FinVolution's most recent reported first quarter, the company reported $1.128 billion of cash & ST investments. Suffice it to say, given FinVolution's present market cap of $1.314 billion, shares at present are trading for a mere 1.16 times their cash position and 9.77 times their free-cash flow position. These numbers demonstrate how cash-rich FinVolution is and how its valuation should continue to attract buyers over time. The reason is that FinVolution continues to double down on its strategy of securing better quality borrowers where the opportunity to grow literally remains untapped in Southeast Asia. Therefore, when working off such a sound financial base where risk is minimized by the company's high liquidity and an attractive leverage ratio as we see below, FinVolution can continue to remain aggressive with respect to partnering up with more funding partners as well as improving its in-house technology.
FINV: Q1 Leverage Ratio & Liquidity Profile (Seeking Alpha - Q1 Presentation)
Consensus EPS Revision Trend
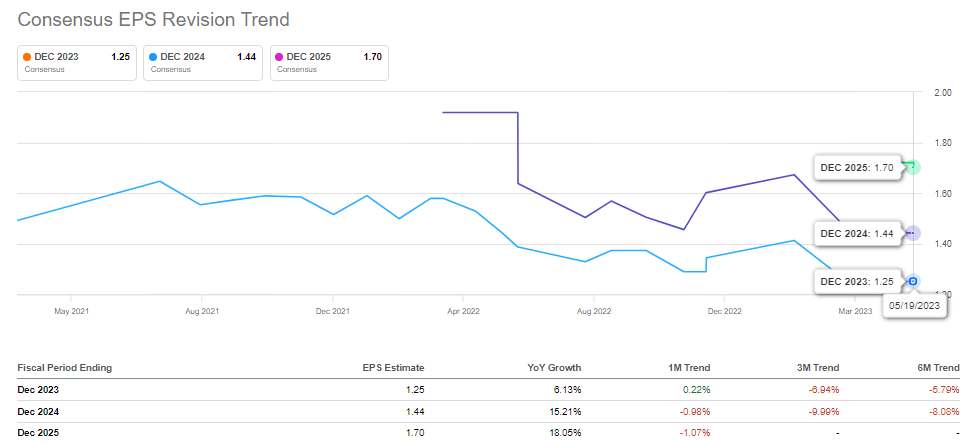
Although net earnings dropped in fiscal 2022 by $0.20 per share, the company is expected to return to bottom-line earnings growth this year with strong growth expected in the years thereafter. Furthermore, as we can see from the revisions trends below, we have seen forward-looking EPS projections stabilize over the past month or so which is promising. Suffice it to say, if the current earnings estimates for fiscal 2024 and fiscal 2025 can indeed be achieved, these estimates correspond to a fiscal 2024 earnings multiple of 3.25 and a fiscal 2025 earnings multiple of 2.75. Therefore, we suspect that management can keep on increasing the dividend aggressively as the earnings and cash flow should indeed be there to meet those increasing payments.
Conclusion
To sum up, FinVolution continues to trade on the cheap, has bucket loads of cash, and growth is expected to come aggressively in fiscal 2024 and beyond. Therefore, we believe it is only a matter of time before we get our technical breakout. We look forward to continued coverage.
For further details see:
FinVolution: Dividend Trends By The Numbers