FCXXF - First Capital REIT: Not A Bargain
Summary
- Same property NOI growth is likely to be modest over the next three years.
- Debt profile and asset sale program offer some protection from rising interest rates.
- Valuation is at the high end of its P/BV trading range.
Investment Thesis
First Capital REIT (FCXXF) ( FCR.UN:CA ) manages a portfolio of retail real estate properties that cater mostly to groceries and necessities. This provides the REIT with a relatively more stable tenant base that could better handle economic downturns. The portfolio has significant scope for redevelopment that is yet to be fully reflected in the valuation of its assets. Moreover, the REIT aims to dispose of some assets to reduce leverage. The increase in distribution that was made in September 2022 implies a distribution yield of 4.8% for 2023. NOI for existing properties will likely see modest growth in the next three years, as the portfolio has high occupancy and a long lease maturity profile. From a valuation perspective, FCR trades at a P/BV of 0.89x, which is on the high side of its trading range in the last four years. Also, the unit price does not reflect further increases in cap rates, which is still possible at current interest rate levels. Thus, I believe that the price of FCR units reflects most of the benefits of the REIT and accordingly my rating is “Hold.”
Background on FCR
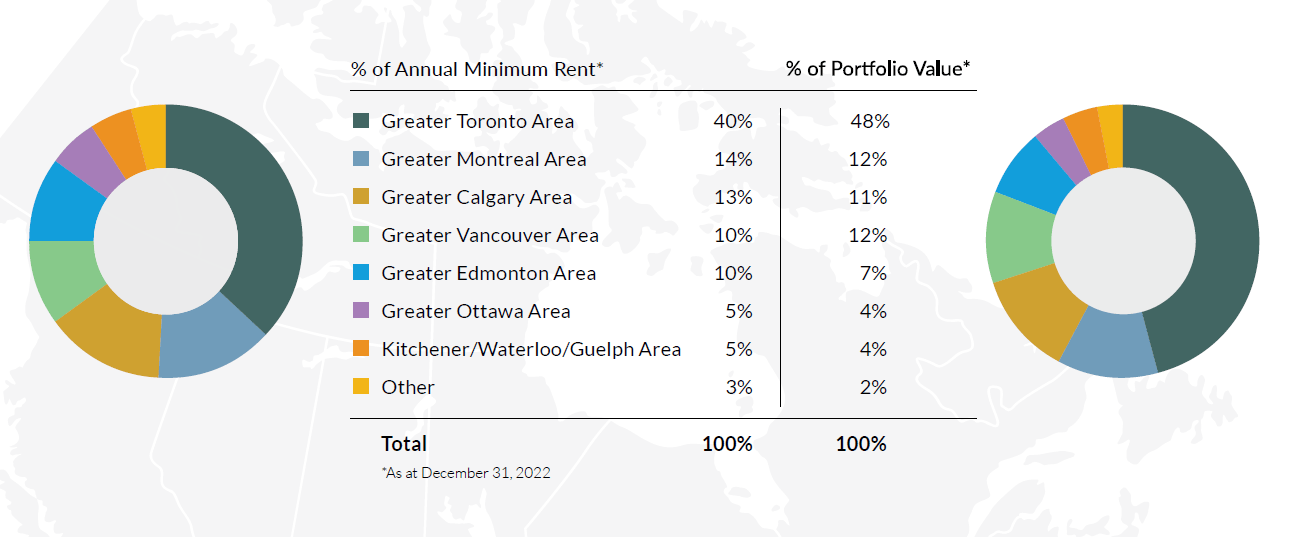
FCR is REIT that is focused on operating retail real estate assets that are grocery-anchored and located in densely populated neighborhoods across Canada. The REIT has CAD 9.6 billion in assets, largely composed of retail real estate properties that span 145 neighborhoods and have a gross leasable area ((GLA)) of 22.2 million square feet ((SF)) (19.3 million SF at the consolidated level). The average population density of the neighborhoods that FCR is present in is 300,000. Moreover, 99% of FCR’s portfolio is within a 5-minute walk to public transit. FCR’s portfolio is well-diversified geographically across Canada’s largest cities. Most of the portfolio’s properties are in Toronto, Montreal, Vancouver, Edmonton, Calgary, and Ottawa.
Figure 1 FCR’s Portfolio by Region
FCR’s portfolio is heavily tilted towards providers of necessity-based services that cater to the neighborhoods in which their properties are located. This makes the portfolio less exposed to economic cycles, as the tenant mix is composed more of providers of staples rather than discretionary products and services. Moreover, the tenant profile is made of retailers that have proven to be less susceptible to disruption from e-commerce providers.
In addition, FCR’s portfolio has significant potential for redevelopment and intensification. According to management, the REIT has identified 24 million square feet of incremental density within the portfolio. Based on management notes, only 7.7 million SF of the identified incremental density has been included (or partially included) in the value of the investment properties on the balance sheet.
Figure 2 Tenant Mix
Source: Calculated by Author using data from the REIT
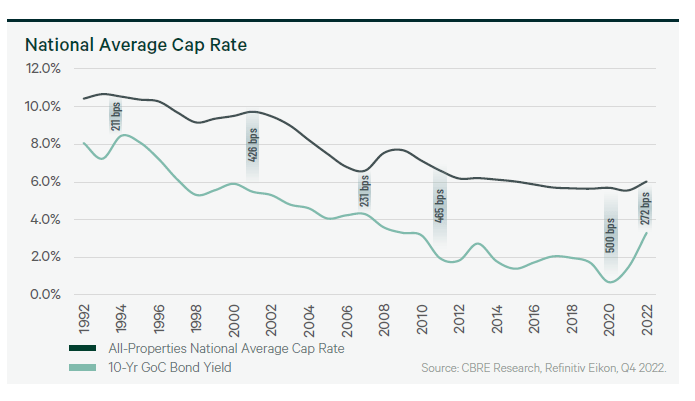
A Glimpse of Cap Rates in the Canadian Retail Real Estate Market
As we can see from Figure 3 below (pulled from the Q4 2022 CBRE Canadian Cap Rates & Investment Insights Report ), cap rates in Canada have remained resilient in the face of rising interest rates. This has led to a significant compression in spreads between cap rates and yields on government bonds. This situation may be able to exist in the short term but is not likely to hold over a prolonged period. The spread will eventually normalize, either due to lower interest rates or an increase in cap rates.
Figure 3 Canada National Average All-properties Cap Rate
Source: Q4 2022 CBRE Canadian Cap Rates & Investment Insights Report
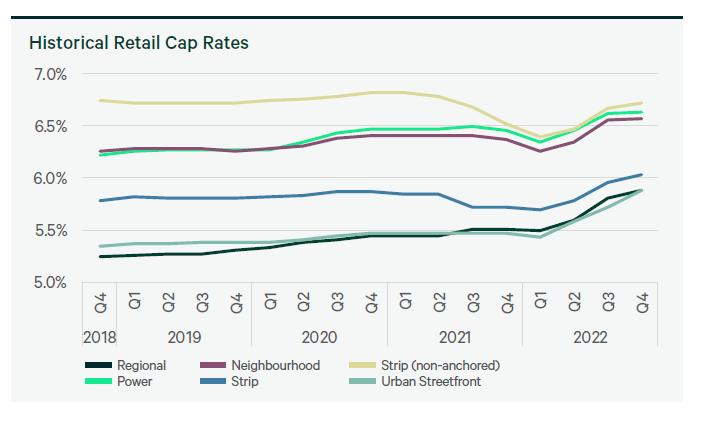
Based on data from CBRE the average neighborhood retail assets had a cap rate of 6.6% by the end of Q4 2022. This real estate class did not see much pressure on cap rates as it posted only a 20 bps YoY increase in cap rates. This is an important development for FCR as it reduces the pressure on writing down the value of investment properties, at least for the short term.
Figure 4 Canada Retail Cap Rates
Source: Q4 2022 CBRE Canadian Cap Rates & Investment Insights Report
Distributions Are Back to 2020 Levels
After seeing a reduction in distribution per unit in 2021, FCR returned to its monthly distribution of CAD 0.072 per unit (or CAD 0.86 annualized) in September 2022. Thus, in Q4 2022 FCR paid out CAD 0.215 per unit, which marked the first quarterly return to this level of distribution. As expected, this meant that the FFO payout ratio increased to 58% in Q4 2022. Based on management, Q4 2022 FFO per unit falls to CAD 0.32 from CAD 0.37 upon adjusting for other gains and expenses . Thus, the adjusted FFO payout becomes 68%. If we annualize the Q4 2022 distribution per unit, it implies a distribution yield of 4.8% for unitholders.
Figure 5 FCR Payout Ratio
Source: Calculated by Author using data from the REIT
FCR has 72% of its debt in the form of senior unsecured debentures or credit facilities. The benefit of this strategy is that 69% of its asset base is unencumbered, which makes it easier to redevelop or dispose of properties. However, the downside is that it has a lower maturity than mortgages and hence the average debt maturity of FCR is 3.4 years. Thus, though 95% of FCR’s debt pays fixed interest rates, it will likely see its average interest rate costs rise upon renewal of debt facilities (assuming interest rates will remain elevated for the next couple of years). However, the REIT is planning to sell some non-core assets and reduce leverage. If successful, this will reduce the need for new debt to replace maturing debt in the next two years. Accordingly, I do not expect to see pressure on FFO from rising interest rates (at least in the short term).
Figure 6 Debt Maturity Profile
Source: Calculated by Author using data from the REIT
FCR has been actively reducing its leverage. As we can see in Figure 6, FCR’s total debt-to-EBITDA ratio has fallen from 12.3x to 10x. This is largely due to a 13% reduction in total debt over the period. Over the two years, EBITDA increased by just 6%. Thus, it shows that the REIT’s asset disposition strategy is leading to lower leverage levels.
Figure 7 An Active Decline in Leverage
Source: Calculated by Author using data from the REIT
NOI Has Limited Scope for Organic Growth
Rental income drives net operating income (NOI) growth for FCR. For rental income from existing properties to grow, we need an increase in occupancy and/or an increase in base rent. FCR’s portfolio currently has an occupancy level of 95.8%, which is quite high. Thus, at best we can see a 100 to 200 basis points uplift in the occupancy level in the future. Though we could likely continue to see low double-digit lease renewal uplifts, the percentage of GLA that is up for renewal will hover between 11% and 12% per annum over the next three years. Accordingly, the same property NOI for FCR will likely grow in the low-to-mid single-digit range over the next three years.
Figure 8 FCR Lease Renewals
Source: Calculated by Author using data from the REIT
Valuation: Not Trading at a Steep Discount
Figure 9 shows the latest valuation for FCR and the last four years on a price-to-NAV and a price-to-book basis. For FCR, I prefer to look at price-to-book as FCR’s management adjusts NAV for deferred tax liabilities. Currently, FCR trades at a price-to-book ratio of 0.89x which is on the higher end of the range of the last four years. Moreover, the REIT trades at an implied cap rate of 6.0% on reported NOI and at an implied cap rate of 5.3% on adjusted NOI (I deduct corporate expenses from the NOI). Thus, FCR trades at a fair valuation when compared to its historical range and current levels of cap rates in the market.
Figure 9 Valuation
Source: Calculated by Author using data from the REIT
Key Risks
One of the main risk factors for FCR is rising interest rates. A prolonged period of high-interest rates could lead to an expansion of cap rates in real estate transactions. This could lead to a downward revision in the reported value of investment properties on FCR’s balance sheet, thus reducing the BV per unit. Secondly, a prolonged period of high-interest rates would mean that new debt raised by the REIT will be considerably more expensive, putting downward pressure on FFO. Pressure on FFO would also put pressure on distributions. Also, though the tenant mix of FCR is highly defensive, it does not mean that all of its tenants would survive an economic recession. Thus, though FCR may be better suited to weather an economic recession, it is not totally immune to it.
Final Thoughts
FCR is a well-managed REIT and the asset sale program could be a source of value creation for unitholders. The increased distribution significantly enhances the yield that unitholders generate. However, at the current market price, the units seem to be fairly valued and seem to be reflecting a scenario where interest rates will start declining by the end of 2023.
For further details see:
First Capital REIT: Not A Bargain