FHN - First Horizon: Good Bank And Healthy Dividend But Questionable Liquidity
2023-09-30 07:11:10 ET
Summary
- First Horizon Corporation is a regional bank with low exposure to HTM securities and CRE loans. The red flags are record low cash-to-deposit ratio and 40% insured deposits.
- Despite declining revenue and margins in the second quarter, FHN recorded adequate financial performance with improved capital adequacy and stable credit quality.
- Using the Dividend Discount Model, FHN is overvalued, though using multiples as forward PE and PB is the cheapest among its peers.
- Given all the facts, I give FHN a hold rating, primarily due to the questionable liquidity. I look forward to seeing improved liquidity metrics, thus changing the FHN rating.
Thesis
First Horizon Corporation (FHN) is a typical regional bank with a robust loan portfolio and paying dividends with respectable yields. On top of that, the bank is notably cheaper than its peers. Given the turbulent economic situation, the last quarter's performance is adequate. The bank improved its capital adequacy and maintained stable credit quality despite dropping revenues and margins. The banks have two red flags: FHN has 41% uninsured deposits and a 1.44% cast-to-deposit ratio. Being cheap, with a good dividend and healthy loan portfolios, is insufficient to give a buy rating considering banks' questionable liquidity. That said, I give FHN a hold rating.
Q2 results
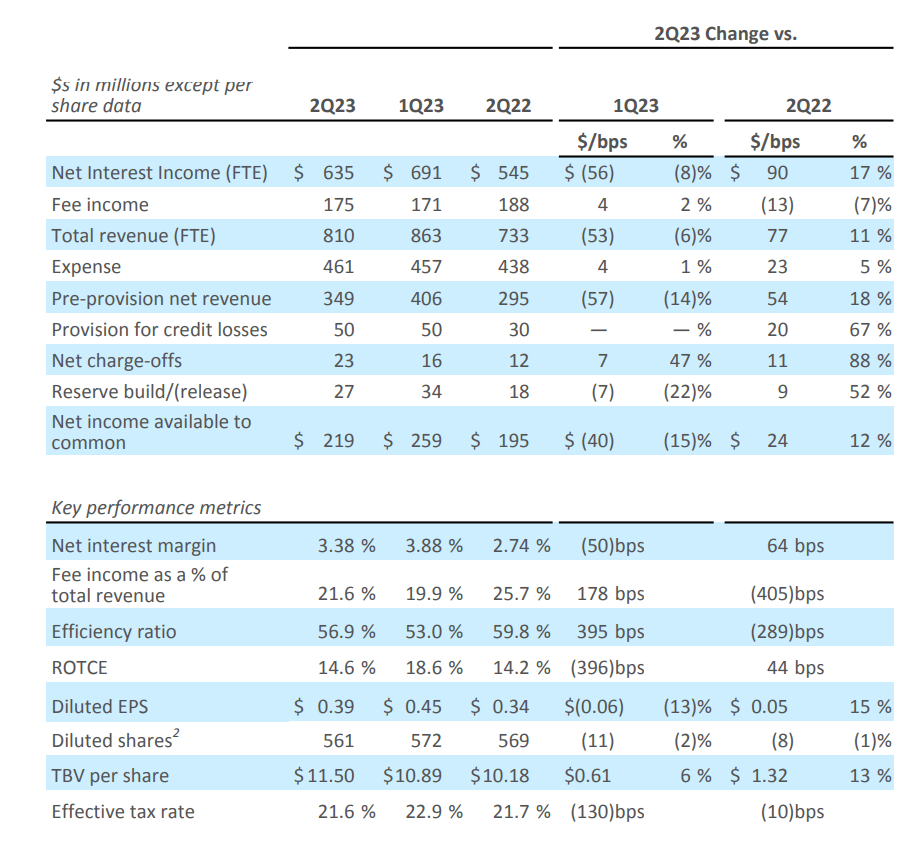
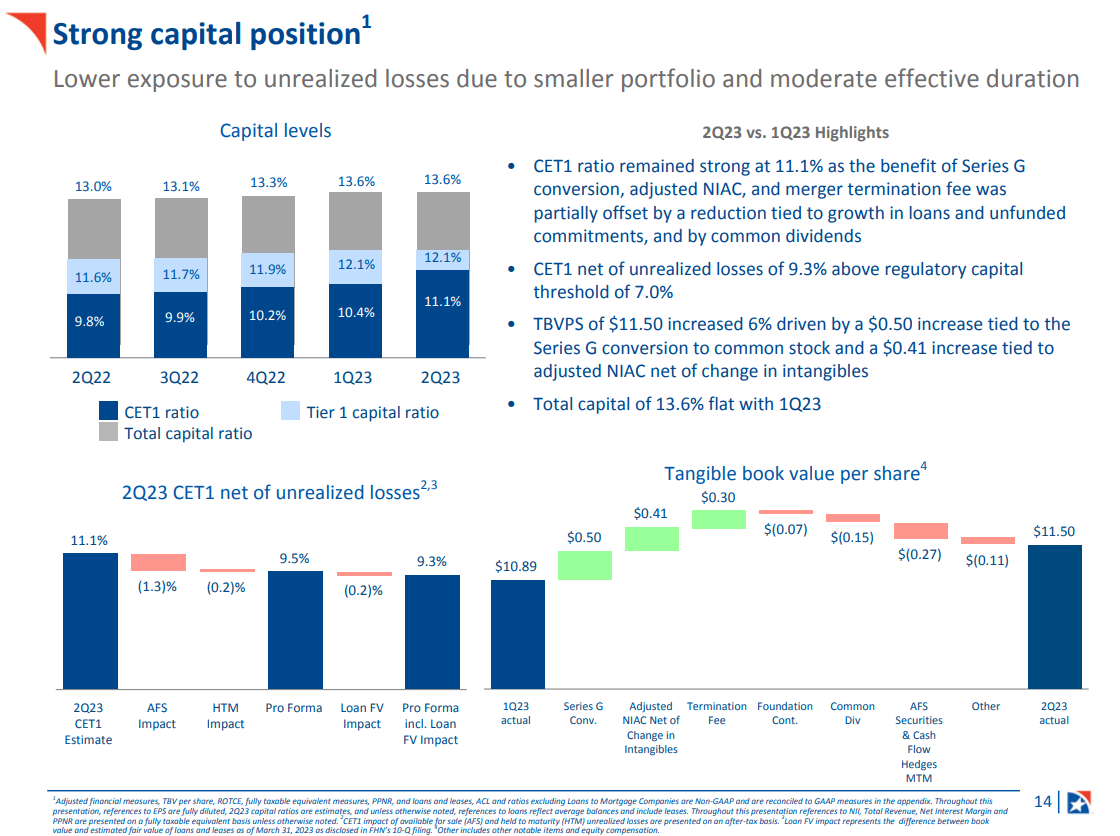
Despite the difficulties of the business and the sector in the second quarter of 2023, First Horizon recorded adequate financial performance. The bank's adjusted earnings per share were $0.39, and its return on tangible common equity was a healthy 14.6%. Capital adequacy has improved, with CET1 growing to 11.1%. The image below from the 2Q23 presentation shows some highlights from the last quarter.
The efficiency ratio has declined due to narrowing Net Interest Margins ((NIM)).
The deposit base has increased with over $6 billion in additional assets. The credit market performed well, with net charge-offs at the lower end of the forecast and a $21 million drop in non-performing loans. Despite acknowledging industry challenges like growing deposit competition and macroeconomic instability, the bank`s management expressed confidence in its capacity to produce top-quartile returns.
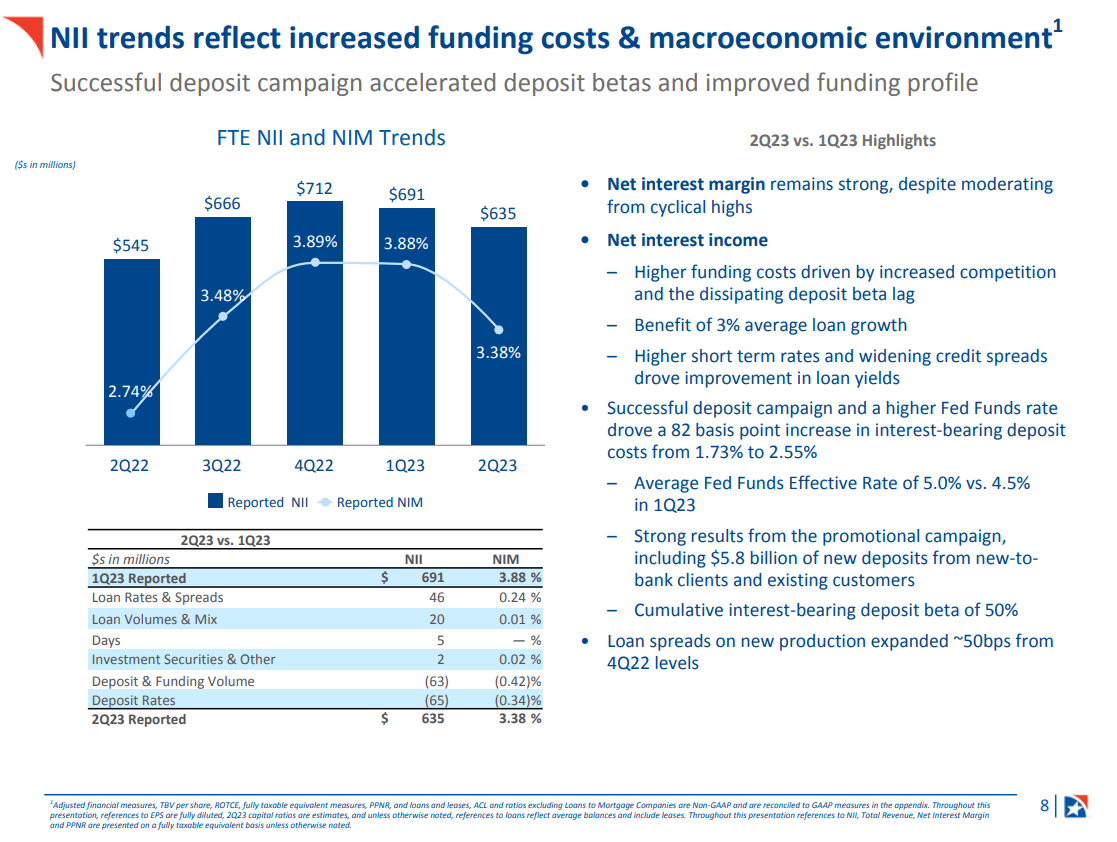
The chart below from the last presentation shows net interest income and net interest margin.
First Horizon's net interest margin has dropped to 3.38% from 3.88% the previous quarter. Their deposit campaign was very effective, bringing in over 32,000 new customers and a 6% increase in period-end deposits. Additionally, with growth spread across markets and portfolio categories, loans increased by 3% on average and 4% at the period's conclusion. The image below shows NII and NIM performance.
Bank financials
The table below shows some metrics I use to measure Banks's health. The data is taken from the last quarter's financial report .
| Asset ratios: assets structure |
| Cash/Total Assets |
| 1.44% |
| Loans (total) /Total Assets |
| 71.7% |
| Commercial Real Estate/Total Assets |
| 14.7% |
| Credit Cards/Total Assets |
| 0.7% |
| Mortgages/Total Assets |
| 15.4% |
| Commercial Loans/Total Assets |
| 34% |
| Mortgage-Backed Securities /Total Assets |
| 6.1% |
| Held to Maturity Securities/Total Assets |
| 1.58% |
| Available for Sale Securities/Total Assets |
| 10.1% |
| Liability ratios: capital structure |
| Deposits (total)/ Total Liabilities |
| 85% |
| NIB deposits /Total Deposits |
| 28.7% |
| IB deposits/Total Deposits |
| 71.2% |
| Long-term debt/ Total Liabilities |
| 1.2% |
| Company notes/ Total Liabilities |
| 10.2% |
| Equity/ Total Liabilities + Equity |
| 10.4% |
| Solvency ratios: |
| Loans /Deposits |
| 93.6% |
| Cash/Deposits |
| 1.8% |
| Borrowings (inc. bonds)/ Total Assets |
| 10.5% |
FHN has low exposure to held-to-maturity ((HTM)) securities at 1.58%. This figure is impressively low for a regional bank. In other words, FHN is relatively immune to rising interest rates and declining bond prices.
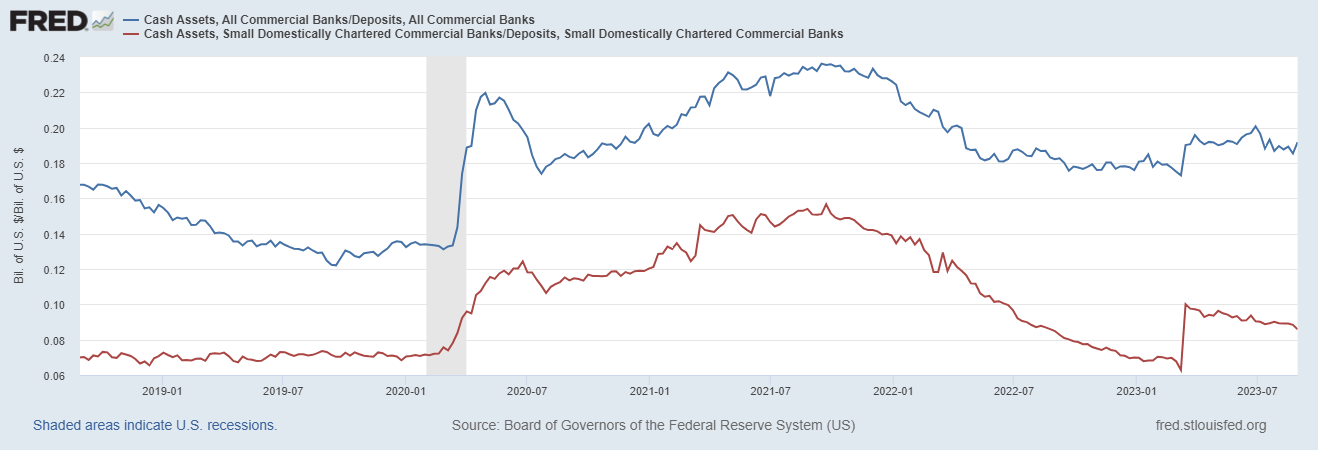
FHN has a few red flags in its balance sheet. The first issue is the bottom level of the cash-to-deposits ratio. The average figure for regional banks (red line) is above 8.5%, while for the whole banking system (blue line) is 18.5%, as shown on the chart below from FRED.
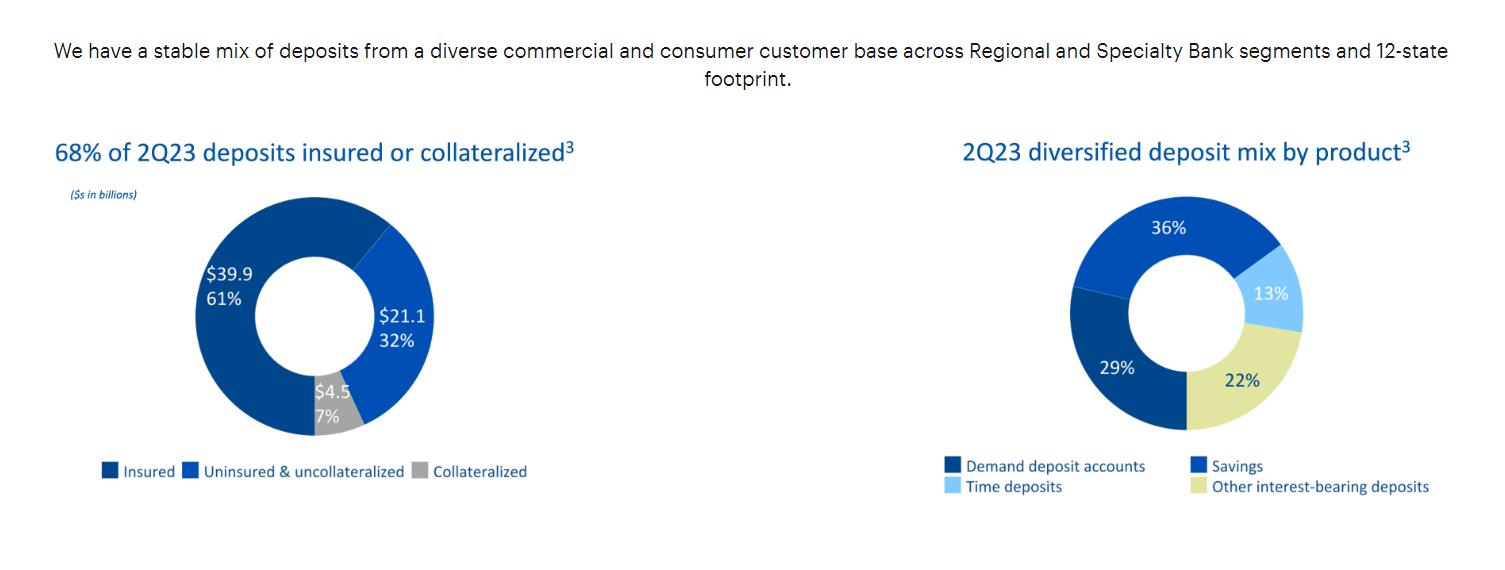
The second red flag is the relatively low percentage of insured deposits, 39.9%. The chart below shows deposit base composition by type and by coverage.
This fact by itself is not an issue. It is the opposite, which means the bank is self-reliant. However, when you add the bottom cash-to-deposit ratio, the potential for liquidity squeeze during a banking system downturn becomes apparent.
Let's go deeper into deposit composition. 71% of the deposit base is represented by interest-bearing deposits, as shown on the graph below:
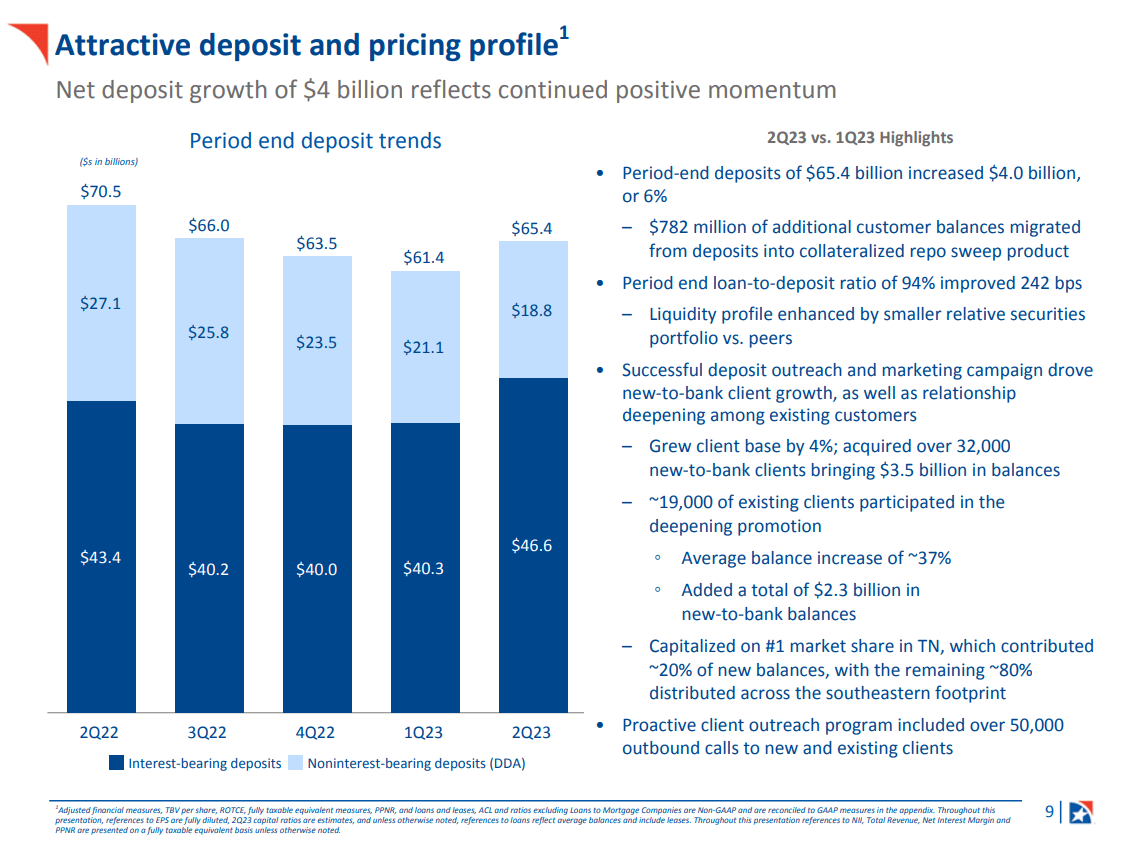
This means lower net interest margins due to the higher cost of funding, though it mitigates the banks` liquidity risk. Given both red flags, a high percentage of interest-bearing deposits put some buffer around banks' liquid funds. Nevertheless, in case of a credit event, that moat will vanish as quickly as panic spreads around.
The loan portfolio, on the other hand, is adequately diversified, as seen below.
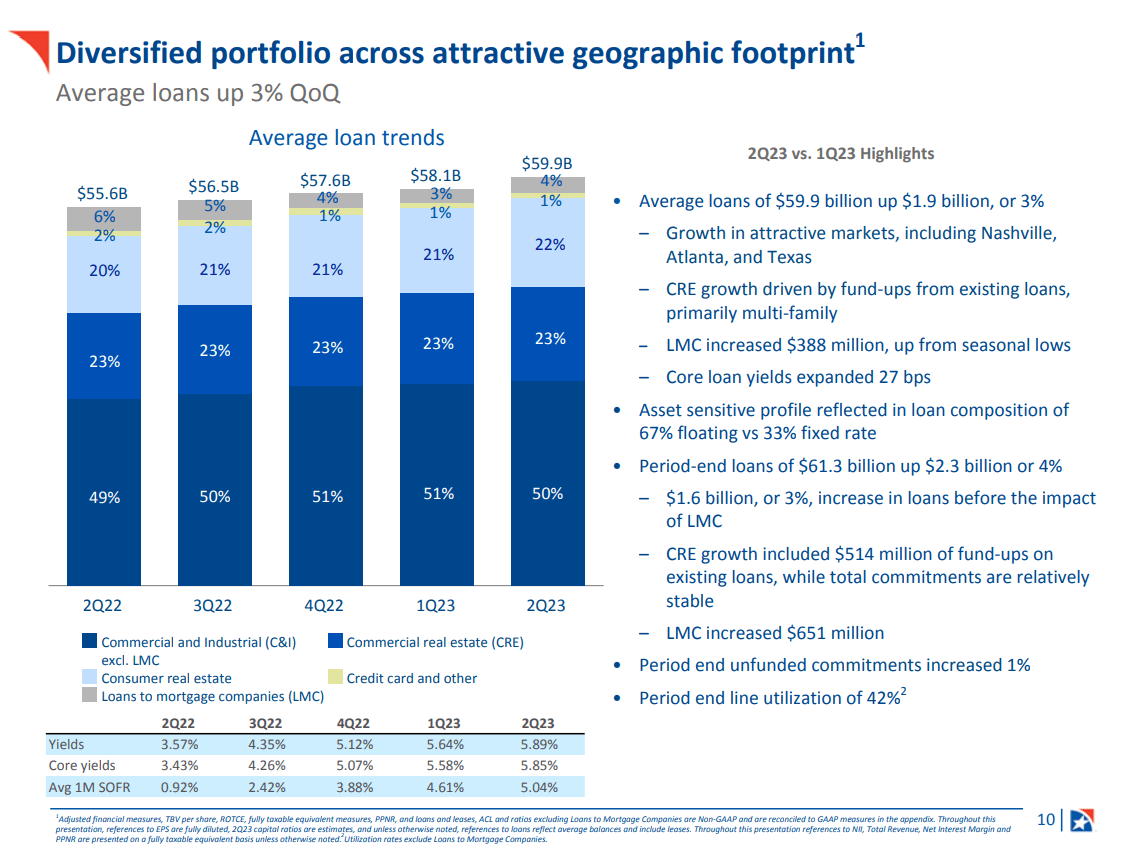
Commercial Real Estate represents a relatively high percentage for my taste. However, most are in Florida (26%) and Texas (12%). Besides that, multi-family properties constitute 6% of total loans. Credit quality is stable despite slightly higher NPLs. The figure below shows credit metrics at a glance.
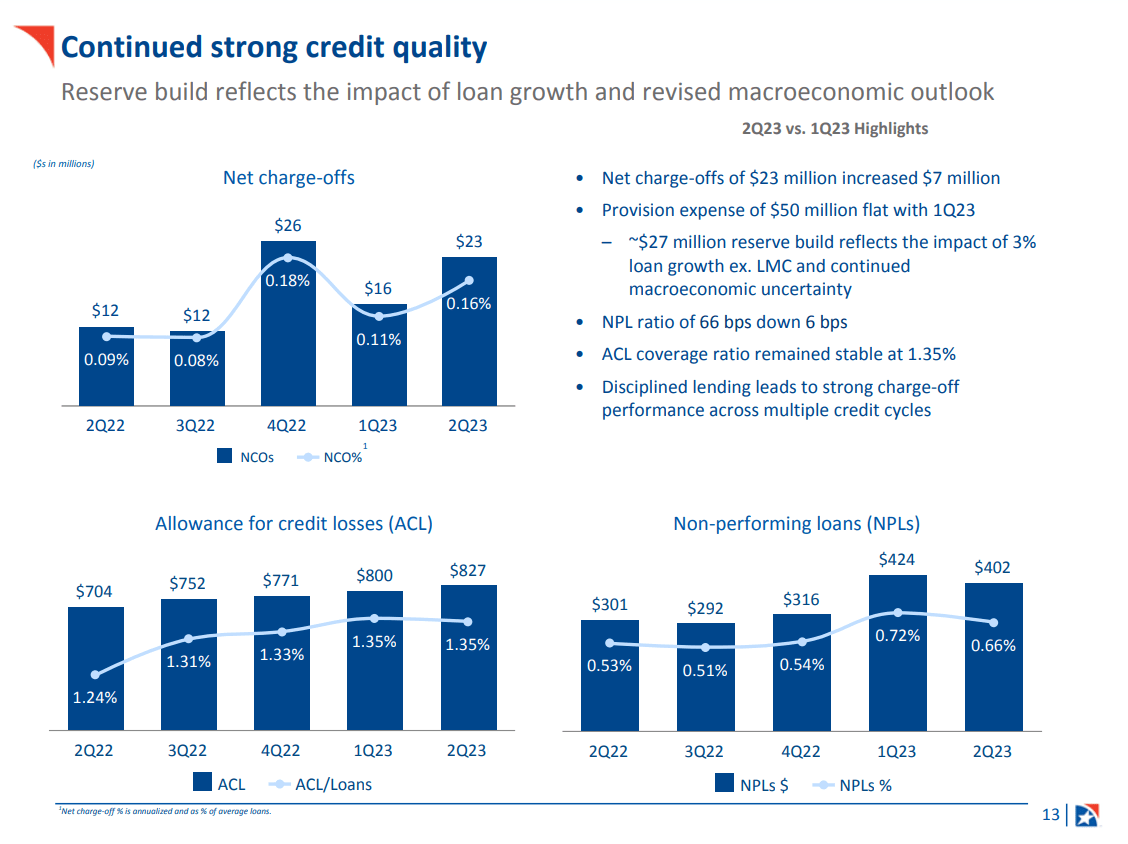
Charge-off has increased but not significantly to affect banks' stability. Since the tumulus 1Q23, the banks have stabilized their credit metrics. That said, FHN`s credit risk is under control for now. The 3Q23 report will validate that observation or not.
Talking about risk, any discussion is incomplete without Basel III metrics. FHN has made progress despite the turbulence surrounding regional banks. The table below shows capital adequacy ratios. The data is taken from the last financial report .
| Capital (in billions of dollars): |
| Regulatory Capital |
| 55.4 |
| Tier 1 capital |
| 7.53 |
| Common equity tier 1 ((CET1)) |
| 6.73 |
| Risk-Weighted Assets |
| 6.15 |
| Basel III Ratios: |
| Regulatory capital ratio (Capital adequacy ratio) |
| 13.6% |
| Tier 1 ratio |
| 12.1% |
| CET1 ratio |
| 11.1% |
Banks' capital adequacy has shown consistent improvement during the last 12 months. Most importantly, that growth comes from rising core capital, i.e., CET1. That means the bank does not rely heavily on additional capital AT1 and T2 in a crisis. The mentioned are usually hybrid securities such as various convertible bonds. In a solvency crisis, the bank can transform it into equity to maintain its core capital position.
The bank's performance is above its peers. Even with declining NIM in the last quarter, FHN performed well. The table below shows the profitability metrics I use to assess banks' efficiency.
| ROE |
| 13.9% |
| RoTE |
| 15.3% |
| RoCET 1 |
| 18.01% |
| ROA |
| 1.3% |
All figures exceeded FHN's five-year average and regional banks' average. FHN income consists of 28% noninterest income and 72% interest income. These proportions do not provide a sufficient buffer for declining net interest margins. In the long term, FHN has to diversify its revenue with a higher percentage of noninterest inflows.
Compared to its peers, the bank pays dividends with a respectable yield of 5.46%.
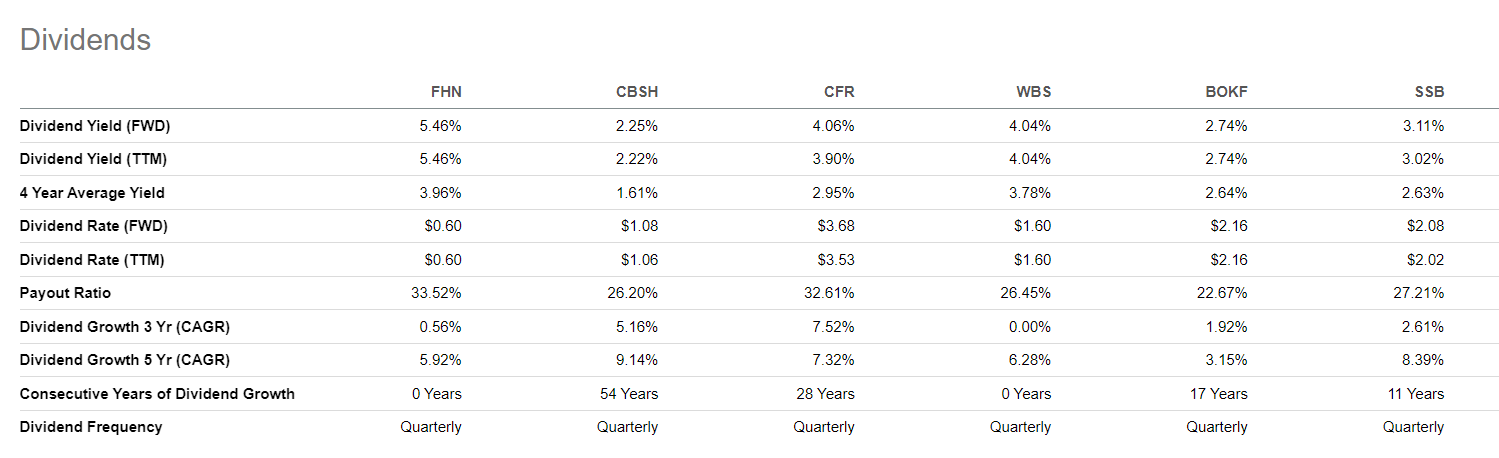
Company valuation
FHN has been paying insignificant dividends for the last few years. I use the Dividend Discount Model to value the company. I follow Professor Damodaran's framework and database.
Assumptions and inputs:
- Risk-free rate equals the 5Y average of USA long-term Government bond Rate, 2.2%.
- Growth rate, g, equals the 5Y average of the USA long-term Government bond Rate, 2.2%.
- US equity risk premium of 5.00%.
- FHN' unlevered Beta 0.96
- FHN debt/equity ratio is 102%.
- The US's effective tax rate is 25%
- FHN dividend ((TTM)) $0.6
1. Calculate Levered Beta with the formula below:
Levered Beta = Unlevered Beta * (1+D*(1-T)/E).
2. Calculate the discount rate (discount rate as the cost of equity) using the resulting value for leveraged beta. The formula I use is:
Cost of Equity = Risk-Free Rate + (Levered Beta * Equity Risk Premium).
3. Calculate the Terminal Value of dividends considering the Cost of Equity and Expected dividend growth:
Terminal Value = Dividend per share * (1 + expected dividend growth) / (Cost of Equity - Expected Dividend Growth)
4. Calculate the Present Value of Terminal Value assuming a constant discount rate for ten years.
For FHN, I get the following results:
Intrinsic value per share = $ 8.38
Current Market price = $ 11.02 on Sept 30, 2023
Based on the dividend discount model, FHN is overvalued at 31.5%.
I compare FHN with the following banks:
- Commerce Bancshares Inc ( CBSH )
- Cullen/Frost Bankers ( CFR )
- Webster Financial Corporation ( WBS )
- BOK Financial Corporation ( BOKF )
- SouthState Corporation ( SSB )
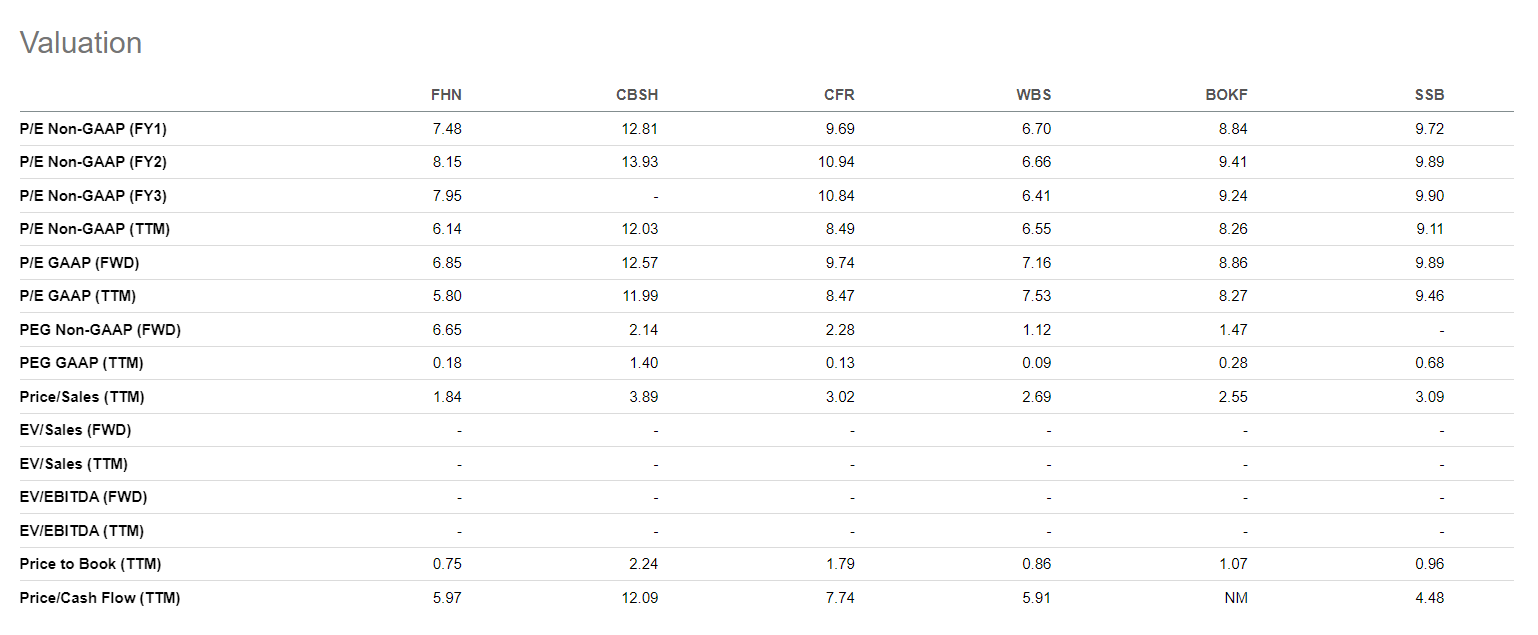
Using forward PE metrics, Price to Book, and Price to Sales, FHN is the cheapest among its peers. I guess Mr. Market correctly values FHN issues despite generous dividends.
Risks
Many people expect to have a banking crisis like 2008. I don`t think so. Of course, we might experience another turbulence sooner or later; however, the driving forces behind it will differ. The banks have apparent issues hidden elsewhere, not where the majority is focused.
Minimum capital requirements for banks are now much higher than in 2008. In the current context, home values have been much more "sticky"; few residential mortgages are significantly underwater. While there is some pressure on commercial real estate ((CRE)) loans due to declining office property values, this is also not a widespread issue. Notably, the geographical and type diversification of FHN's CRE loans is vital. That said, FHN credit risk is well diversified.
However, the red flag is banks` liquidity. The low cash-to-deposits ratio and only 40% insured deposits undermine banks' survivability. That said, even a local banking issue could cause a liquidity squeeze on FHN, resulting in a solvency crisis.
Conclusion
FHN has low exposure to CRE and HTM, the two-time ticking bombs in any regional bank balance sheet. However, its liquidity is undermined by a significantly low cash-to-deposit ratio of 1.44% and only 40% insured deposits. Even a mild economic storm might push FHN into profound distress. Despite being notably cheaper than its peers and having dividends with respectable yields, I give FHN a hold rating.
For further details see:
First Horizon: Good Bank And Healthy Dividend But Questionable Liquidity