DKS - Five Below: Good Firm Overall But You Can Pay Too Much For Growth
2023-03-09 19:27:38 ET
Summary
- Five Below, Inc. is heavily overvalued according to Discounted Cash Flow Model and Comparable Company Analysis Metrics.
- Ratio analysis indicates strong historical trends accompanied by current warning signals.
- Investors can overpay for growth, a good firm must be bought at a fair valuation.
- Monitor their liquidity, inventory, and margins in the upcoming Five Below, Inc. reports for insight into their potential 2023 trend.
Thesis - Hold/Sell
Five Below, Inc. ( FIVE ) is a good business that is heavily overvalued at its current price action.
The overall growth trend and general ratios indicate positive aspects, though there are a few concerning LTM signals along with comparable peer group underperformance.
Investors must seek to pay a fair price for a good business. There is no doubt that FIVE is a fast-growing and trending business, however, the current price is severely overvalued according to all metrics analyzed (according to Discounted Cash Flow ("DCF") Model & Comparable Analysis).
There is such a thing as paying too much for growth, though FIVE would be a good firm to own if the price action corrects to a more fairly valued range.
Business Profile - Snapshot Of Business Information
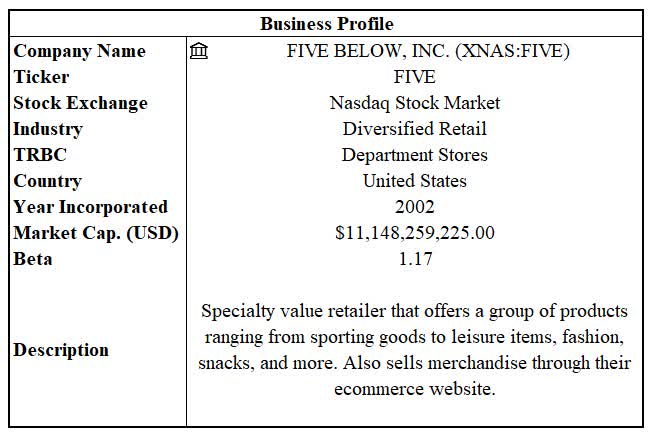
FIVE is a diversified retailer focusing on a purpose-driven differentiated experience for "tweens & teens and beyond." They distinguish themselves by focusing on their target customer, "wow-trends," value, shopping experience, and high growth since their inception in 2002. They now operate in 42 states ( last 10-Q ) and across almost 1,300 stores. They have a current enterprise value trading around $ 12.5 billion and a market capitalization of approximately $11.1 billion. They trade with a historical beta of 1.17 meaning that they portray more volatility than the overall market, which could imply an appeal to more growth focused investors.
Ratios - Providing Context To Recent Trends
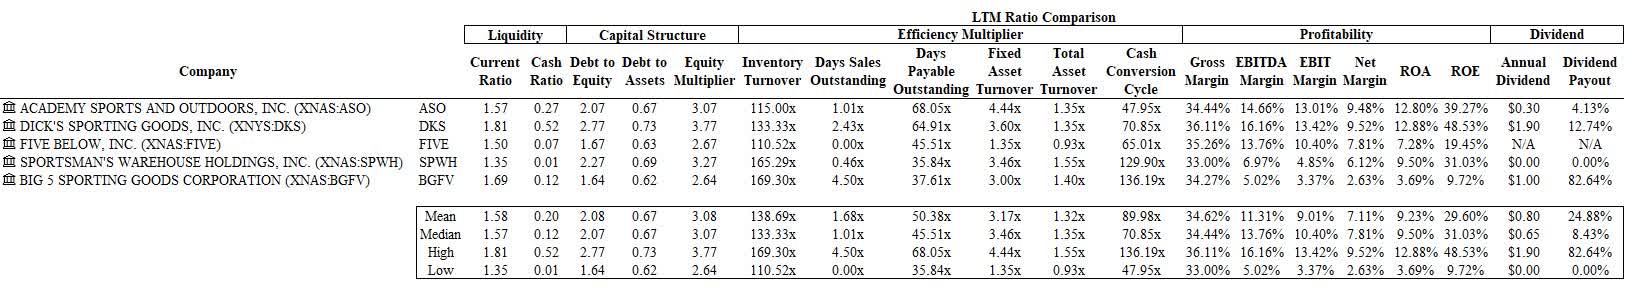
When analyzing FIVE, utilizing ratio analysis can provide powerful insights into their recent performance. A peer group of comparable companies was also utilized to provide perspective for the ratios and metrics analyzed and is referenced throughout the analysis. The companies incorporated into this analysis are DICK'S Sporting Goods ( DKS ), Academy Sports and Outdoors ( ASO ), Sportsman's Warehouse Holdings ( SPWH ), and Big 5 Sporting Goods ( BGFV ).
Liquidity Ratios - Weak In Cash Position But Overall Covered
Takeaway: FIVE liquidity ratios show mixed readings. A current ratio above 1 and a strong internal growth focus could reap rewards for investors while a decreasing cash position, lesser competitive liquidity metrics to their peer group, and contracting ratios could be a warning sign for future stress on their balance sheet .
The FIVE current ratio has declined from 1.89 to 1.5 since 2020. While the balance sheet has grown overall, this ratio compression is due predominantly to a larger increase in current liabilities proportionality to current assets. FIVE also has a larger inventory position which could be a concerning leading indicator for their demand assumptions moving forward. Their cash holdings have decreased from a high of $269 million in 2021 to $44 million LTM which when placed into the cash ratio shows a largely decreasing ratio since 2020 (0.58 vs. 0.07 LTM). According to the most recent 10Q , FIVE believe their cash requirements will be sufficient for at least the next 12 months due to their cash management that utilizes operational activities and a credit arrangement. They also have a share repurchase authorization and intention to continue investing into new stores which explains their low cash balance as funding their growth though there is a clear disclaimer that basically states that they will obtain required debt or equity financing if needed and there are no assurances for investors to its availability or dilutive nature.
The FIVE liquidity ratios discussed are much lower than the median in comparison to their peer group which can be both a good or bad signal maybe indicating either exceptional cash management capabilities (growth/reinvestment focused) or a need for more cash in conjunction with a lesser ability to deal with future uncertainty.
It is important for the firm to mitigate liquidity risk moving into a more uncertain future macro-environment and while FIVE has trended in a mixed way, their short-term requirements do seem to be adequately met though they are more risky when benchmarked against their industry.
Liquidity (Author)
Capital Structure Ratios - Increasing Leverage Trend Has Generally Positive Signals For Investors
Takeaway: The capital structure ratios of FIVE show a movement towards a more leveraged capital structure indicating a less conservative balance sheet over time. This could potentially help profitability since debt acts as a tax shield, but if not strategically optimized, it contrarily increases risk to the firm, though their capital structure ratios are much lower than their peer group, which is a positive sign.
Evaluating the capital structure of FIVE shows a small increase in the amount of leverage across all the ratios. The debt/equity ratio has moved from 1.58 to 1.67, signifying a faster growth in liabilities vs. equity. The debt/assets ratio increased from 0.61 to 0.63 from increasing liabilities faster than increasing assets. The equity multiplier increased from 2.58 to 2.67 meaning that the equity grew slower than the assets of the firm. These ratios will affect the profitability of the different shareholders and the tax burden of the company as determined by their capital structure. What this could signify is that FIVE is increasing their leverage, which increases their solvency risk (really important), though it could also result in increased profitability for shareholders if it is optimized appropriately. When comparing their LTM capital structure ratios to their peer group, they are trending well below the averages, signifying a healthier balance sheet and potentially more resilience into an uncertain future environment.
Capital Structure (Author)
Efficiency Ratios - Tough To Beat 2022, Keep An Eye On Future Inventory
Takeaway: The cash conversion ratio components show a bettering trend between 2020 and 2022, while investors should monitor the upcoming results closely regarding the recent declined inventory turnover. FIVE also underperforms at turning their assets into sales, meaning that their growth will be more asset intensive vs. their peer group.
The inventory turnover ratio has increased substantially since 2022 (74 days vs. 111 days LTM) highlighting the decreased demand for their inventory. The days sales outstanding are approximately zero while the days payable outstanding increased from 36 days to 46 days. Assuming the inventory turnover is a short-term anomaly, the other ratios are both positive aspects over the longer trend which had helped decrease the cash conversion cycle between 2020 and 2022 (52 days vs. 40 days). The LTM cash conversion cycle was at 65 days due to the low inventory turnover ratio. What this means for investors is that the company was taking less days to produce cash between 2020 and 2022 (positive trend) while the LTM moved in a largely concerning manner and the inventory turnover should be monitored closely moving forward.
The firm showed a decreasing asset turnover and total asset turnover which is a result of their proportion of sales to net fixed assets and total assets. This is also a negative trend for investors and typically results in worsening profitability (all else remaining equal).
FIVE does maintain more competitive metrics in the cash conversion cycle components signaling a competitive advantage while their asset turnover ratios are less efficient compared to their peer group.
Efficiency Ratios (Author)
Profitability Ratios - Monitor Those Future Margins
Takeaway: FIVE has trended their margins in a rather stable manner across the board from 2020 to 2022 though there is a decrease in some of the LTM vs. 2022 metrics. The ROE and ROA are standalone good values though they underperform their peer group which is a signal of weakness.
FIVE has had generally stable margins with a downside move through their LTM and recent quarter. According to their recent 10Q, the negative margin pressure was primarily caused by an increase in merchandise costs, store occupancy costs, and an increase in SG&A due to increased store-related expenses, and corporate expenses. Their ROA and ROE are good values overall for investors though the LTM has placed downward pressure on those values as well.
Compared to their peer group, their margins are in line with the median range while their ROE and ROA signal underperformance.
Profitability Ratios (Author)
Dupont Equation - Strong Performance Overall
The DuPont Equation can be utilized to help identify how the key drivers of shareholder return can be isolated independently (operating efficiency, financial leverage, and asset use efficiency). Breaking FIVE into the relevant key drivers of net profit margin, equity multiplier, and total asset turnover, we can easily identify how the shareholder's ROE is changing. The net profit margins have declined from the 2022 value of 9.79% to 7.81% LTM. The equity multiplier increased slightly indicating a positive leveraging effect and the total asset turnover shows a decrease since 2022. This all combined shows a strong ROE though it is being pressured down from multiple drivers which investors need to monitor diligently.
Dupont Equation (Author)
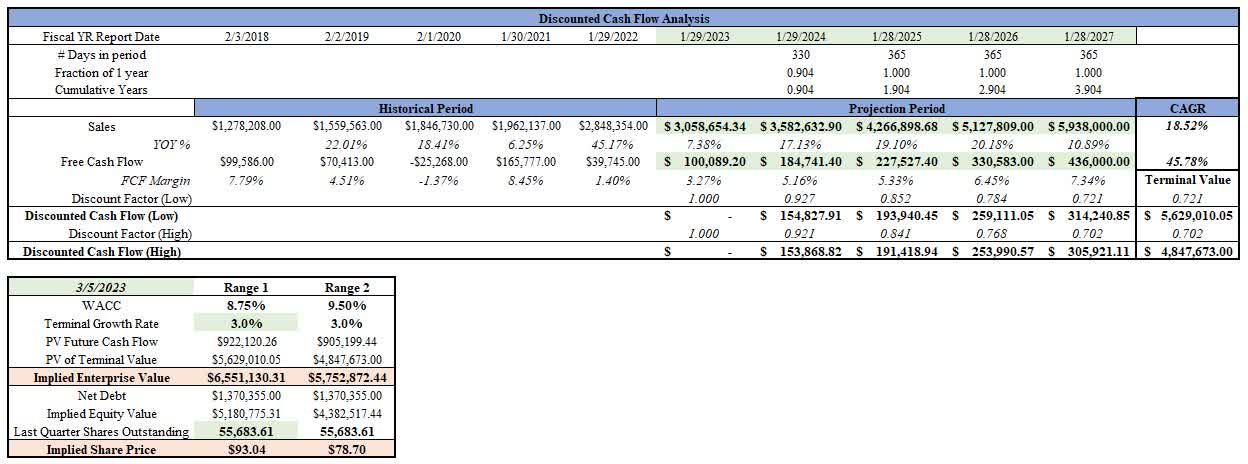
Discounted Cash Flow - Substantially Overvalued
Utilizing a Discounted Cash Flow - DCF - Model for FIVE allows investors to take a set of assumptions from the cash flow of the firm and determine an intrinsic value range. Utilizing analyst assumptions for growth, margins, and the derived WACC ranges as sourced from Finbox produces an implied intrinsic value for FIVE between $79 and $93. This WACC (discount rate) spread does not incorporate a margin of safety, as it is the estimated fair value of FIVE. As of this writing, FIVE was trading at approximately $200 signaling a current overvaluation according to this DCF model.
Comparable Company Analysis -Both Equity & Enterprise Comparable Metrics Signal Overvalued
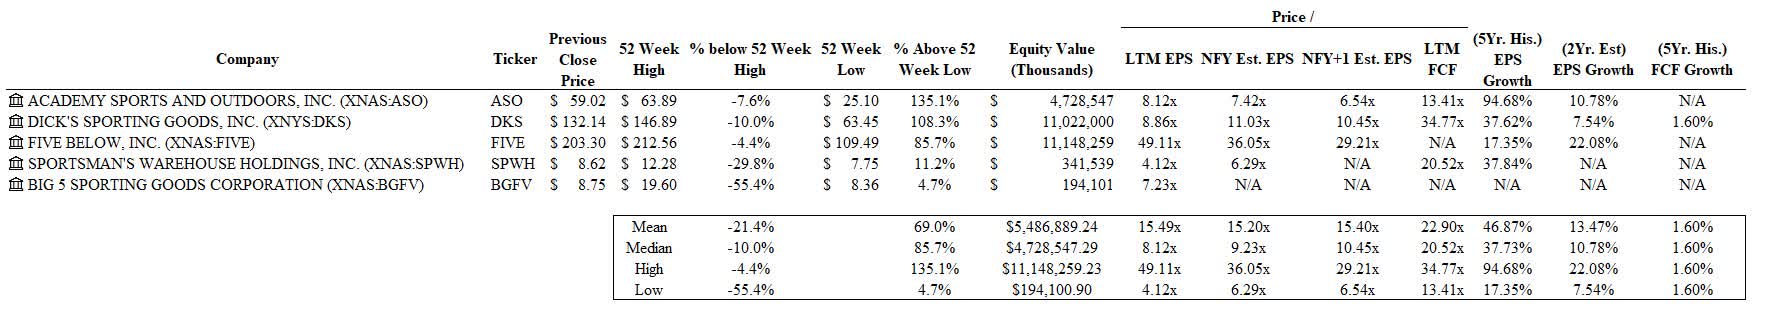
FIVE trades in the overvalued range based on most equity multiples compared to their peer group.
Analyzing the equity values of the group as a whole helps portray valuable insights into the multiples at which FIVE trades. FIVE is one of the larger sized firms by market capitalization and currently trades at a LTM P/E of 48.5x which is a substantial outlier compared to the median value. Forecasting into the Next Fiscal Year ((NFY)) and above (NFY + 1) shows that the analyst predictions of FIVE move to a healthier P/E ratio of 35.6x and 28.9x but are still well above their industry median (which increases). FIVE also has grown its EPS over the past 5 years by a CAGR of 17.4% and is expected to grow by a CAGR of 22% over the next two years.
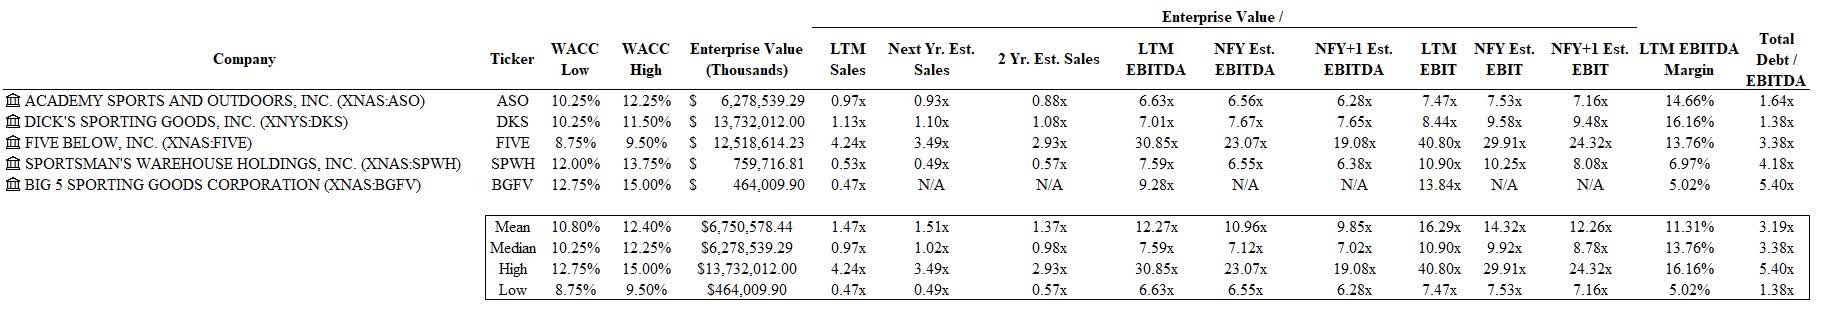
FIVE trades overvalued based on most enterprise multiples compared to their peer group.
FIVE trades well above the median according to the LTM EV/Sales multiple (4.2x vs. 0.97x median) and in the forecasted values compared to the peer group analyzed. They also trade above average in the LTM and predicted EV/EBITDA and EV/EBIT ratios while showing a healthy LTM EBITDA margin comparable and Debt/EBITDA ratio when compared to their peer group.
Valuation Ranges
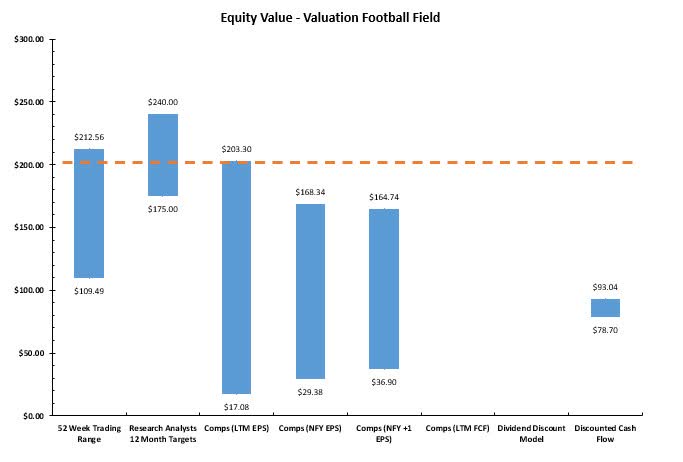
Equity Valuation Football Field
The Equity Valuation Football Field shows a visual representation of the value ranges based on a variety of equity metrics. According to the data, FIVE is trading within its fair value based on its 52-week trading range and analyst 12-month targets. Using the comparable metrics discussed prior and their equity discounted cash flow model, FIVE is trading high in comparison to the peer group represented above. Summarily, according to the equity valuation metrics, FIVE stock is currently trading at a significant premium to its fair equity value ranges.
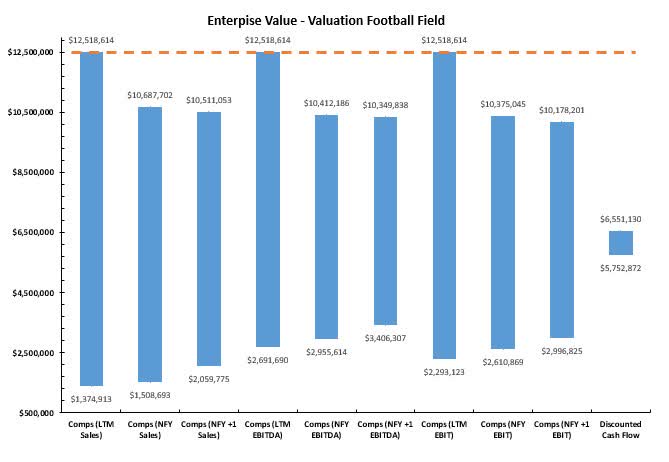
Enterprise Valuation Football Field
The Enterprise Valuation Football Field shows a visual representation of the value ranges based on a variety of enterprise metrics. The enterprise valuation theoretically provides a different perspective as it negates certain effects of capital structure that would be seen in the equity valuation. According to the data, FIVE is trading at a premium to its peer group regarding the comparable metrics. FIVE also seems to be trading well above their fair value according to the enterprise discounted cash flow model.
Risks
FIVE has many potential risks that can be expanded upon and read in their annual 10-K reports. This risk ranges from the uncertainty of the macro-environment, regulation & policy, operational, technology related, and based on whether the industry itself is in a declining market.
The results of this analysis were based on historical assumptions, analyst estimates, and inputs derived from other relevant research. Investors should consider their own risk profiles and utilize a margin of safety when investing to help mitigate these speculative characteristics and variance from their own opinions.
This article was also researched utilizing certain parameters that should not be concluded as all-encompassing. The perspective provided is largely quantitative and investors should add breadth to their research before they invest.
Conclusion - Good Company But WAY Overvalued
The quantitative analysis of FIVE shows a heavily overvalued firm growing at a fast rate with reasonably healthy operating metrics overall. The ratios show a positive overall business trend with some LTM signals that need to be monitored over the medium-term horizon.
See attached articles about why FIVE has potentially trended so well:
Article about discount store model business advantage .
Article supporting a buy rating .
Article supporting FIVE having defensive characteristics .
In contrary to those perspectives, the debating point that is a byproduct of this analysis and in conflict with current price action is as follows: Investors must seek to pay a fair price for a good business. There is no doubt that FIVE is a good and fast growing business, however, the current price is severely overvalued according to all metrics.
This contrarian view leads to a hold-sell rating depending on the return expectation of investors. An argument could be made for collecting profits due to the potential correction that may affect FIVE (both caused systematically and specifically). An argument could also be made for current positions with a substantially more reasonable cost basis and negative tax implications to ride the momentum forward.
There are plenty of investments that have better expected return potential, and Five Below, Inc. seems to be trading at such a high valuation that it could potentially have reverting moves back to more reasonable valuations. There is such thing as paying too much for growth though Five Below, Inc. would be a good firm to monitor if the price action corrects to a more fairly valued range.
For further details see:
Five Below: Good Firm Overall, But You Can Pay Too Much For Growth