FLNG - FLEX LNG: Is There A Better Alternative Currently? Apparently Not
2023-09-28 10:52:09 ET
Summary
- FLEX LNG offers a 10% yield, fully covered by its free cash flow.
- Its extensive contract backlog supports dividend payouts in the coming years.
- Its most interesting peer, Cool Company, may offer more growth potential due to spot market exposure, and other peers fall short for various reasons.
- This article is an in-depth review centered on fundamentals, judging FLEX LNG through the lens of an income-oriented investor looking for predictable dividend payouts.
Investment thesis
Are there viable alternatives to FLEX LNG (FLNG) in the LGNC owner-operator space for the income-oriented investor? That was the question I set out to answer in this analysis. While other publicly traded LNGC pure plays exist, none can match the contract backlog duration, management experience, strong ownership, fleet composition, and share liquidity of FLNG. It's fair to say that it behaves like a bond. And it is even domiciled in Bermuda.
If you're willing to trade growth for stability, FLNG may be the option you're looking for. Its peer, Cool Company, which has existed for more than a year after becoming an independent unit, offers exposure to the spot market in the coming years.
Introduction
I focus on fundamental analysis, the LNG market outlook, and peer review in this article. Peers Cool Company (CLCO), Awilco LNG (AWLNF), and Dynagas LNG Partners (DLNG) have been selected for comparison, as these are (1) similar to Flex LNG in that their main line of business is LNG shipping (LNGC pure plays) and (2) publicly listed companies. I will devote extra attention to Cool Company, as I regard it as Flex's leading peer due to its size and NYSE listing.
Some more prominent players are excluded due to being private and not publicly listed (Maran Gas Company, Gaslog, and BW). Nakilat and MISC were excluded due to their extensive product offerings, making them unsuitable for comparison. Hoegh LNG focuses on FSRUs, and Golar LNG focuses on FLNGs, as opposed to LNGCs.
Company profile
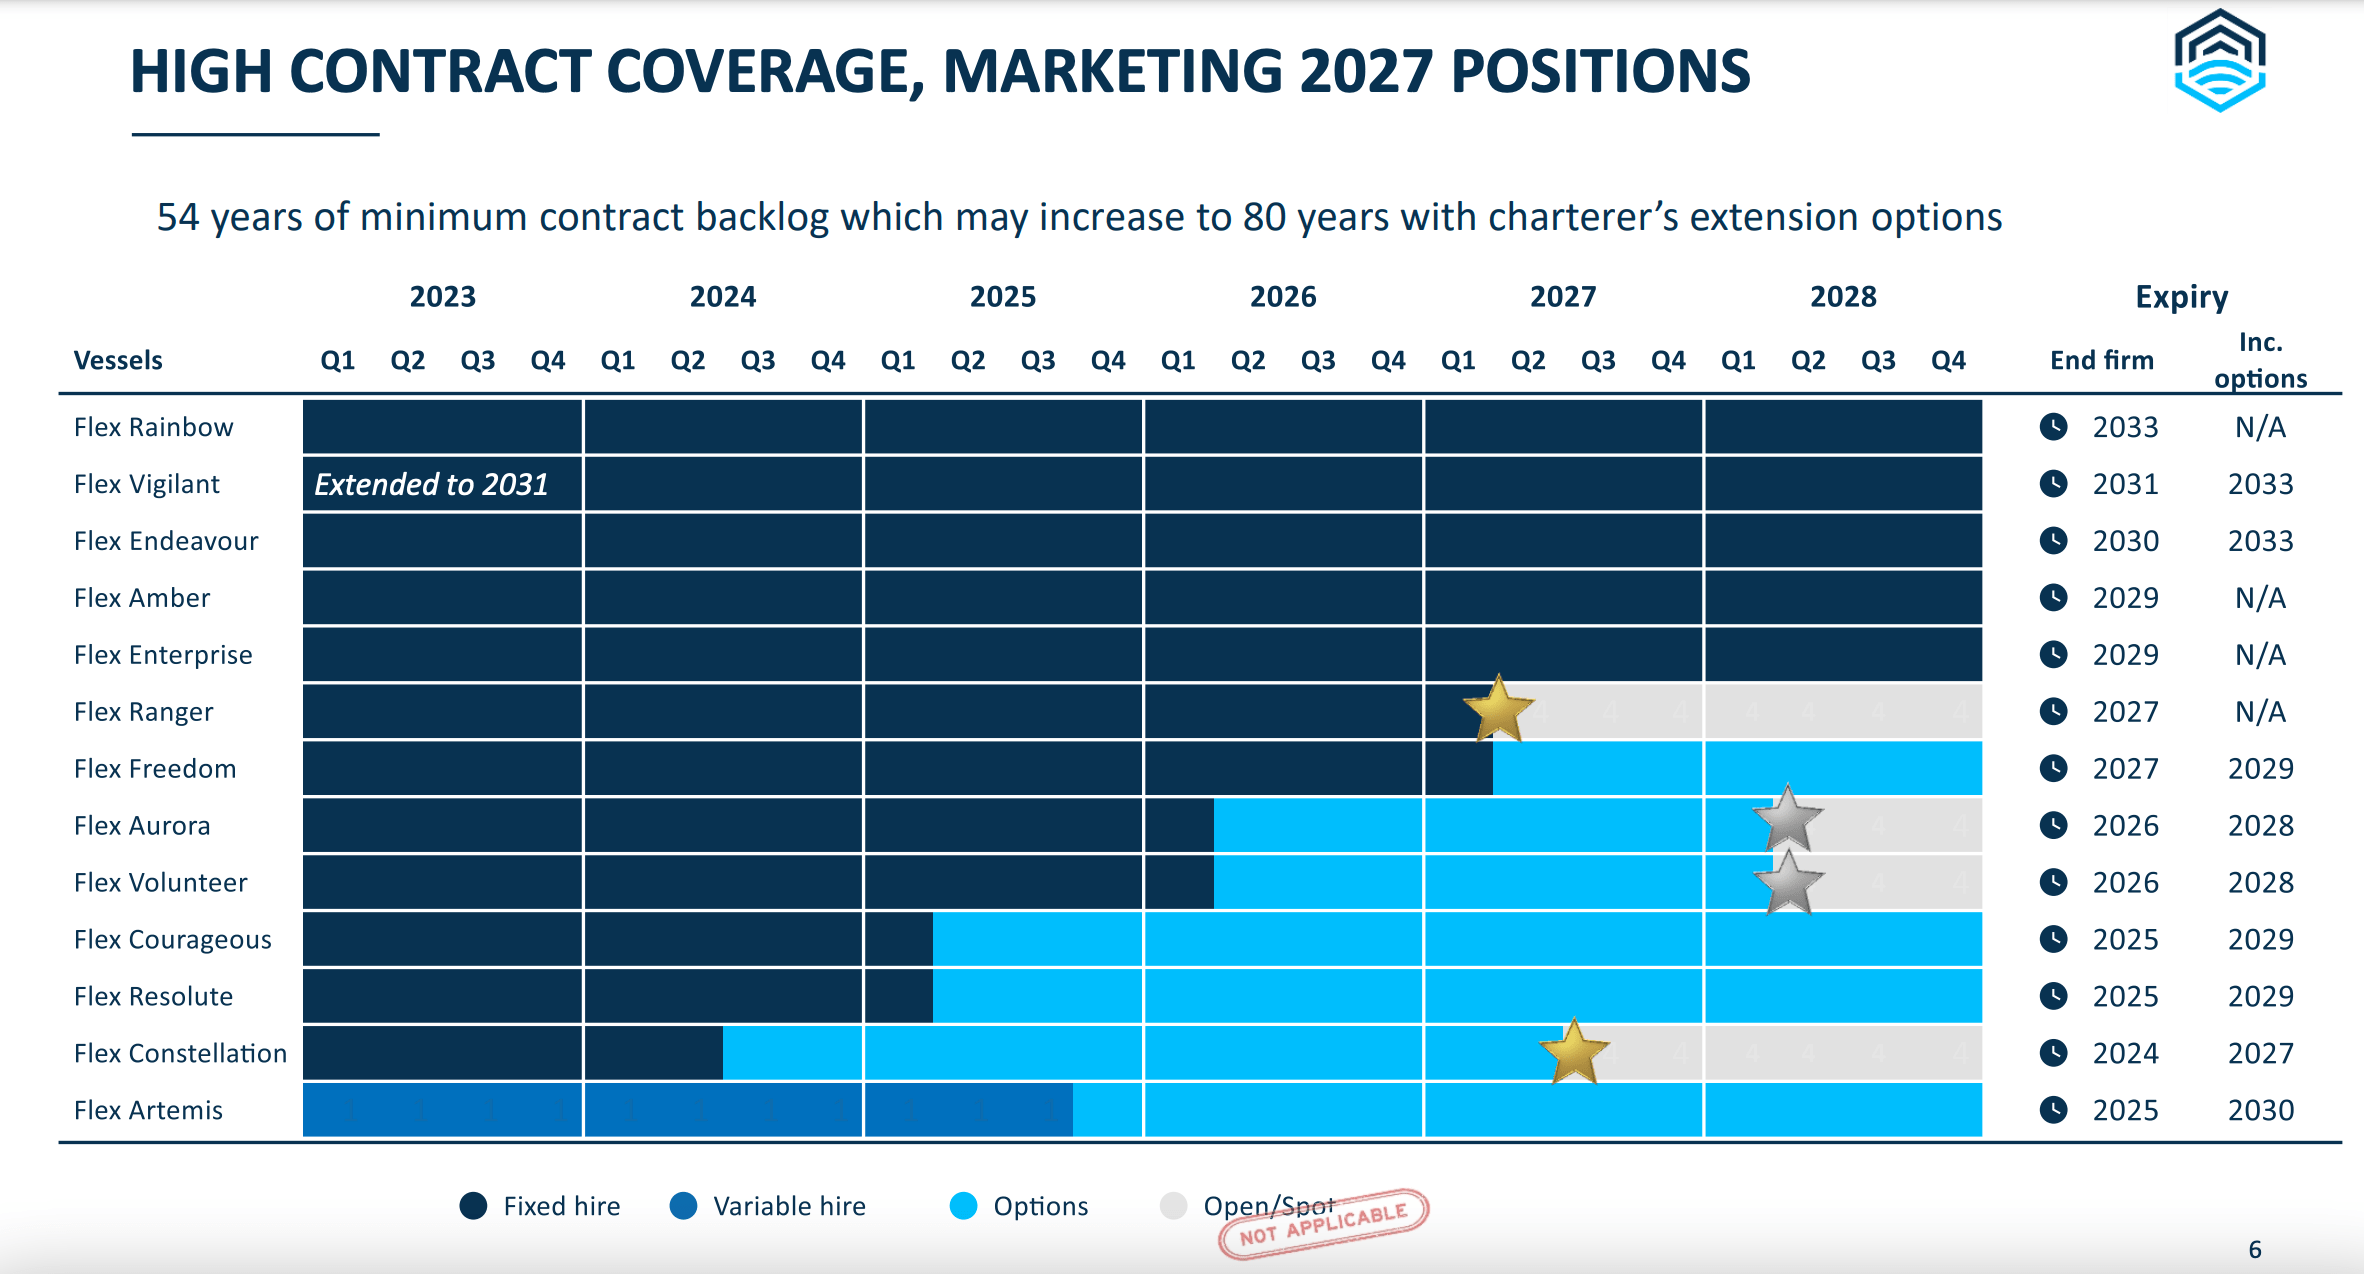
Flex LNG has thirteen LNG carriers in its fleet, all using modern MEGI and XDF propulsion systems. It is focused on long-term charter contracts, recently reporting 54 years of fixed backlog, with options possibly extending that to over 80 years. Twelve out of its thirteen vessels have fixed-rate contracts.
The share
Flex LNG is dual-listed on the NYSE (its primary listing) and the Oslo Stock Exchange (secondary listing). It is part of shipping tycoon John Fredriksen's publicly listed shipping portfolio.
Its NYSE shares are more liquid (higher trading volumes) than the OSE shares, which is a benefit. This setup and dynamic are comparable to its closest peer, Cool Company.
Let's review Flex LNG's share price development during the last two years and compare it to its peers.
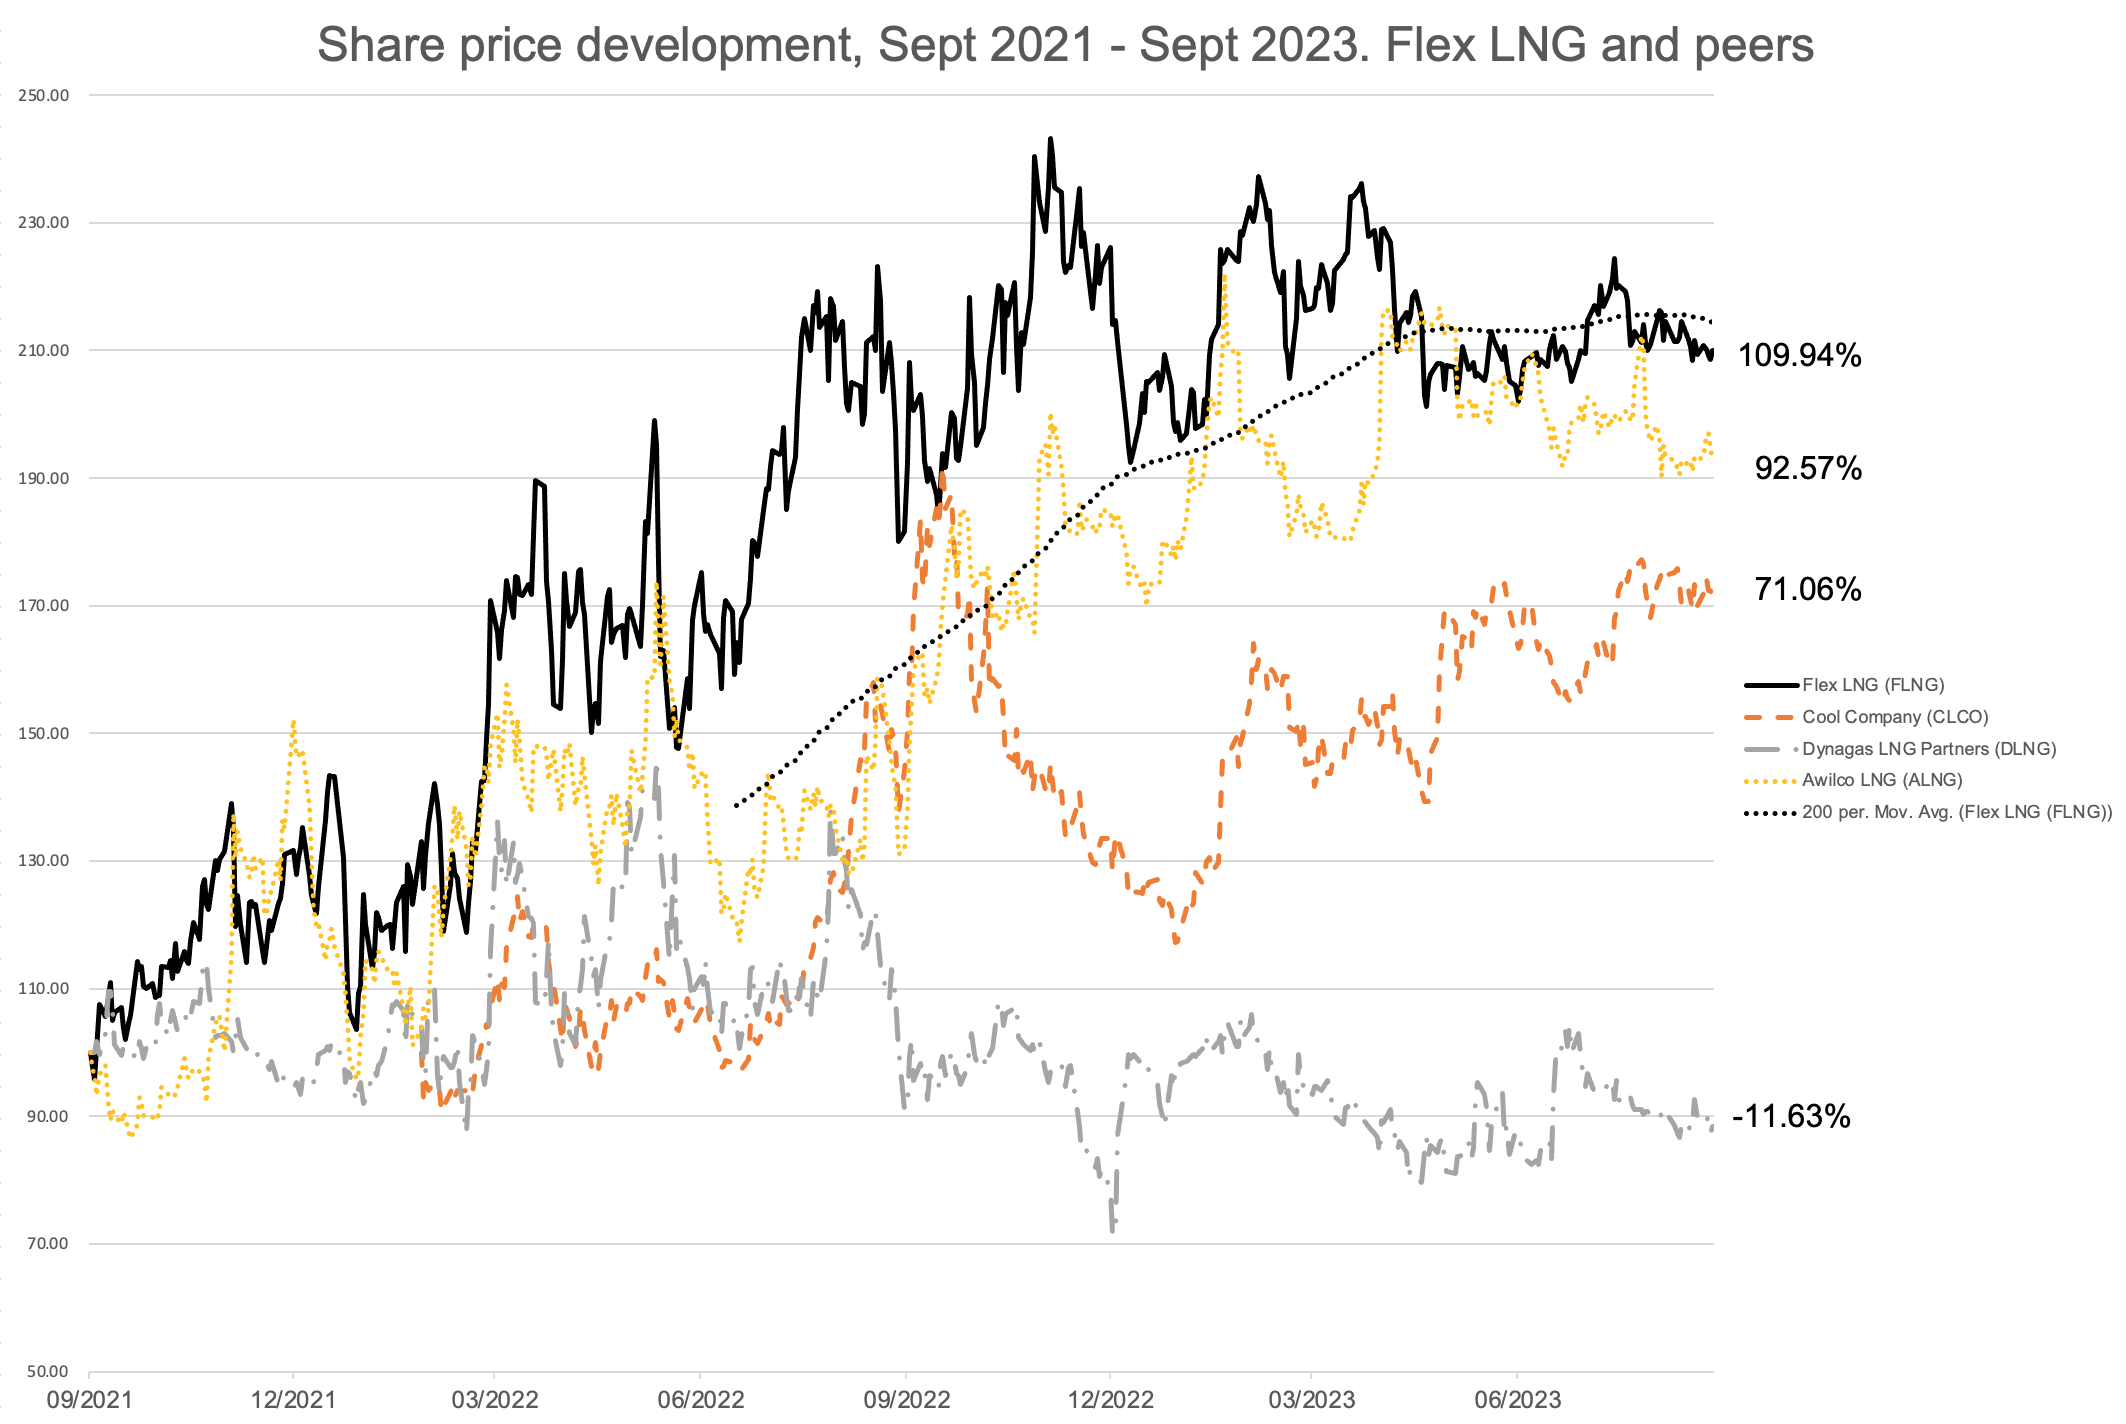
Share price development, Flex LNG, and peers (Author's calculations. Share prices rebased (Sept 21, 2021, = 100). Historical prices sourced from Euronext.com)
Flex and Awilco LNG have had similar trajectories, with both shares plateauing during 2023, possibly due to both following a long-term charter strategy, providing earnings visibility. Cool Company's share price crashed during the fourth quarter of 2022, while Dynagas's Series A Preferred Units declined by more than 11 percent. As Dynagas's common units have yet to be eligible for distributions since 2019 due to loan covenants, I've looked at its Series A Preferred Units instead.
Major shareholders
Its largest shareholder is Geveran Trading Co. Ltd., an investment vehicle of shipping tycoon John Fredriksen. As of March 10, 2023, Geveran held approximately 44.8% of Flex LNG's shares, according to its 2022 20F (p. 69) .
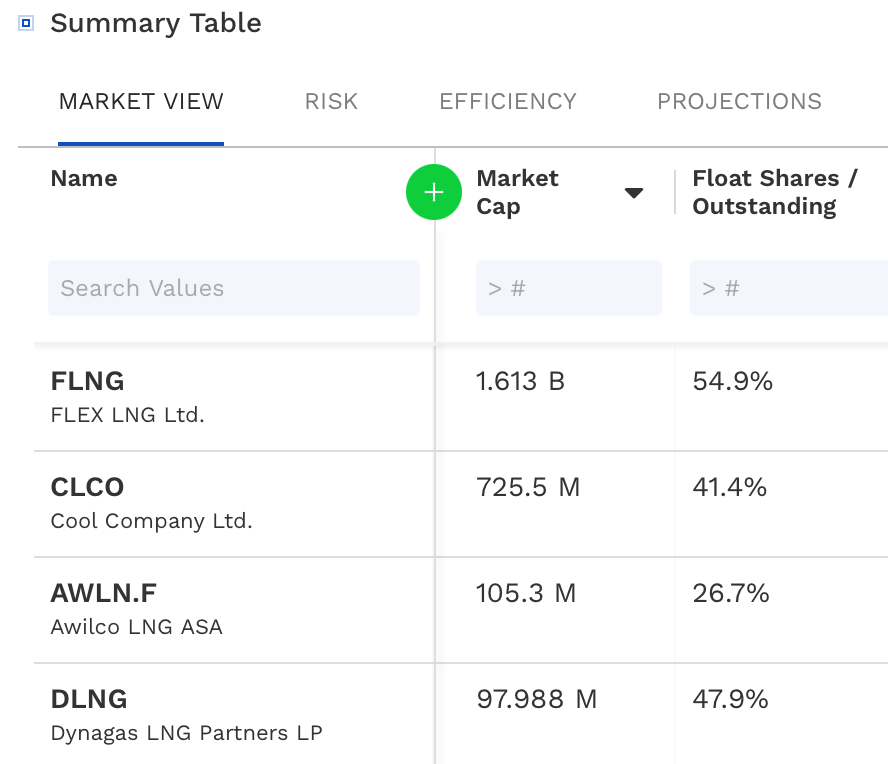
Its main peers also have relatively low free floats, as shown below. Eastern Pacific Shipping owns about 58 % of Cool Company, the Wilhelmsen Family about 39 % of Awilco LNG, and the Prokopiou family owns about 42% of Dynagas LNG Partners through Dynagas Holdings.
Flex LNG and peers. Market cap and free float (Finbox)
Management
Mr. Oystein Kalleklev, CEO of Flex LNG, joined the company in 2017 as CFO. In 2022, he took over the reins of another portfolio company of Mr. Fredriksen's empire, Avance Gas. In other words, he currently directs both Flex LNG and Avance Gas. Having had significant roles in the Fredriksen system for close to seven years is a testament to his ability to create results in the eyes of Mr. Fredriksen and his representatives.
As a bonus, Mr. Kalleklev is one of the few C-level executives posting helpful content on LinkedIn regularly. He is worthy of following on there. In addition, he periodically visits the Vonheim podcast , providing LNG market intelligence and displaying his excellent understanding of the business he's in.
Fundamentals
In this section, we will consider the following ratios:
- Earnings yield.
- Dividend yield. Flex LNG's dividend payout ratio will also be calculated from two perspectives.
- Price/Book.
- Net Debt/EBITDA.
- Enterprise Value/Market Cap.
Finally, we will look at the contract backlog.
Earnings Yield: Stable
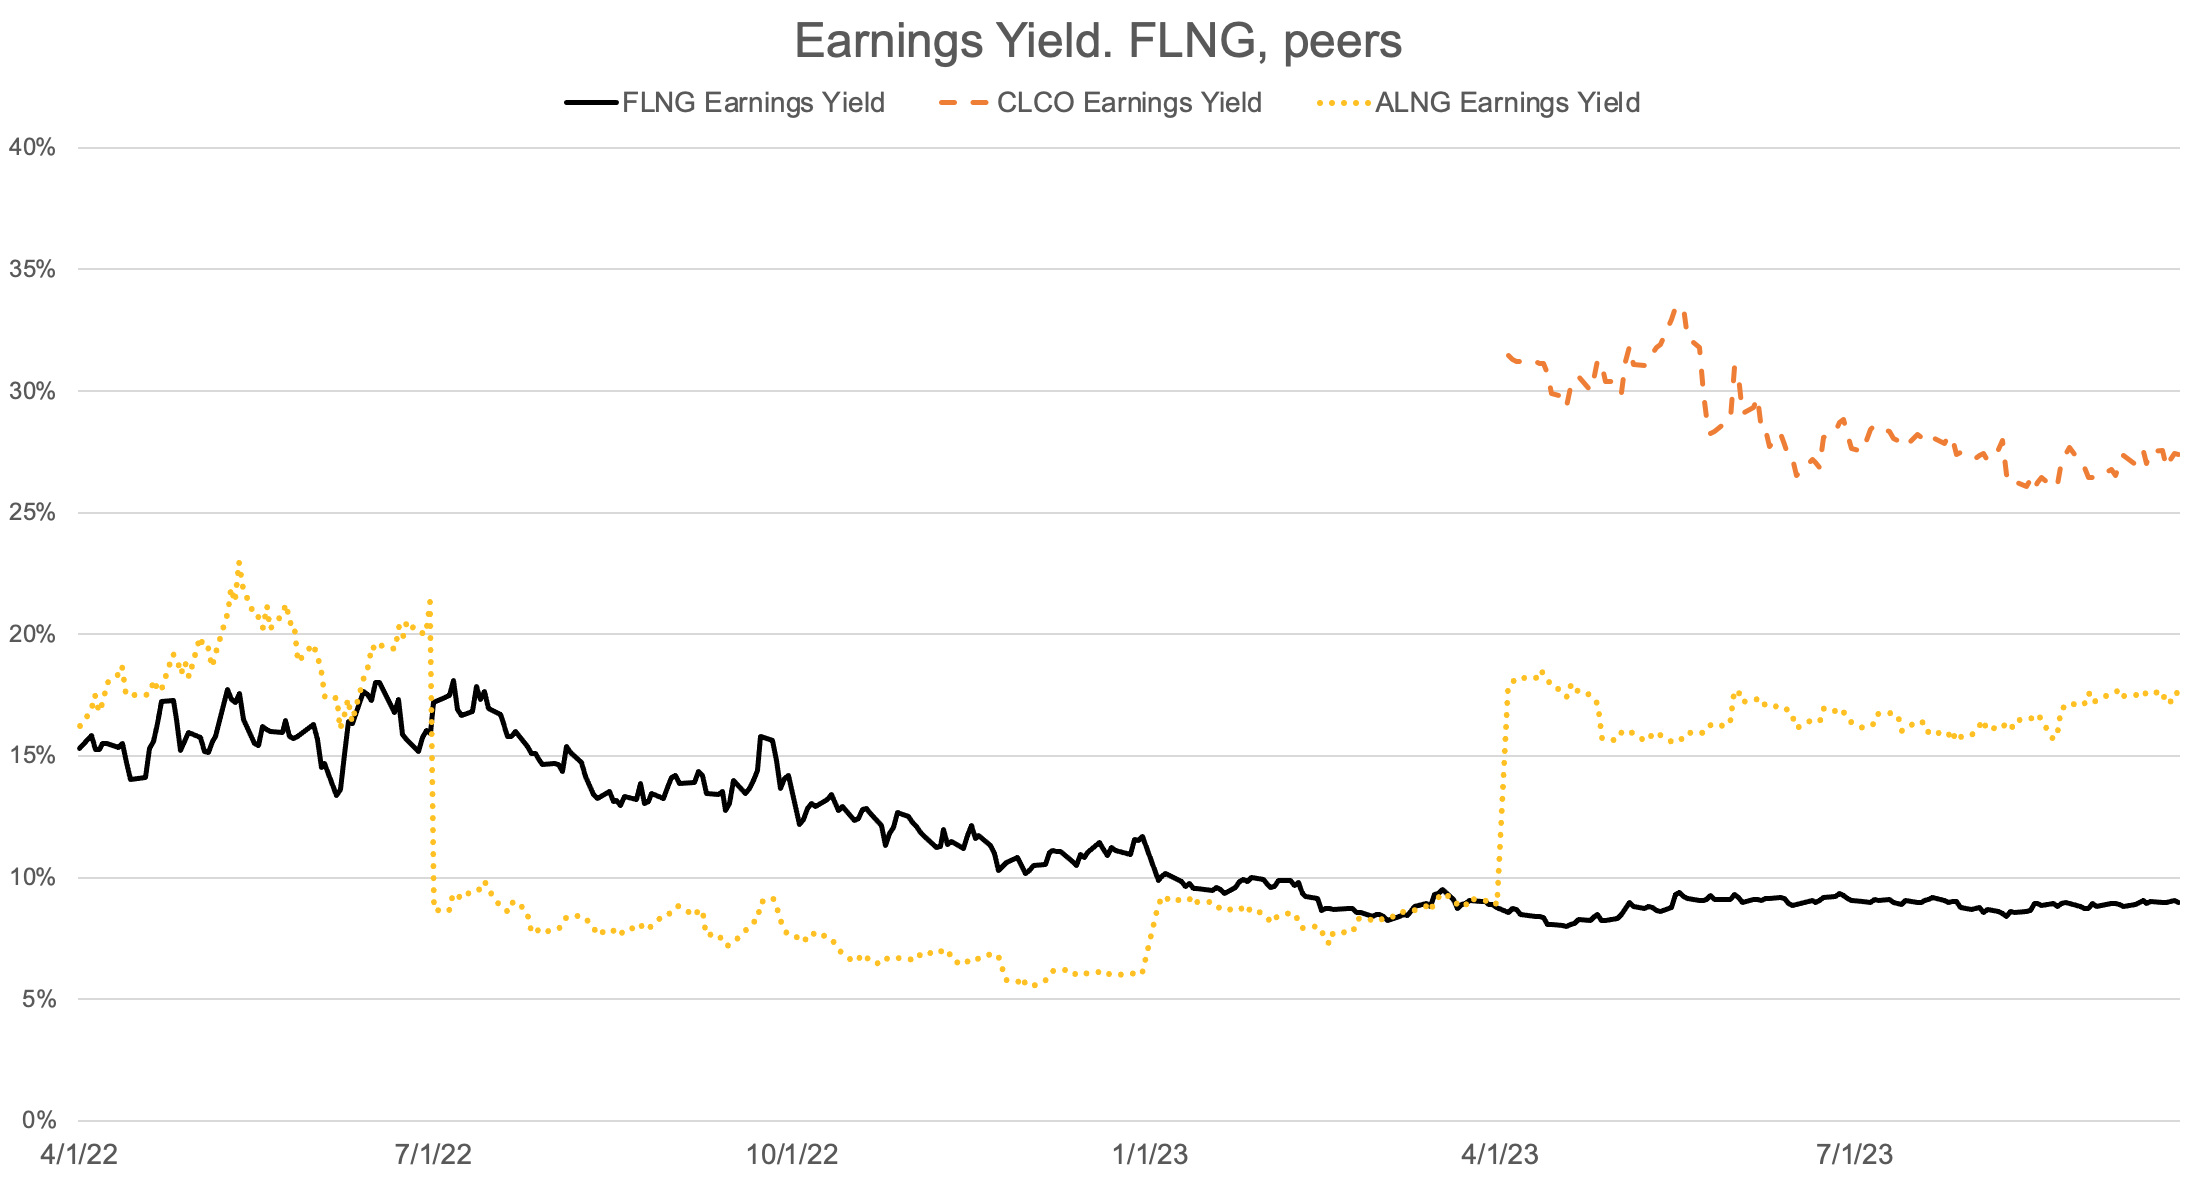
Considering earnings yield, we notice some differences. Cool Company has a much higher yield, probably reflecting the relative lack of share price appreciation we saw in the chart above.
Earnings Yield. FLNG, peers (Author's calculations)
Dividend Yield: Comparable
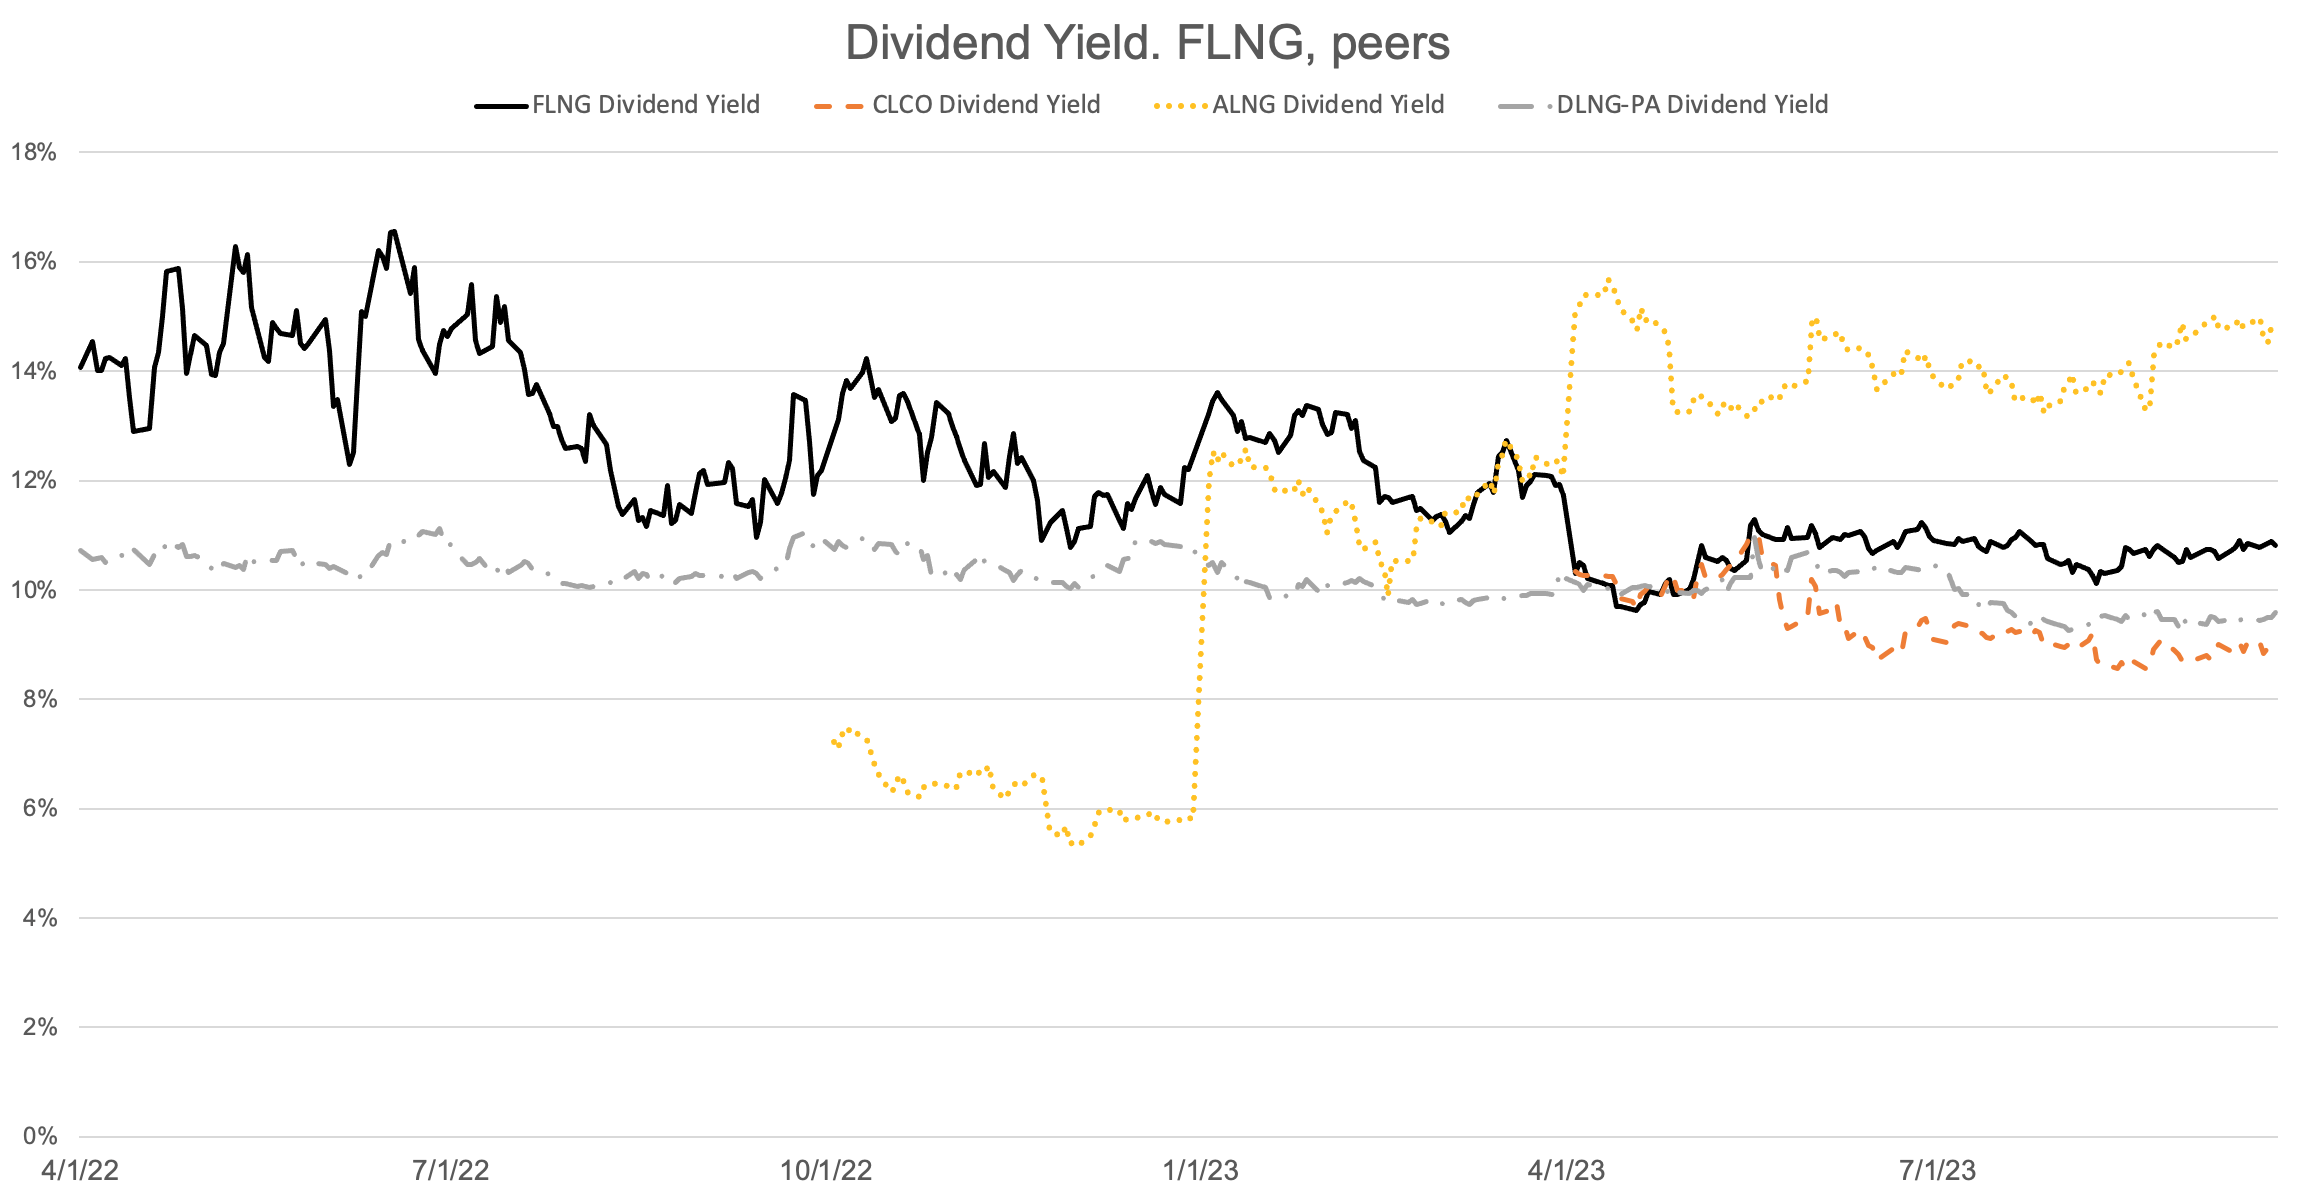
Calculating dividend yield (trailing twelve months) and displaying it in a graph results in the following picture:
Dividend Yield. FLNG, peers (Author's calculations)
Apart from Awilco LNG, all companies have been converging on about a 10 percent yield. Long charters. Notice that FLNG earnings yield and dividend yield are approximately equal (i.e., FLNG pursues a strategy where its earnings are paid out to shareholders). This will be investigated further in the section below regarding the payout ratio.
In the case of Awilco LNG, one should wait to be tempted by its recent 14% dividend yield. It did not pay dividends until late 2022 when its variable dividend policy was instituted. Its size (it has just two LNGCs in its fleet) is its challenge. In its Q2 report , ALNG noted (p. 3),
One engine overhaul and the second special survey and drydock of both vessels will be performed in [the] third quarter [of] 2023
Its large pricing swings following quarterly report presentations may also reflect the low liquidity and coverage of the stock.
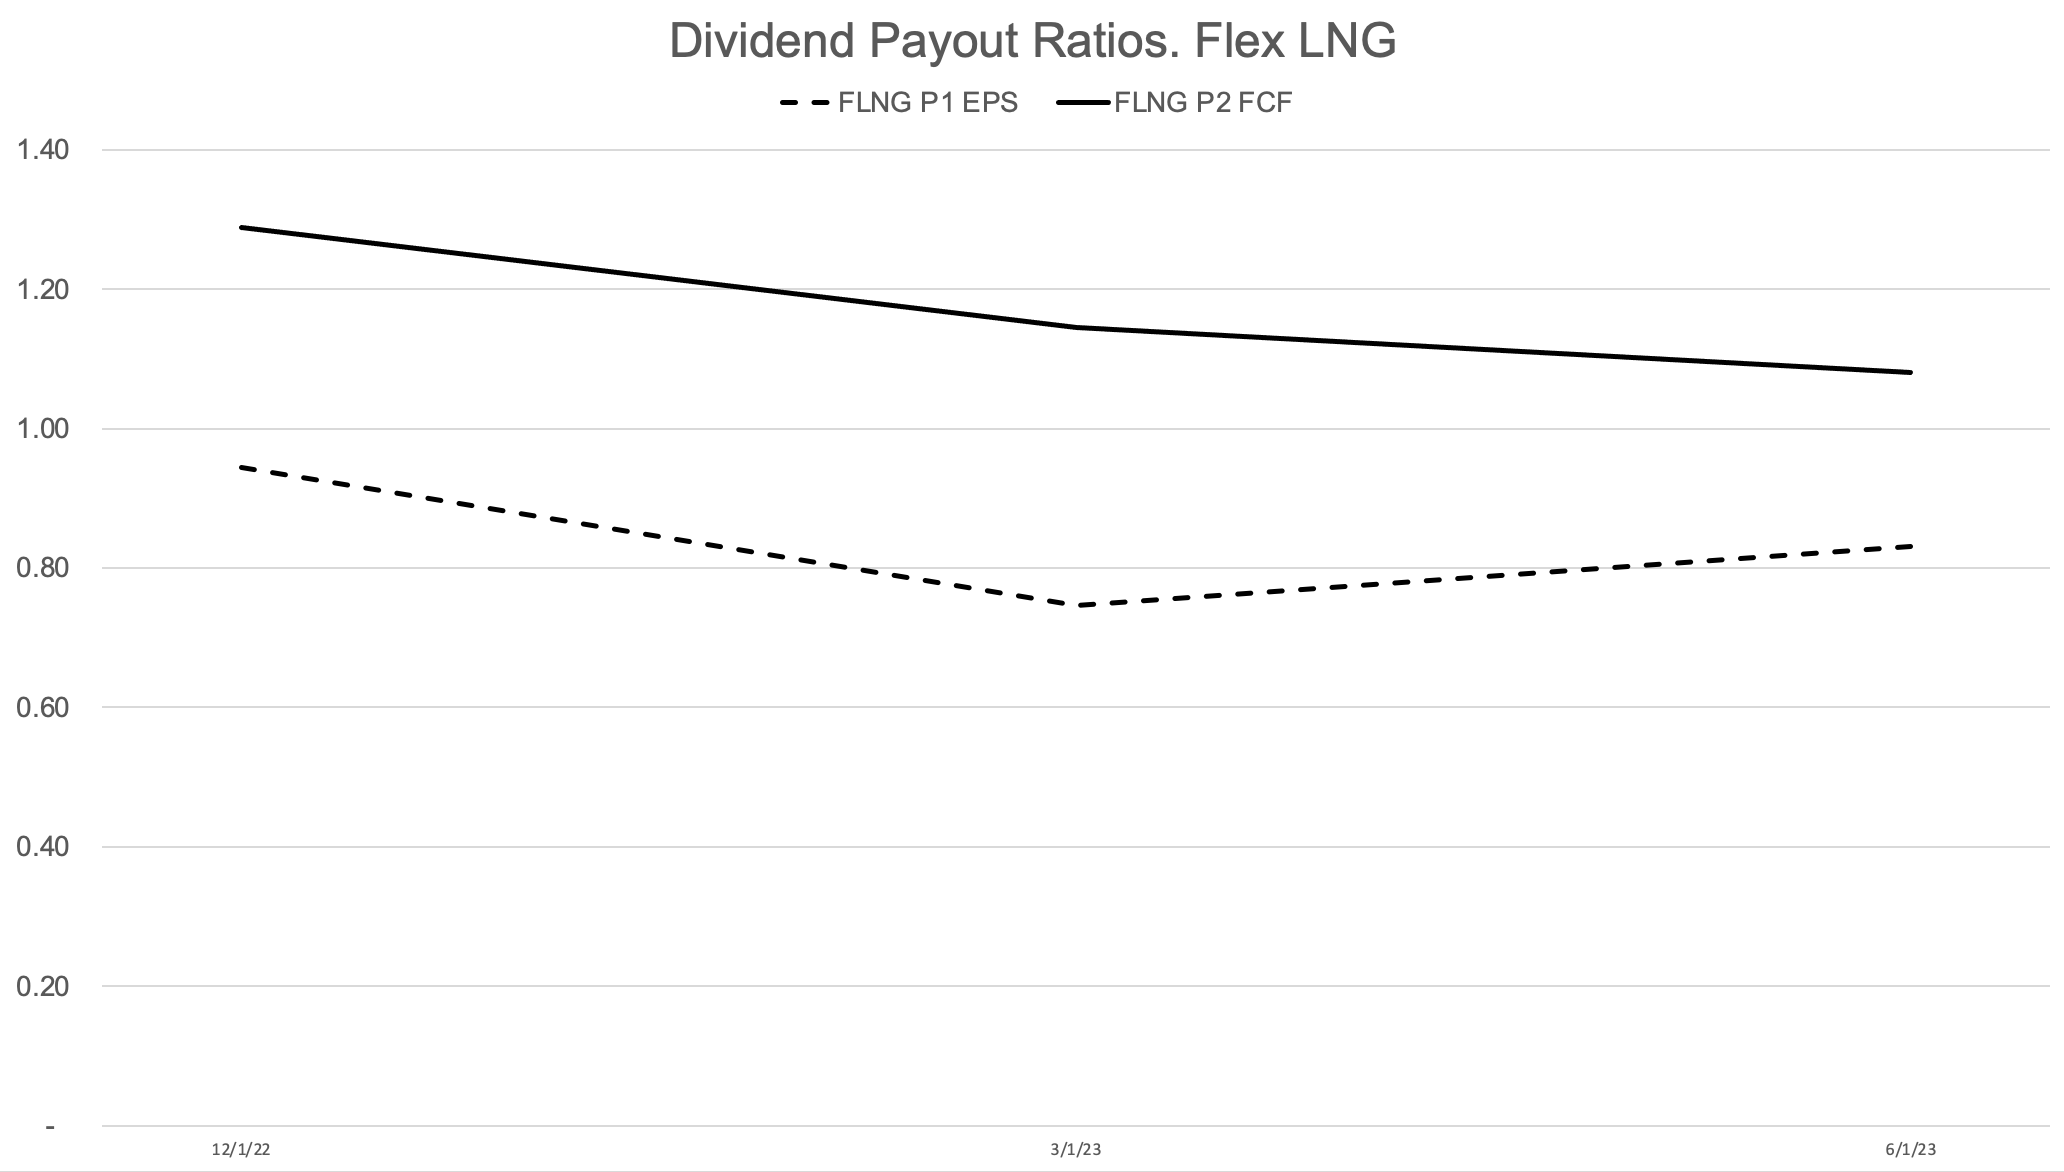
Flex's Dividend Payout Ratio - Two Perspectives
In this section, we will review two different payout ratios:
1. Earnings per share divided by dividend per share ("P1 EPS" below)
2. Dividends paid out divided by free cash flow ("P2 FCF" below)
Both ratios are calculated as trailing twelve months and shown in the graph below:
Dividend payout ratios. Flex LNG (Author's calculations)
Let's unpack this picture. As we saw earlier, Flex LNG's dividend yield is equal to - or even higher - than its earnings yield. In other words, its dividends exceed earnings. How is that possible? The answer lies in its cash flows. It generates free cash flows exceeding its dividend payouts, thereby supporting continued dividends.
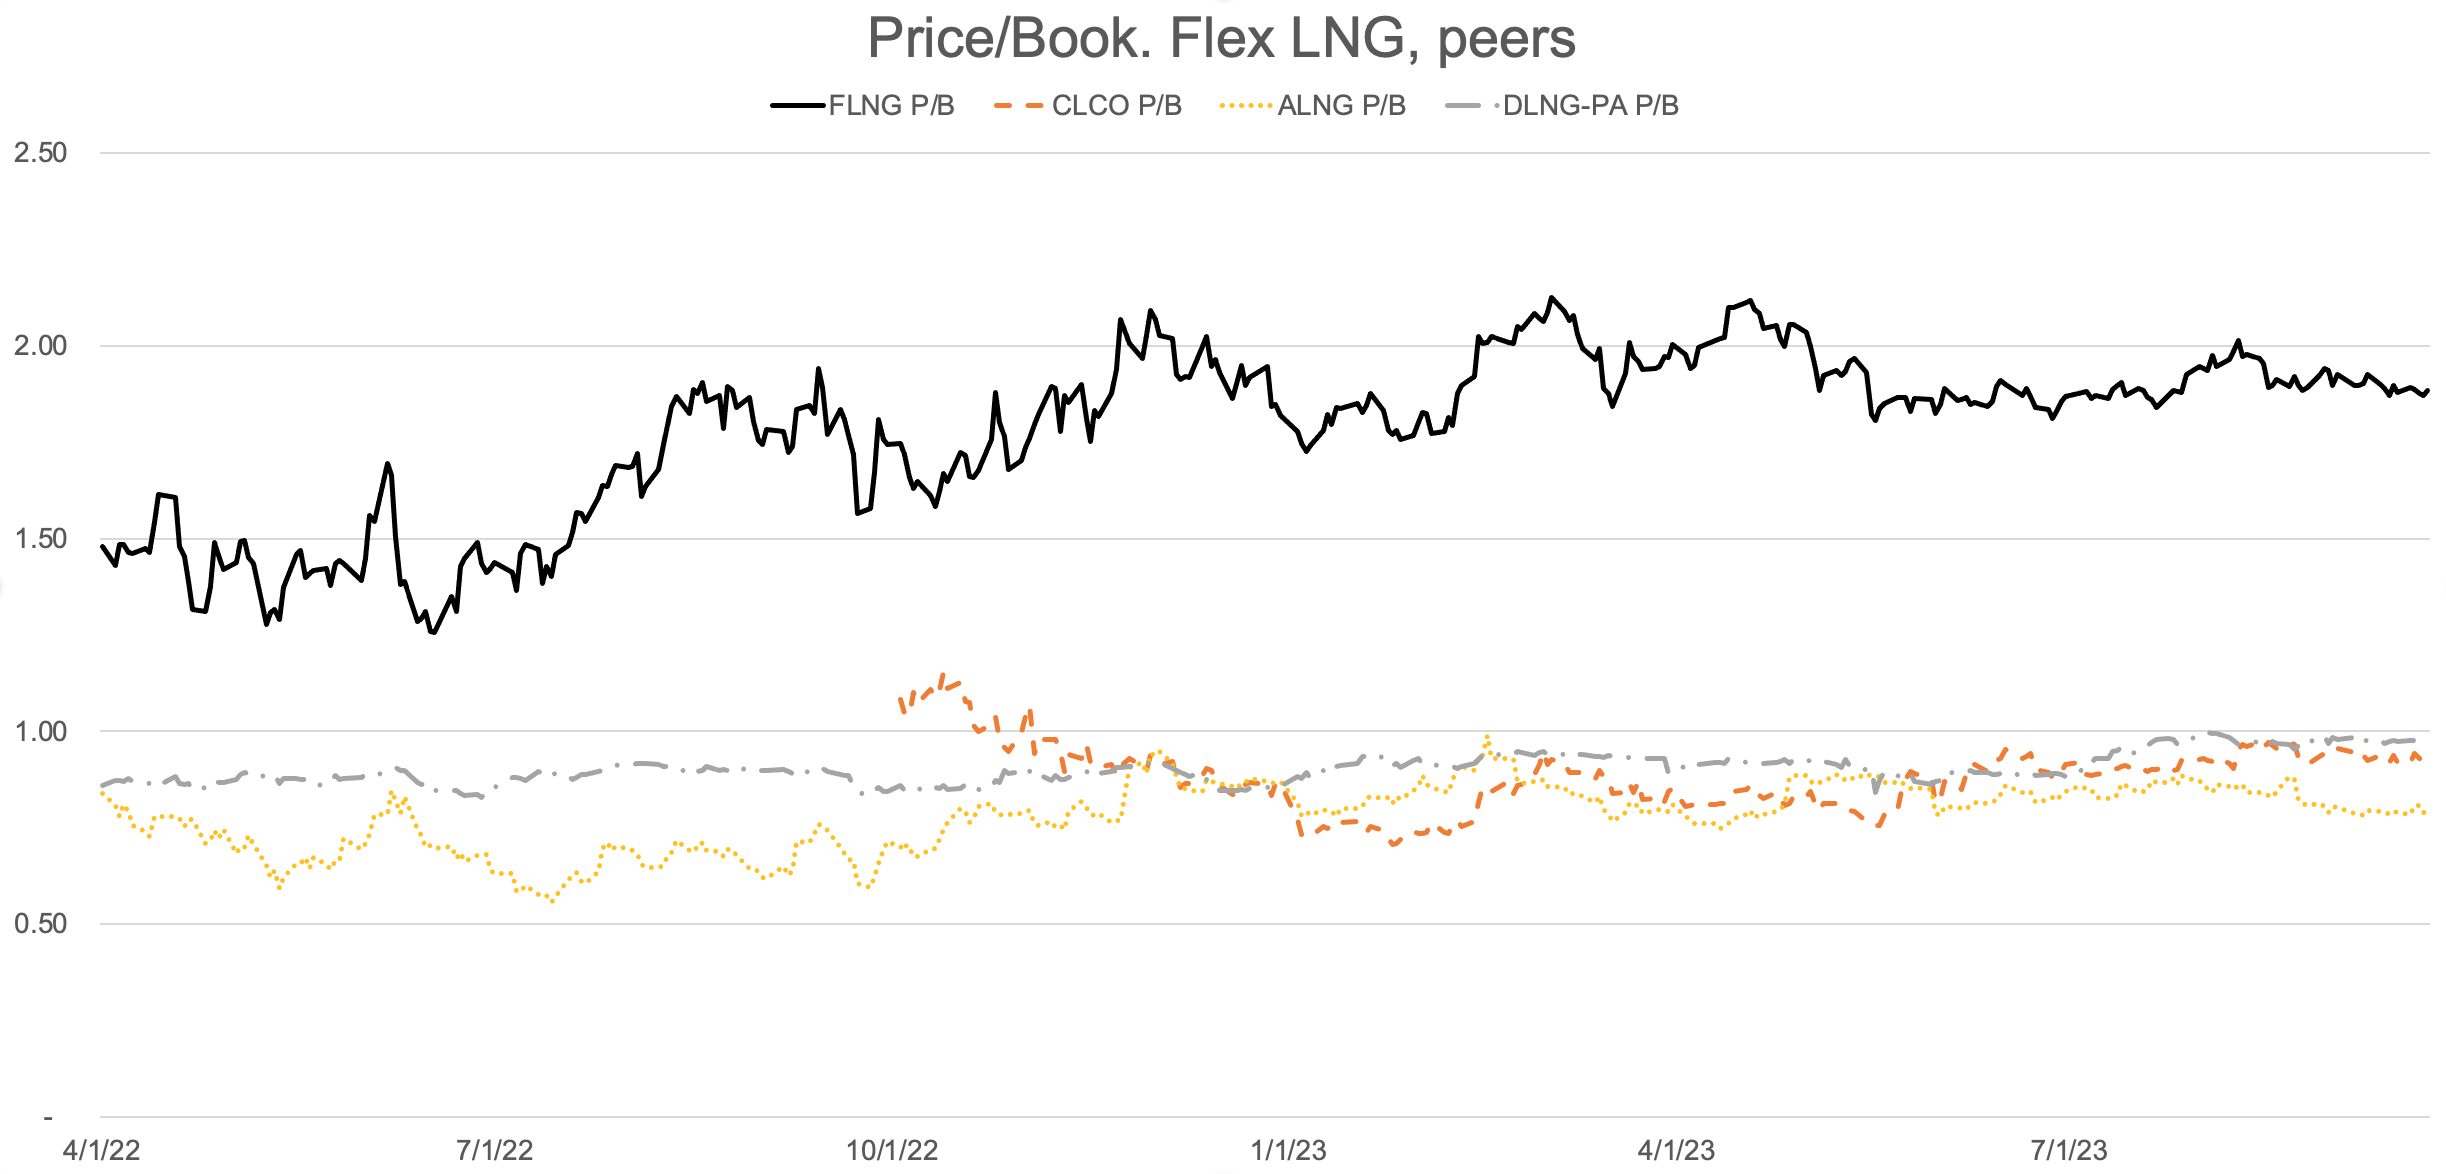
Price/Book: Expensive - But Its Ships Are Too
While its peers' book equity is priced equally by the market, Flex LNG's book equity is priced at nearly double:
Price/Book. Flex LNG, peers (Author's calculations)
Since Flex took delivery of its ships, prices of new MEGI-propelled ships have risen from about $200 million to about $260 million. Fleet composition could be another driver for this difference. Flex LNG's all-modern (MEGI and XDF propulsion) fleet is significantly newer than its peers' fleets:
- CLCO: Nine 2014-2015-built TFDE ships, two 2020-2021-built XDF. Nine ships in total
- DLNG: Three 2007-2008-built steamships and three 2013-built TFDE ships
- ALNG: Two 2013-built TFDE ships
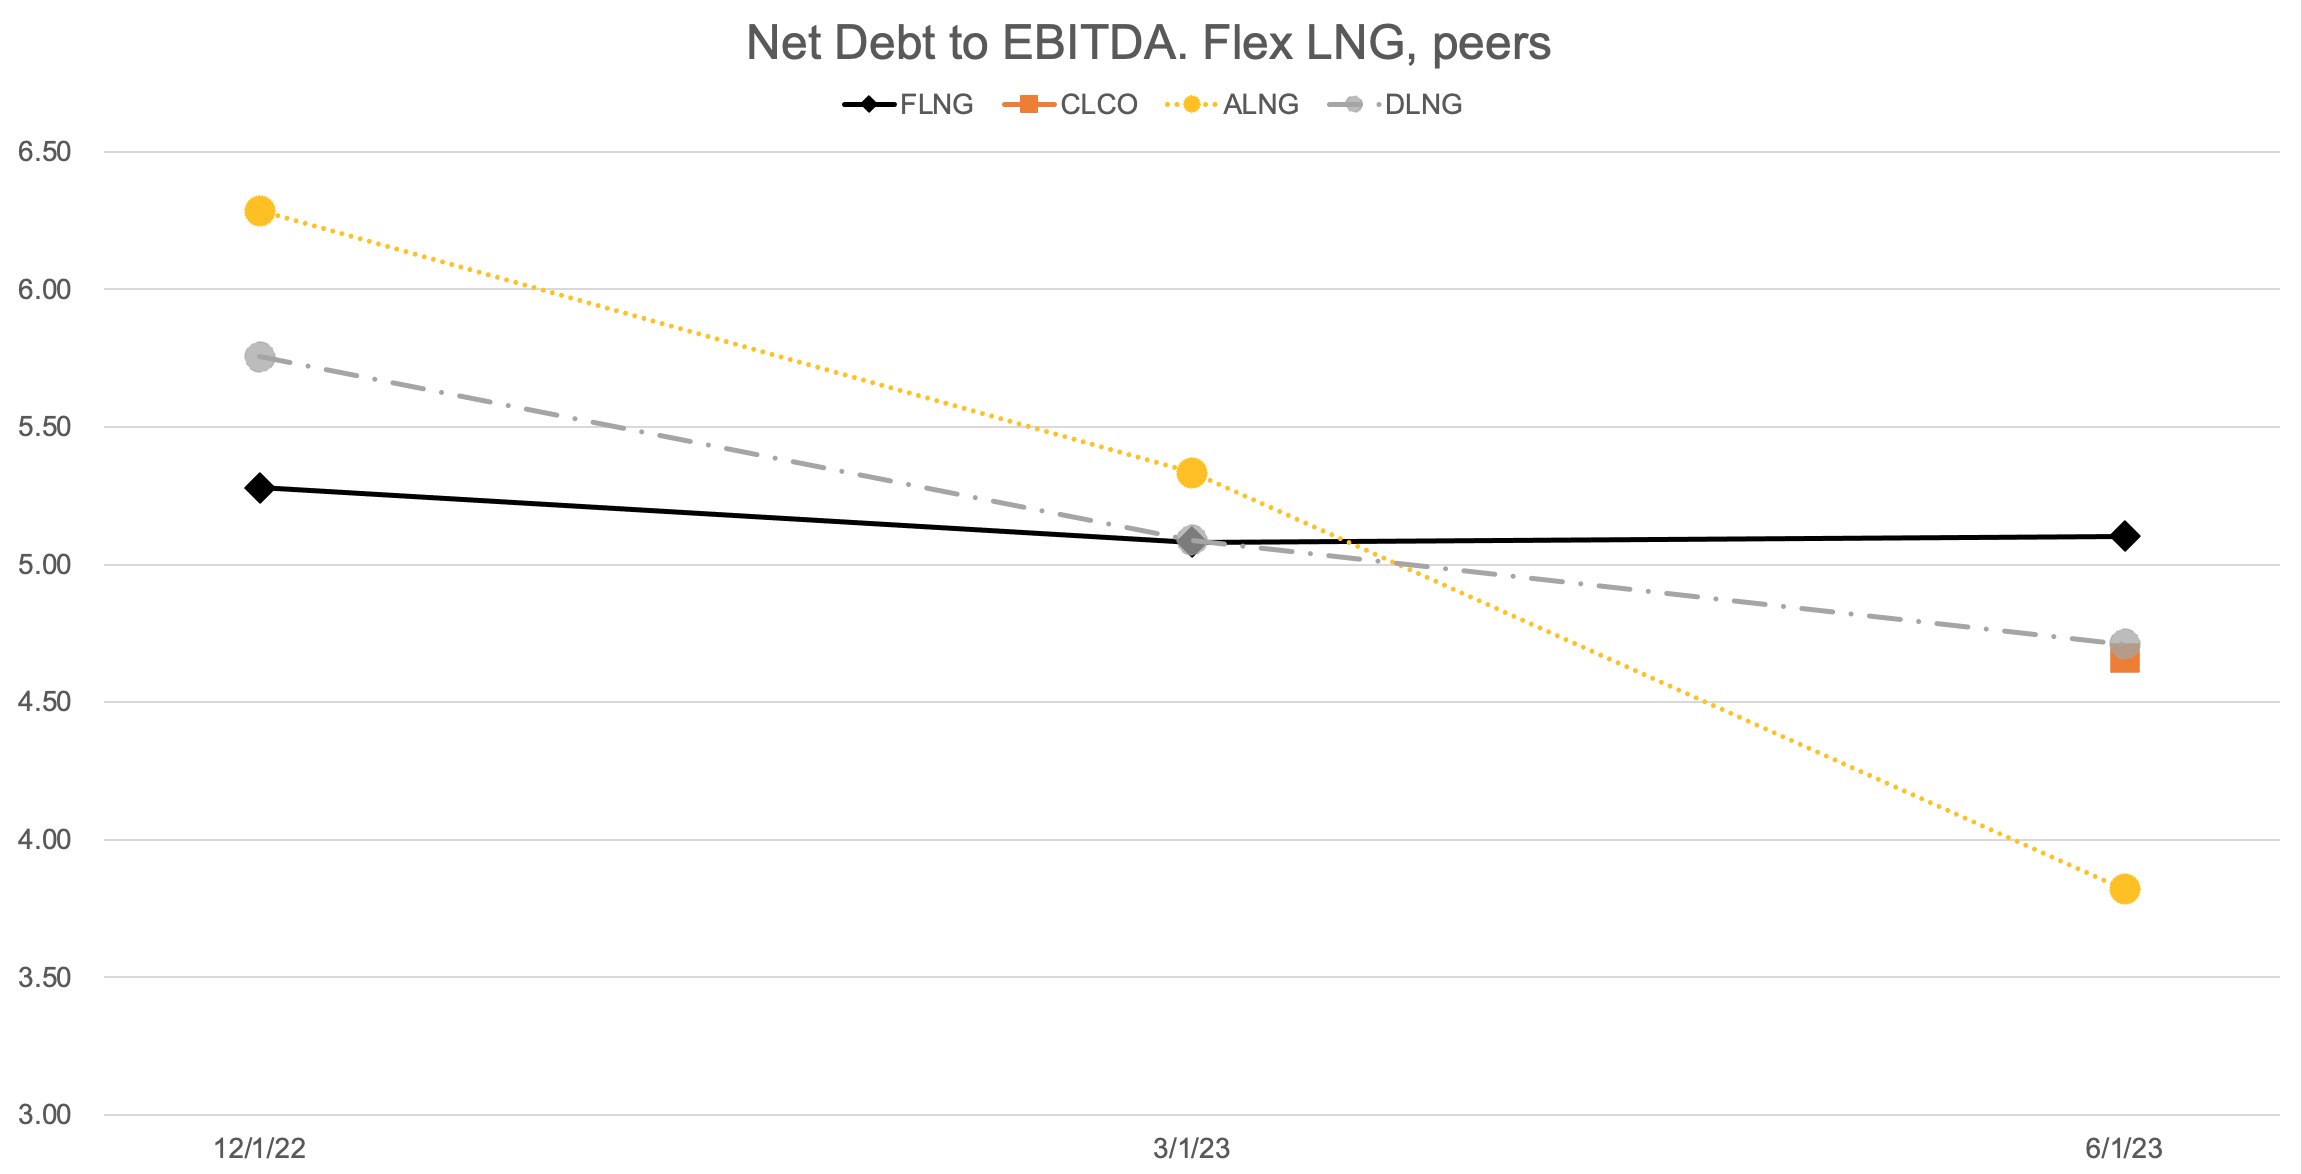
Net Debt / EBITDA
Flex LNG's peers have deleveraged during the last two quarters, showing a declining ratio. However, that can't be said for sure for CLCO, as it has only one data point:
Net Debt to EBITDA. Flex LNG, peers (Author's calculations)
In any case, Flex LNG has the highest ratio - just barely - of its peers as of the end of the second quarter. As all companies have similar ratios over time, I am not attaching much weight to that.
Furthermore, Flex LNG has no debt maturities until 2028.
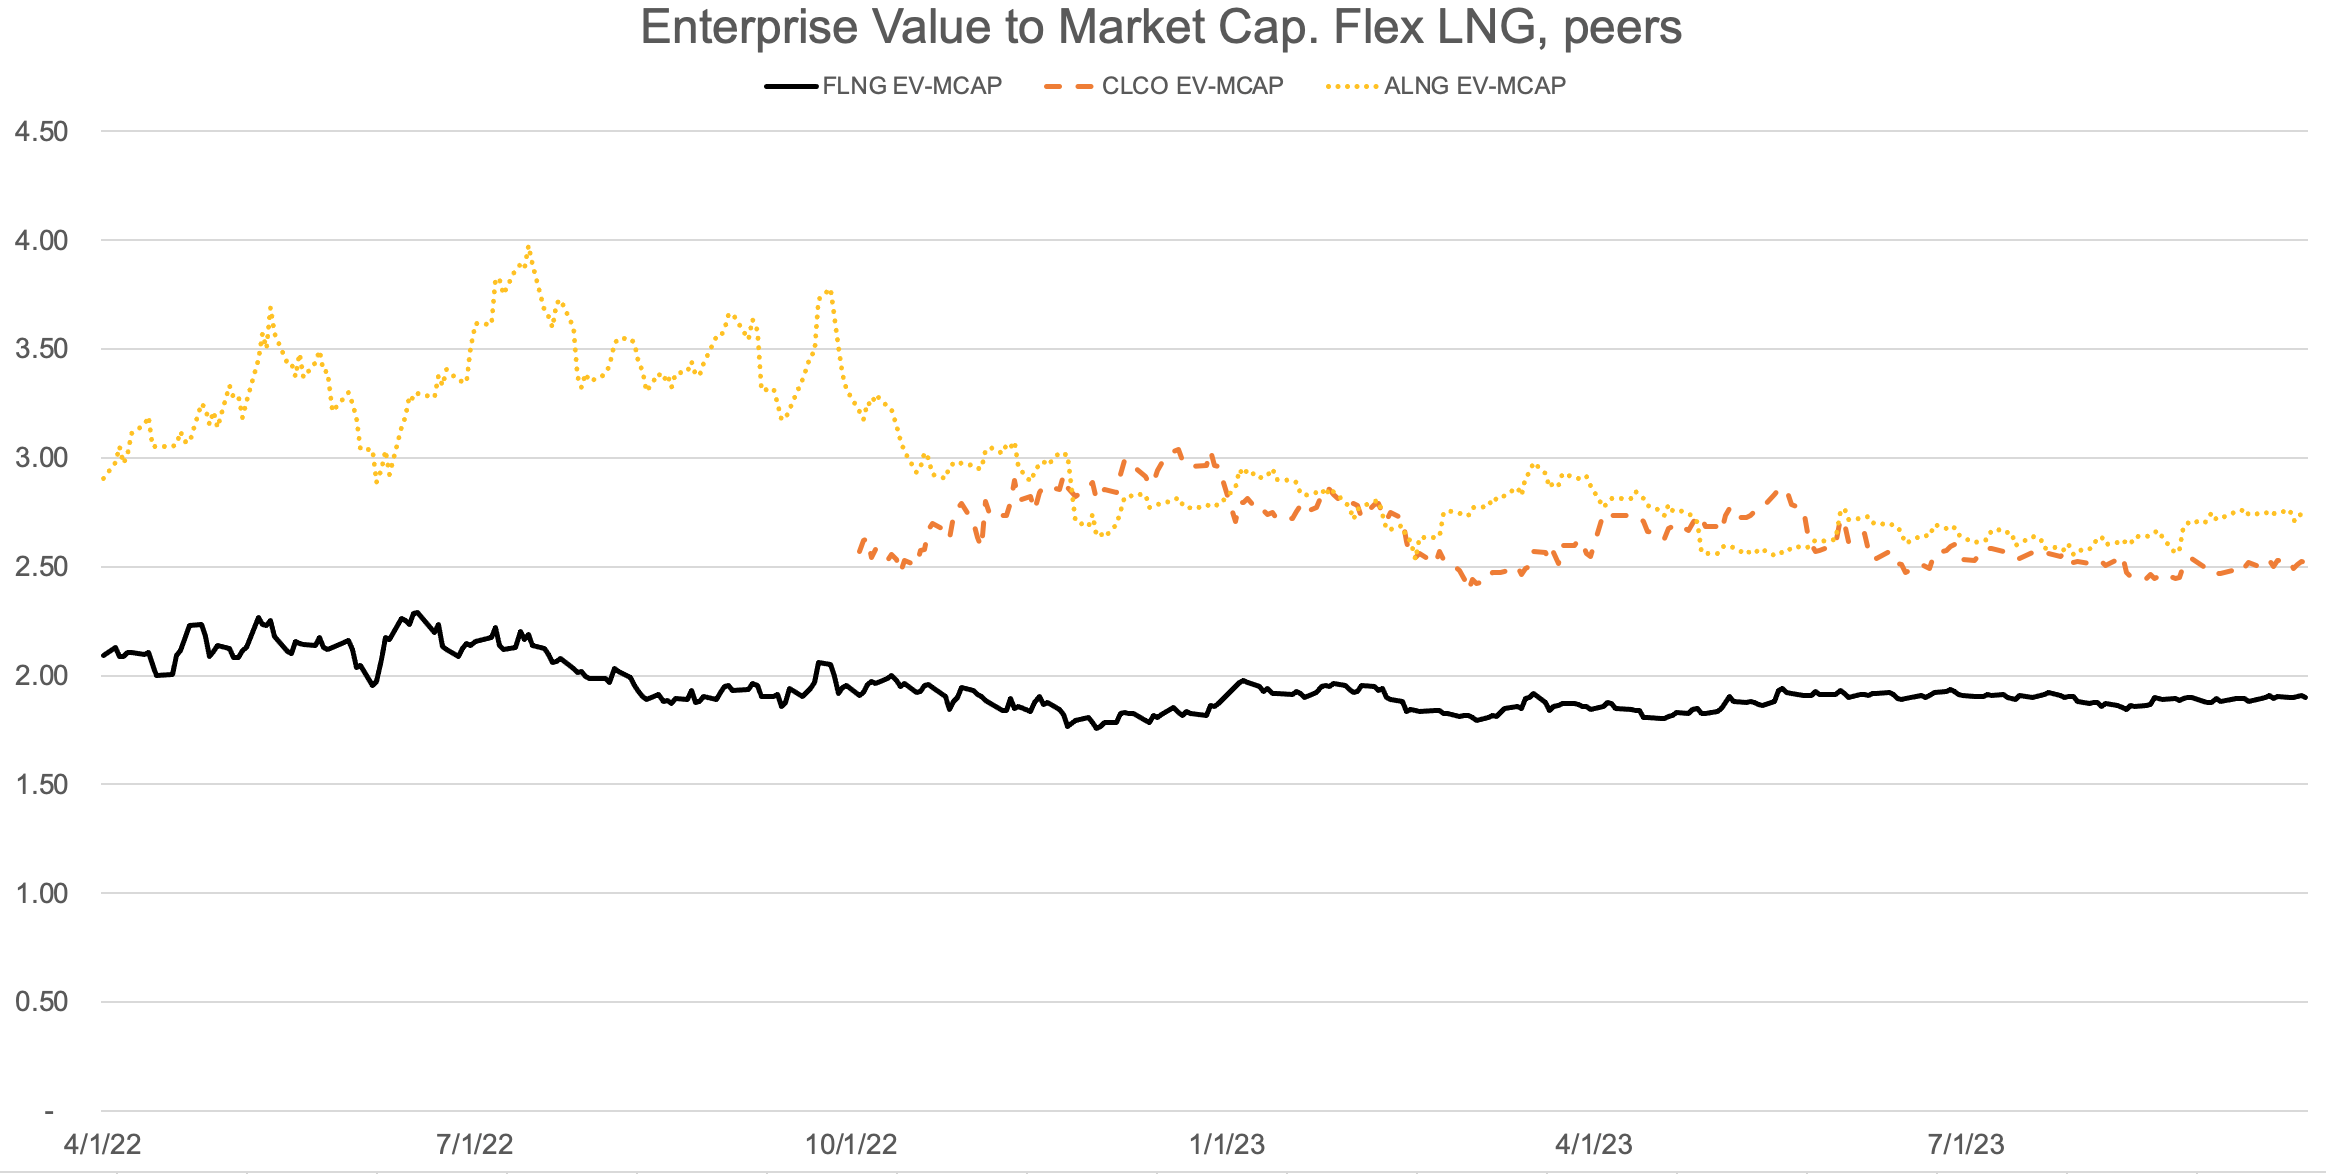
Enterprise Value to Market Cap
I wanted to compare EV to Market Capitalization to see how varying leverage levels affect each company's valuation. As the graph below shows, Flex LNG has a ratio of about 2. In other words, its 31 percent book equity is about a 50 percent market equity value to its enterprise value. Again, this reflects on the high value the market assigns to its fleet.
Enterprise Value to Market Cap. Flex LNG, peers (Author's calculations)
Contract Backlog
Flex LNG emphasizes its 54 years of firm backlog . It even emphasizes that it has no spot exposure by putting on a "not applicable" stamp on the Open/Spot legend item:
Flex LNG contract backlog (Presentation given at 30th Annual Pareto Energy Conference)
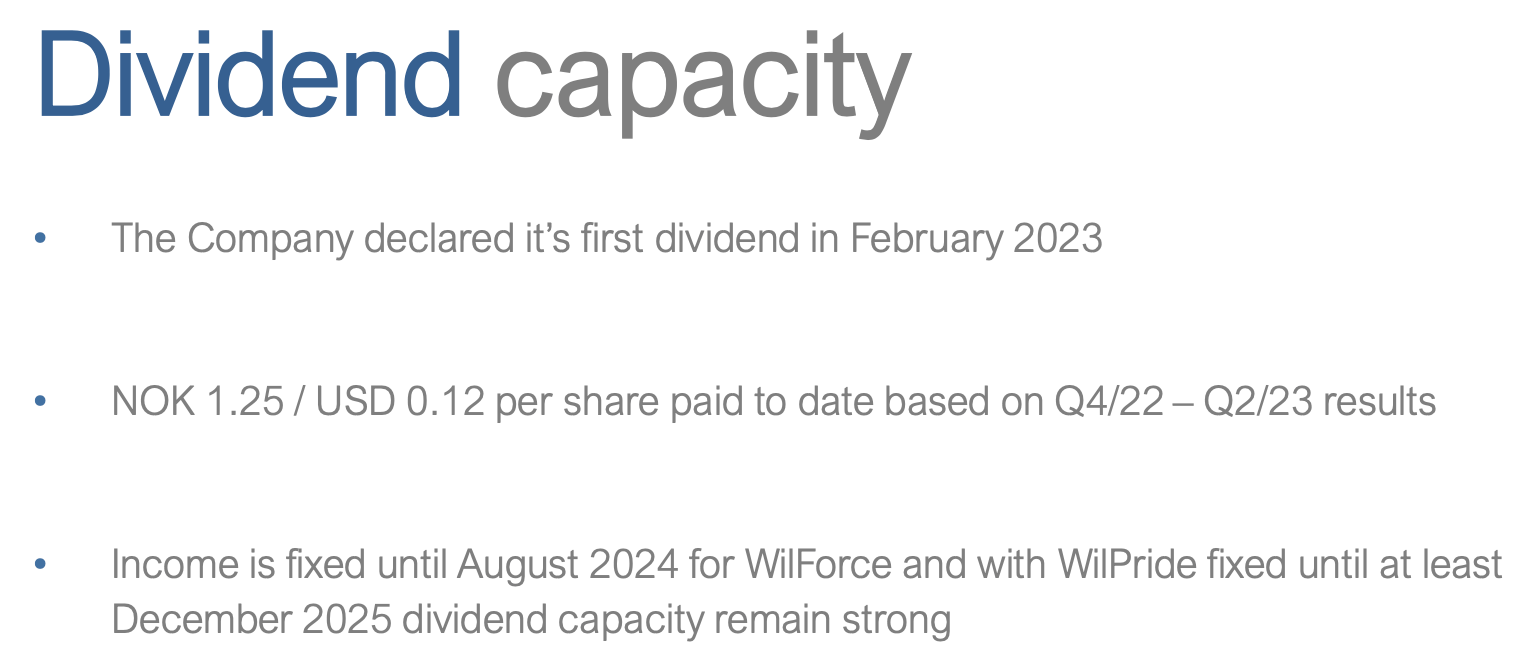
Awilco LNG was present at the same conference and communicated the following regarding its backlog. It has about a year of fixed hire on its WilForce vessel and a little more than two years of fixed hire on its WilPride vessel:
Awilco LNG contract backlog (Presentation given at 30th Annual Pareto Energy Conference)
Cool Company was also at the conference but did not specify its contracted backlog. Instead, it provided this slide in its 1H 2023 results presentation from a few weeks back:
Cool Company contracted backlog (1H 2023 results presentation)
Through 2024, it has about 11 % exposure to the spot market.
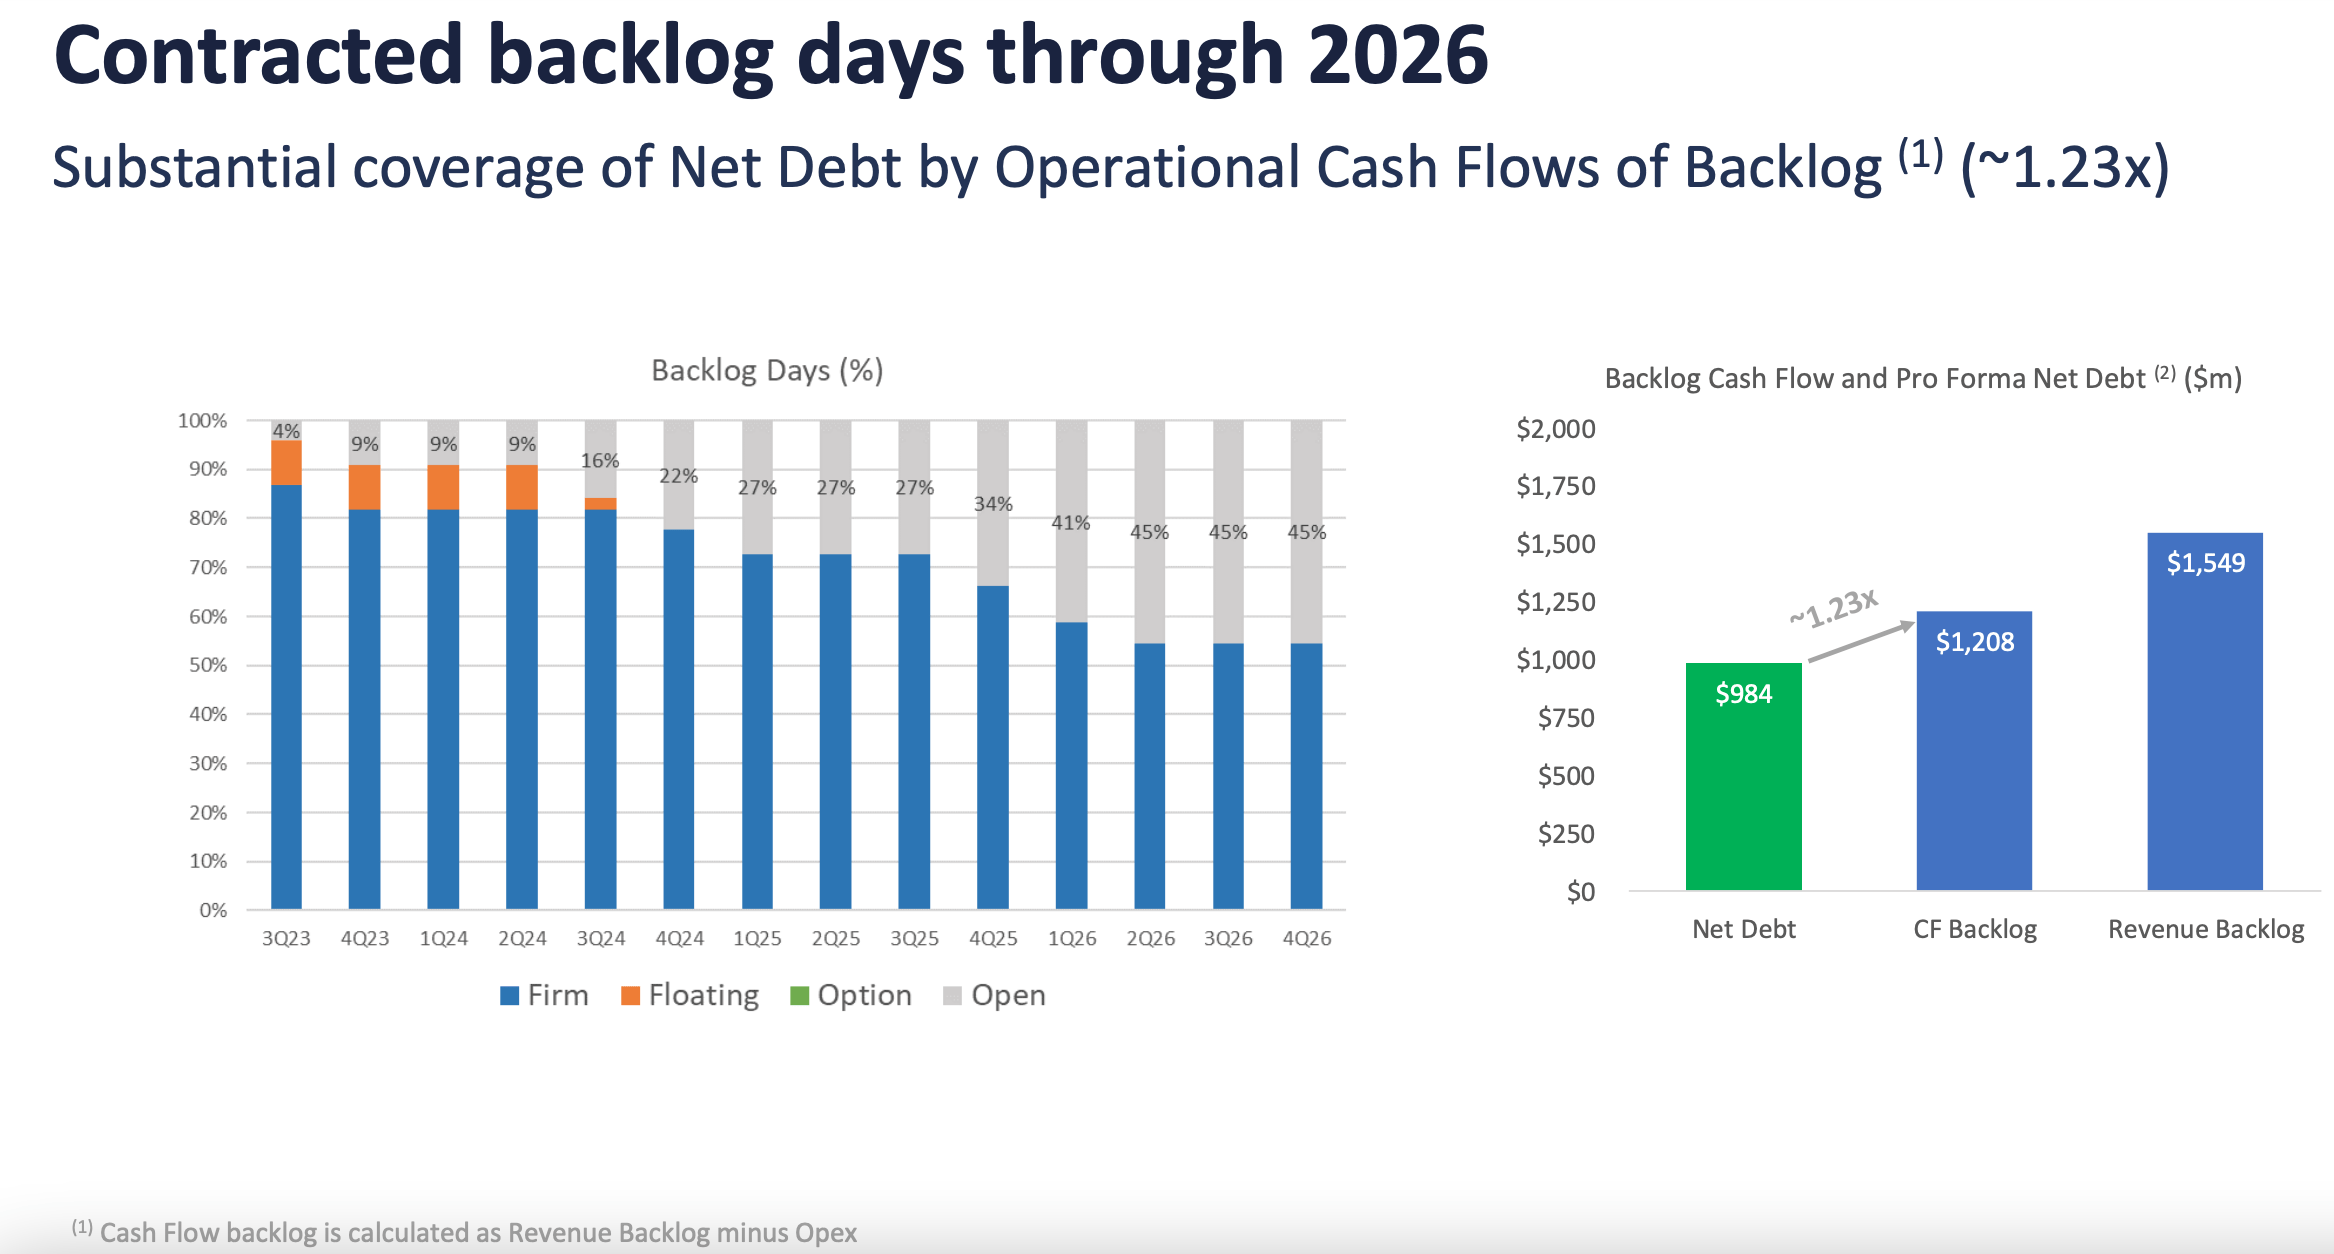
Finally, Dynagas LNG Partners:
Dynagas LNG Partners contracted backlog (Q2 2023 results presentation)
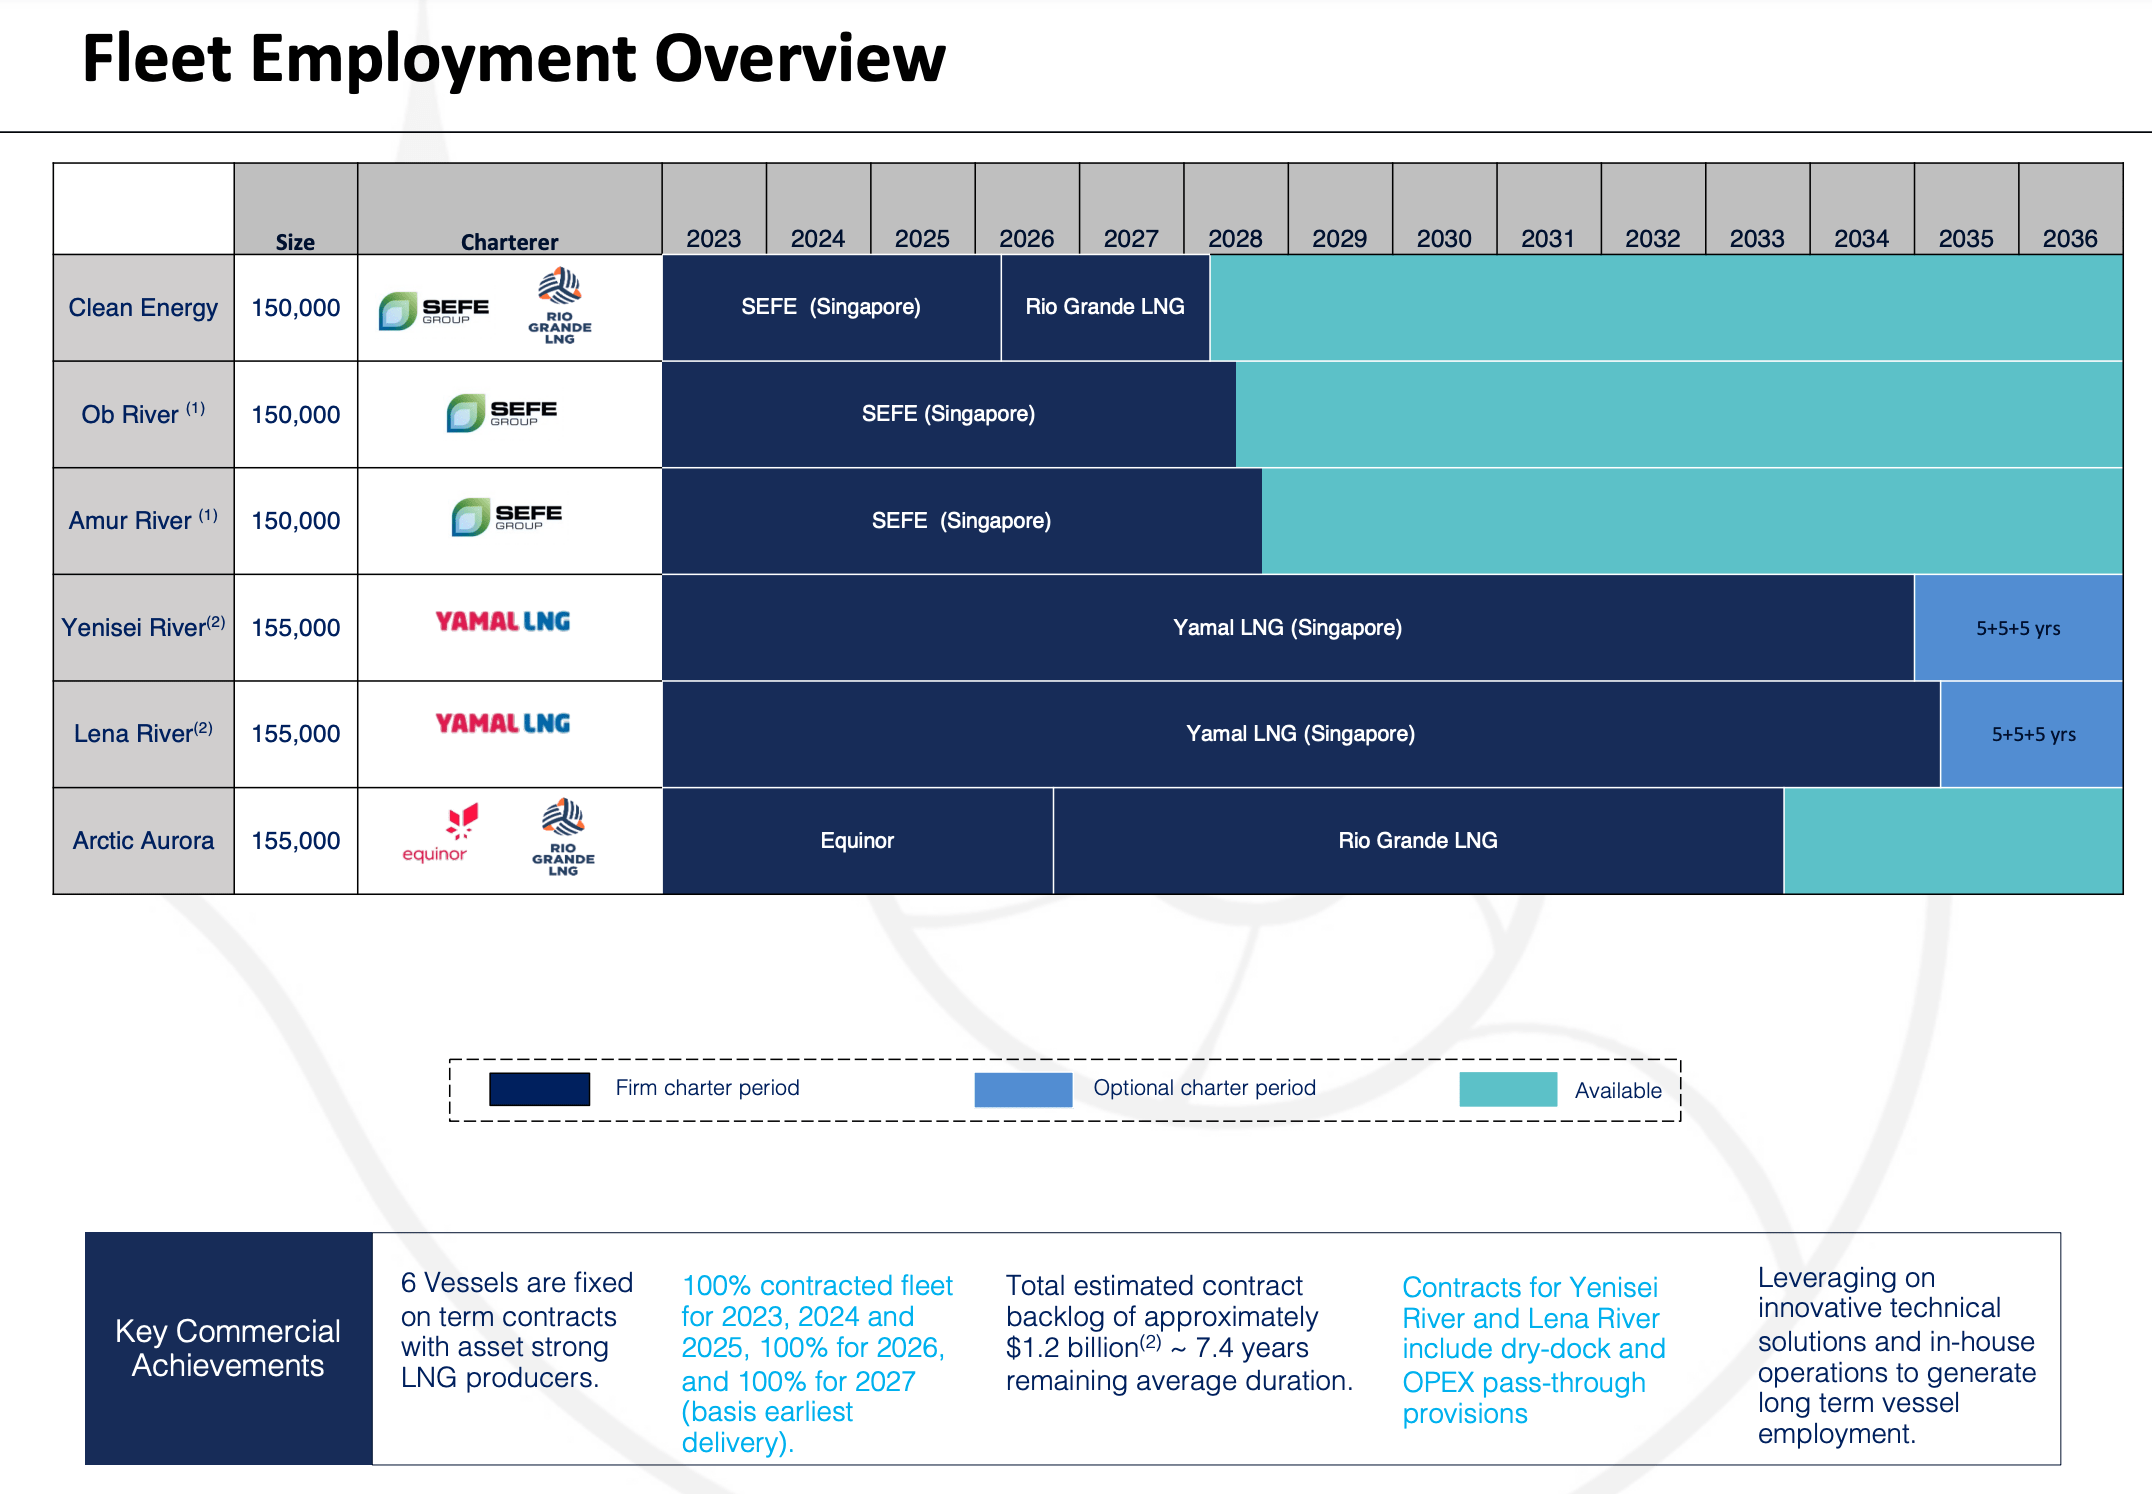
Its fleet has 100% contract coverage through 2027, and its average remaining charter duration is 7.4 years.
LNG Market Outlook
In its latest earnings report (p. 11) , Flex LNG reported that higher interest rates, high new-build prices, and declining contracting of new ships support continued high freight rates.
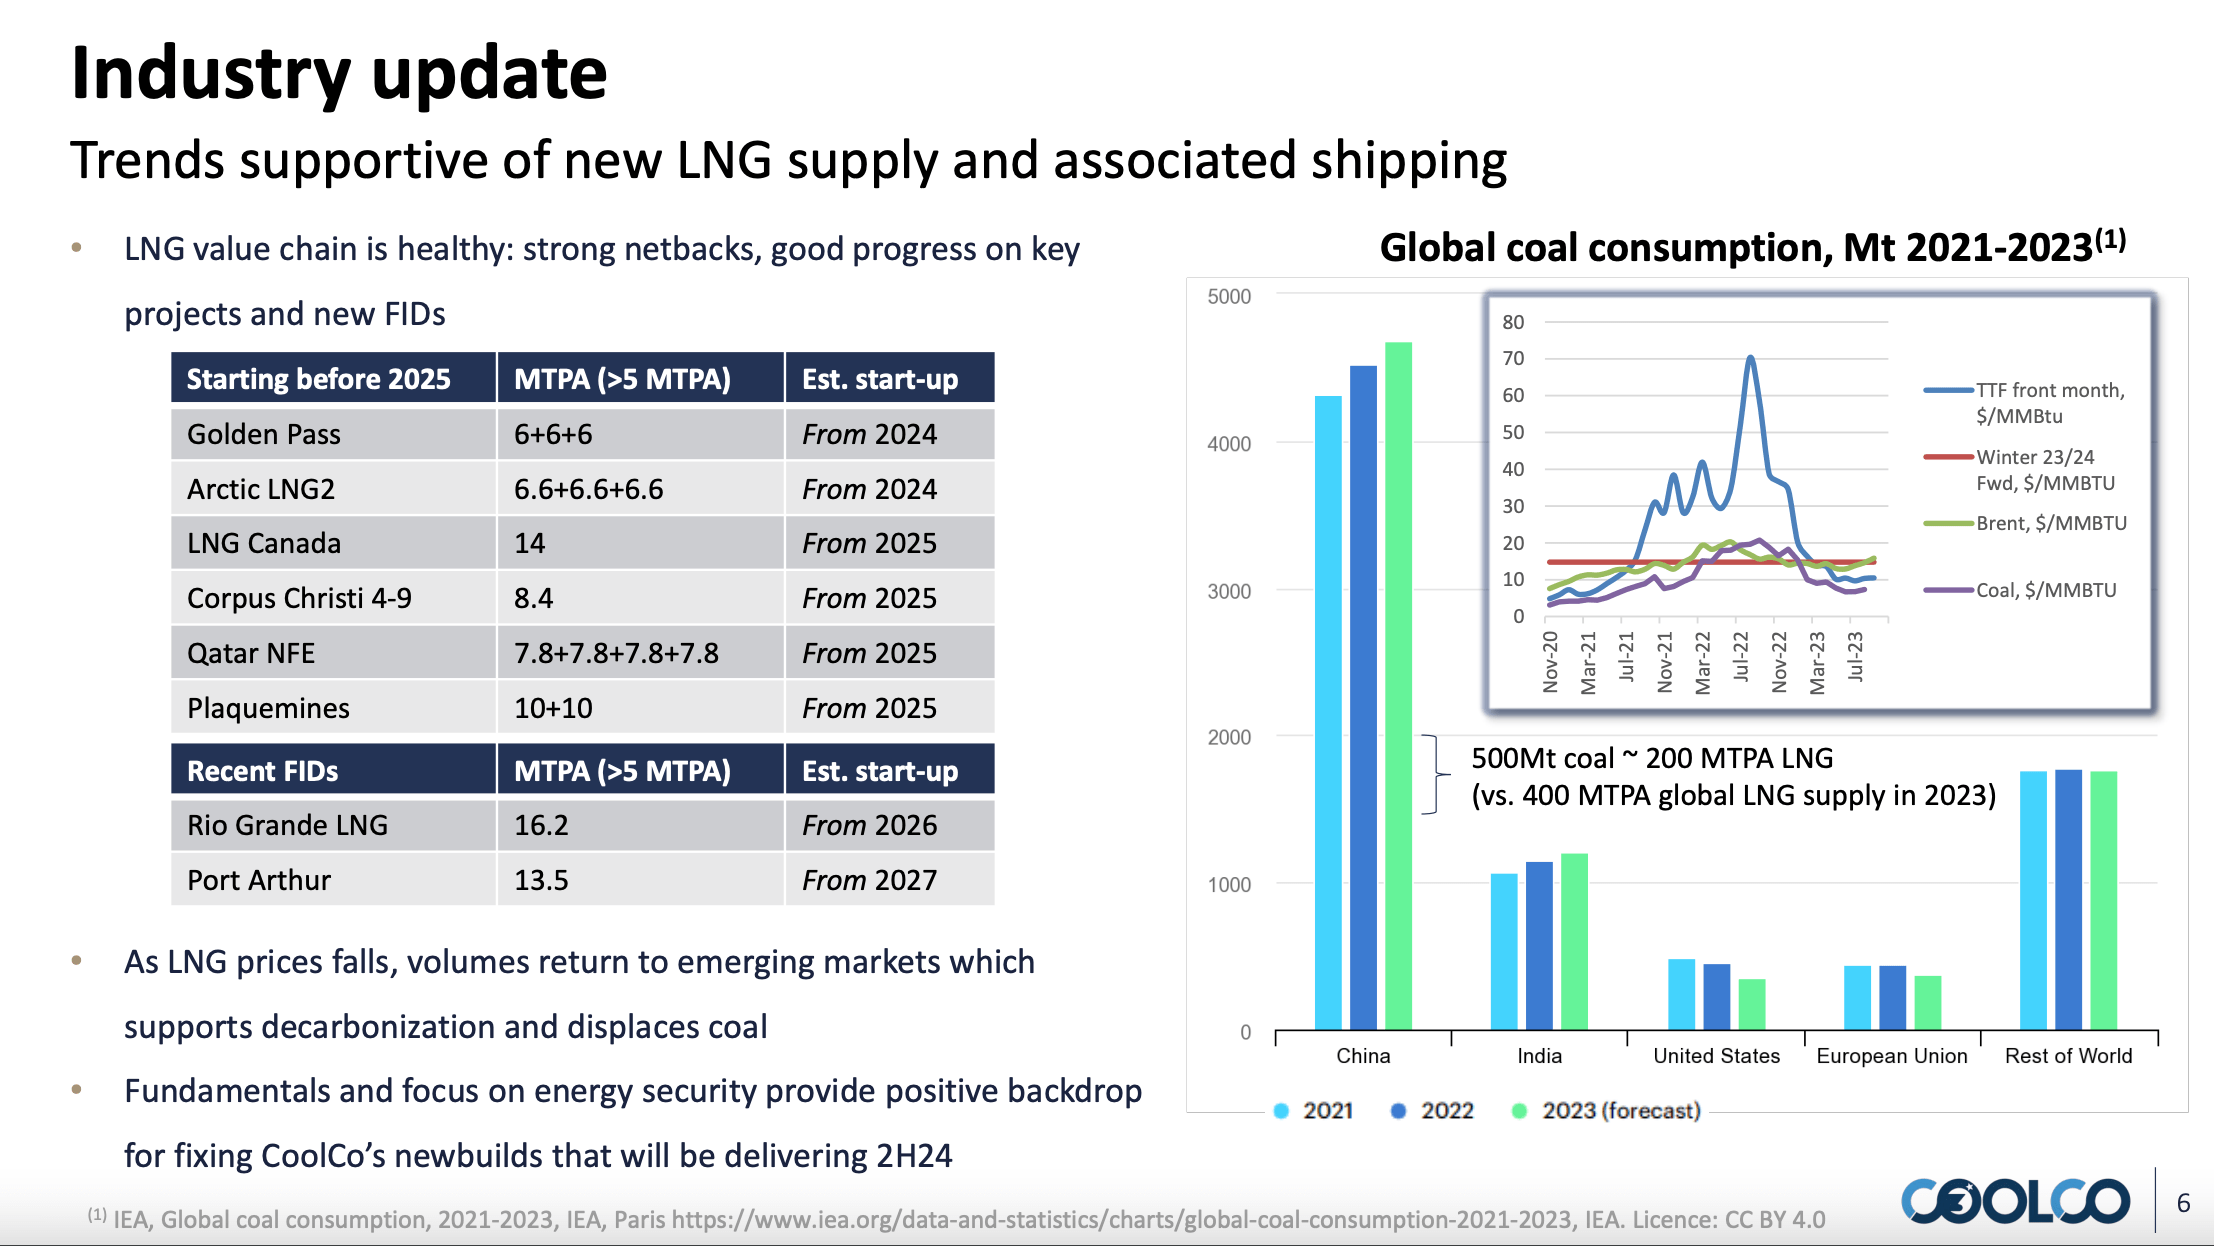
In the Pareto Conference presentation mentioned earlier, Cool Company provided a bullish outlook for the coming years, citing the large amount of LNG required to displace coal:
LNG market outlook (Cool Company at 30th Annual Pareto Conference)
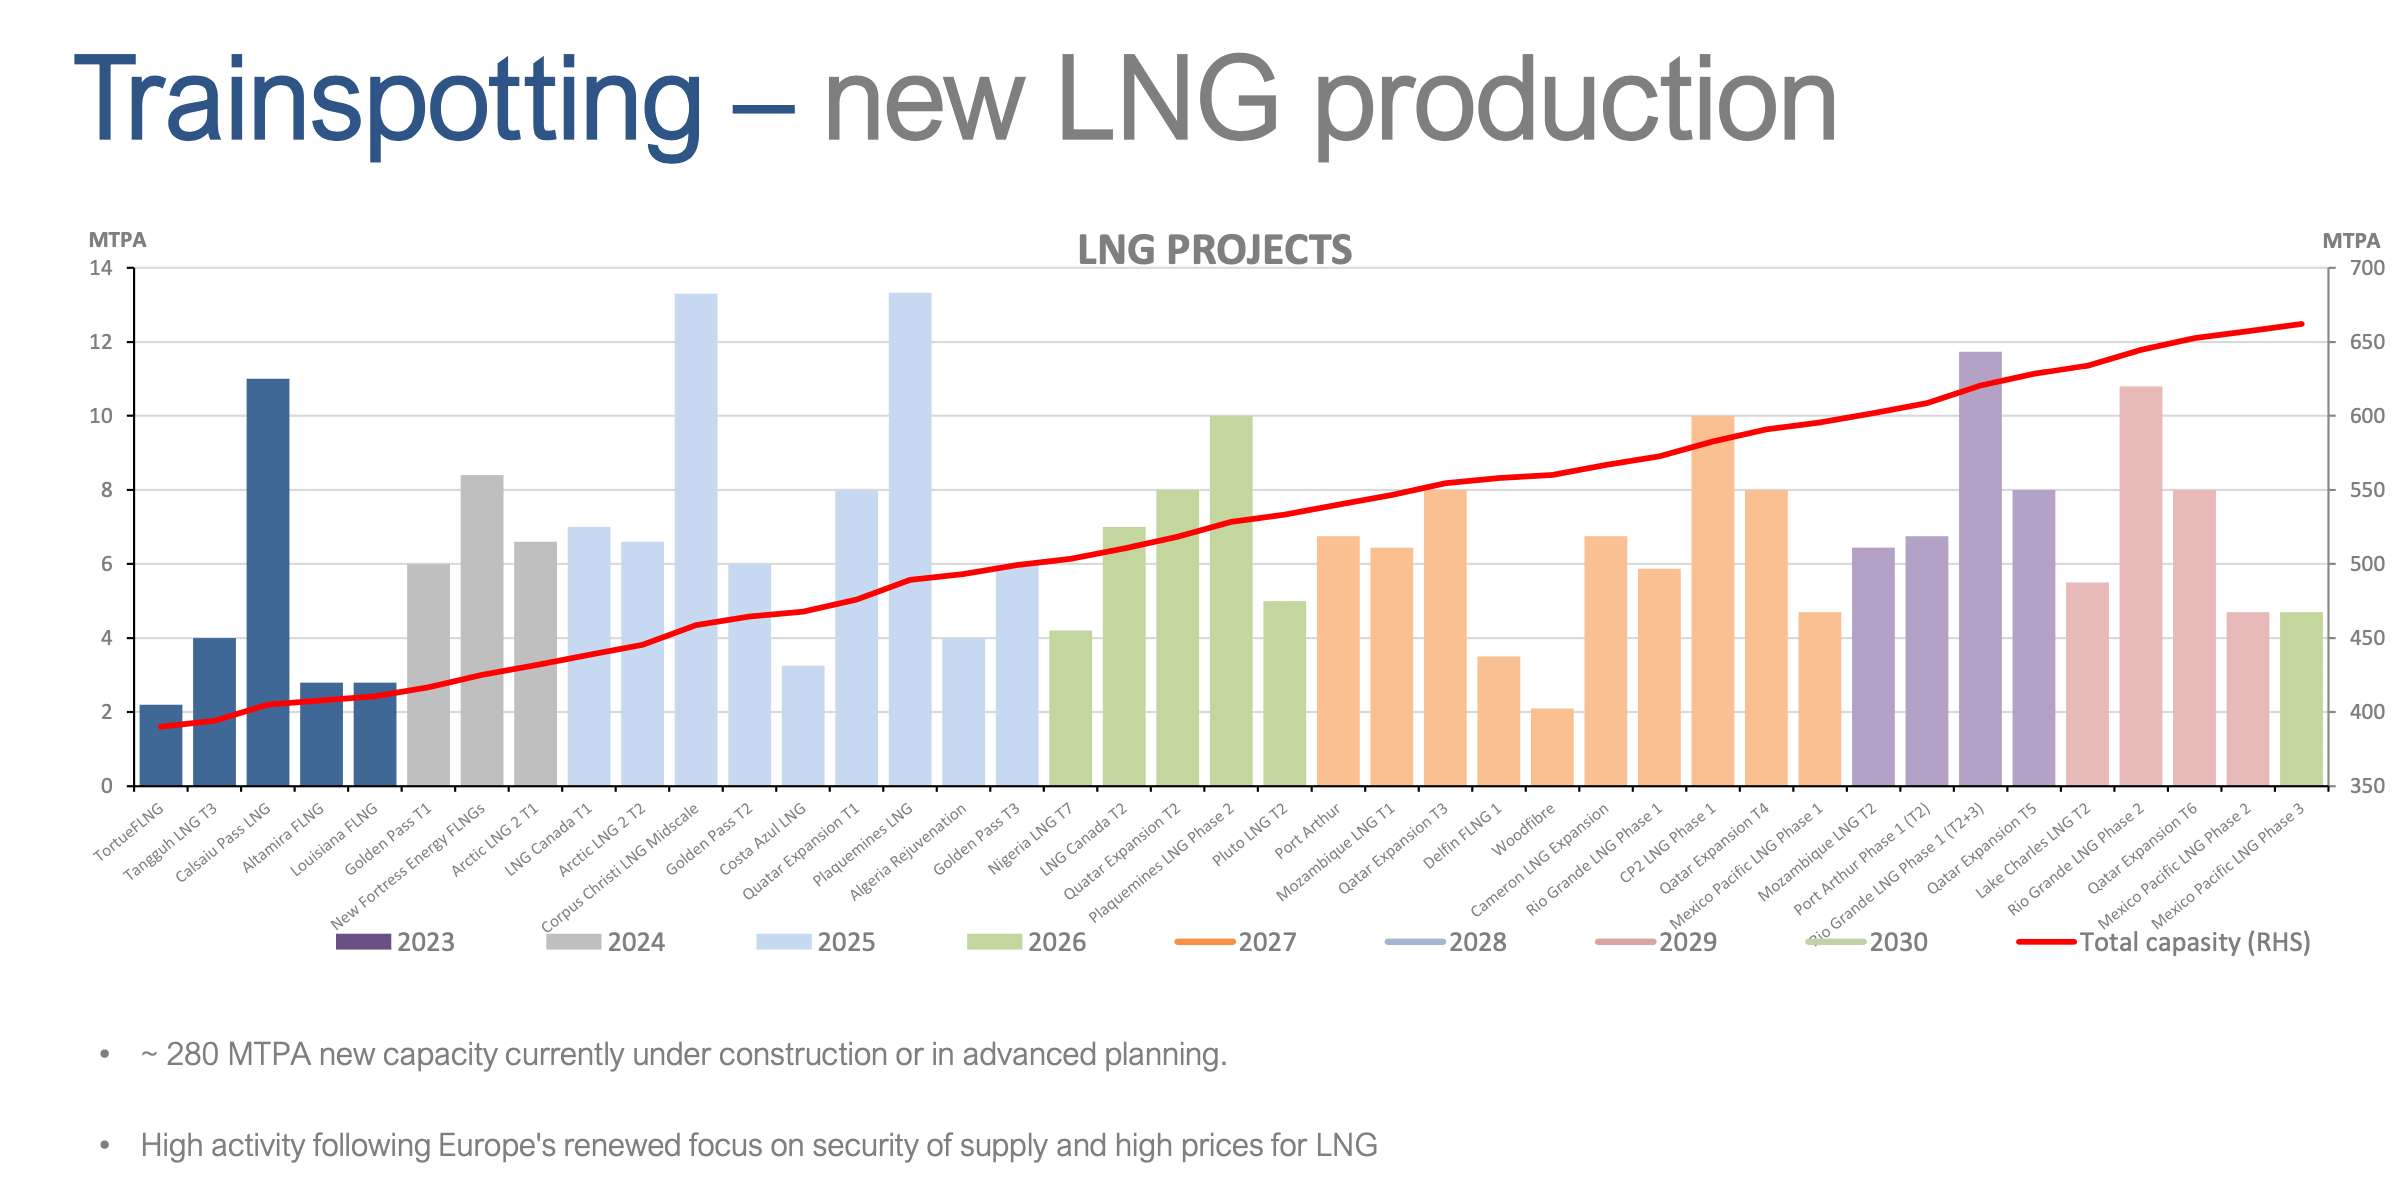
Turning to its smaller peer, Awilco LNG, we can find a few exciting slides from its presentation at the Pareto Conference regarding the market's long-term outlook. First, the supply side:
LNG market supply side growth towards 2030 (Awilco LNG at 30th Annual Pareto Conference)
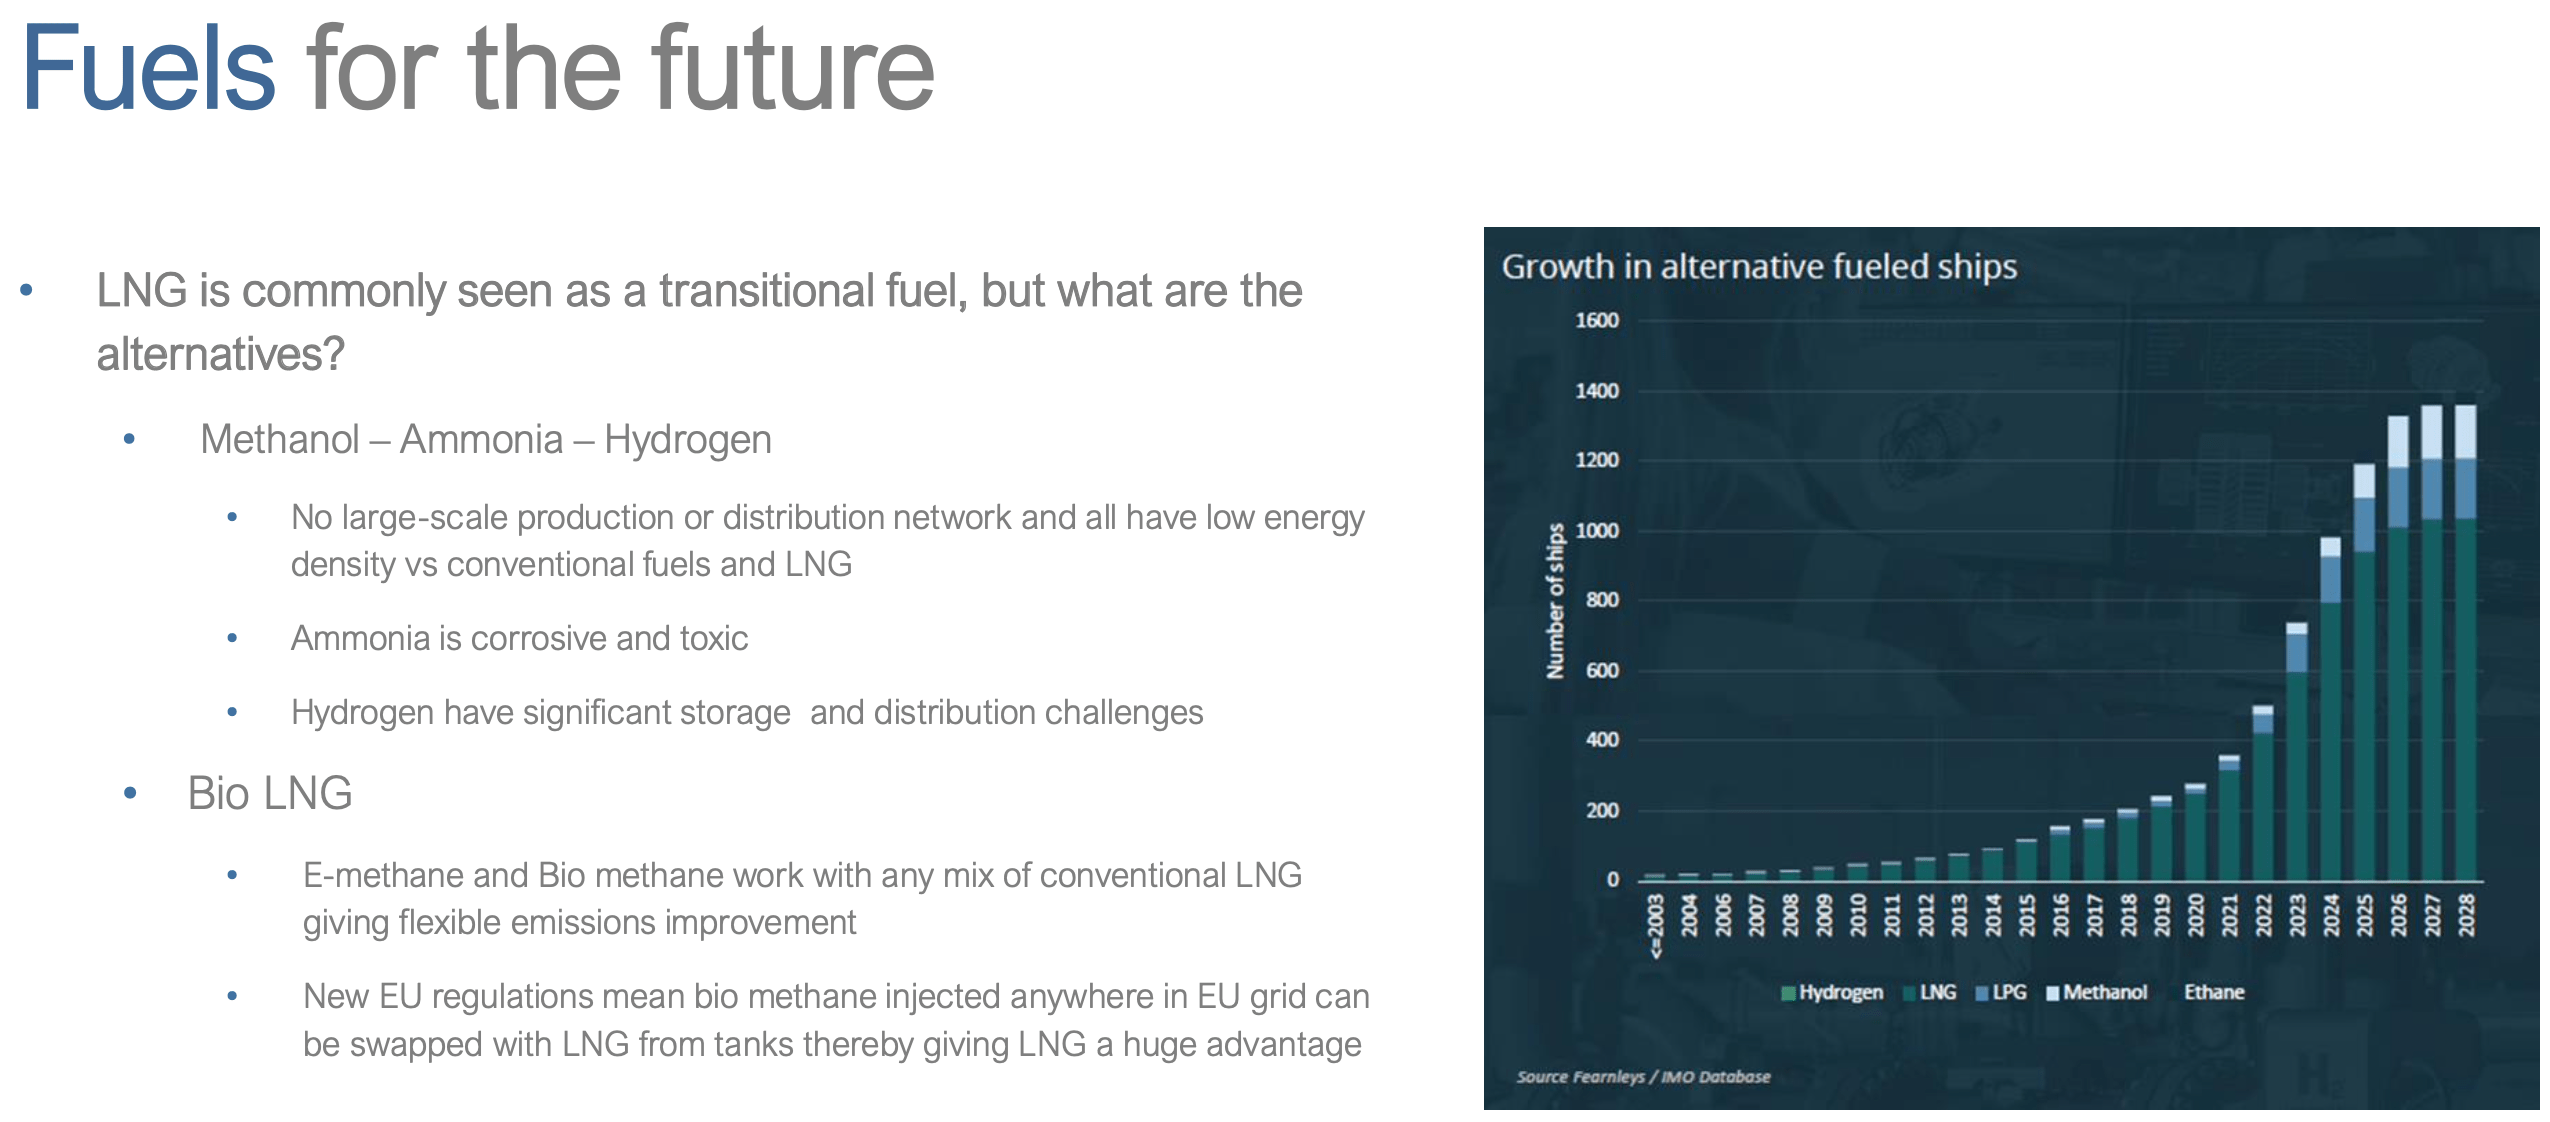
As for the demand side, Awilco argues that the "transition period" where LNG is used in place of something like ammonia may be more extended than some think:
LNG market demand outlook towards 2030 (Awilco LNG at 30th Annual Pareto Energy Conference)
Finally, Europe looks set to rely on LNG for some time. However, an end to the war in Ukraine and a return of Russia to the world stage could upend market fundamentals - once again.
Conclusion
This article has compared Flex LNG to other publicly listed LNGC pure plays. It found that while FLNG is relatively expensive, its contract backlog and LNG market fundamentals support buying Flex LNG as a predictable dividend generator. Alternatives, like Awilco LNG, exist but suffer in terms of liquidity and contract backlog.
Investors with a bullish view on spot rates in the near to medium term might consider Cool Company as an alternative, as its relatively more extensive spot market exposure opens it up to potentially better freight rates.
Awilco LNG offers some strong fundamentals, but its limited fleet size and share liquidity make it unsuitable.
Finally, Dynagas LNG Partners' complicated share structure and loan covenants forces the investor to consider its Series A Preferred Units for distributions. Its aging fleet and high new-build prices could pose problems down the line, and cause common unitholders to continue not receiving distributions.
Appendix: Calculations
As Flex LNG is the only company where data is readily available on sites like YCharts, charts were created "from the ground up" in this analysis. I relied on quarterly reports pulled from each company's website and SEC's EDGAR database to accomplish this.
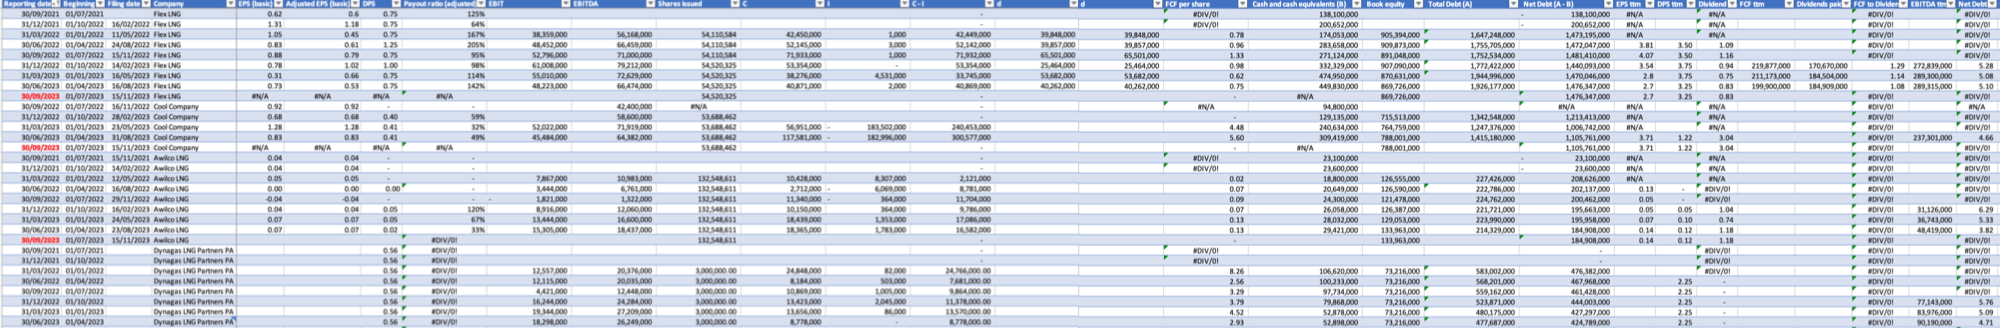
This exercise resulted in the monstrosity shown below, which forms the basis for the above graphs.
The basis for calculations used in this analysis (Quarterly reports from each company)
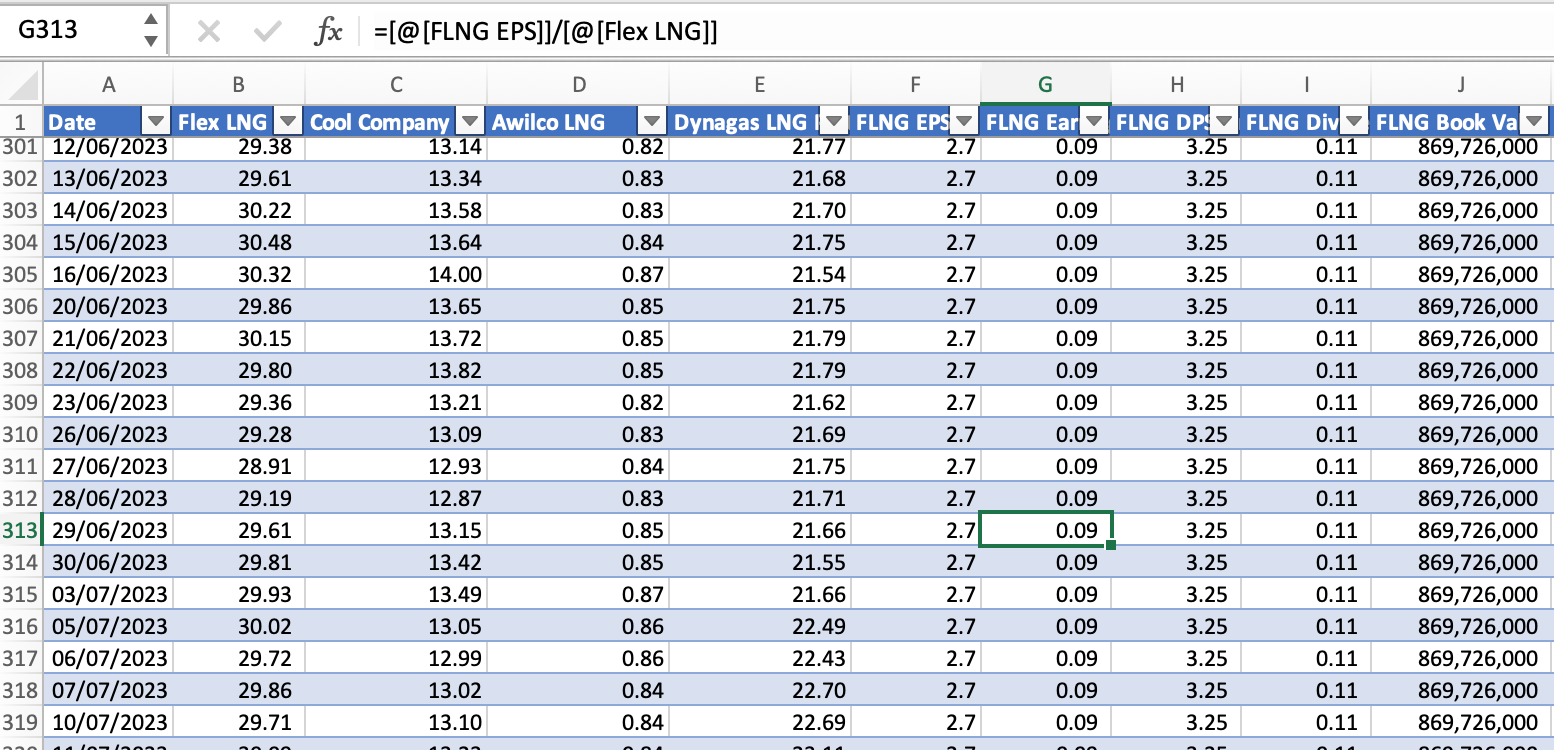
Relevant figures from this table were afterward joined to a table showing share price development. An example is shown below:
Example: FLNG earnings yield calculation (Author's calculations)
Data from the relevant quarter were joined to closing share prices in that quarter, and the ratios were calculated. The example above shows the earnings yield for June 29, 2023, where FLNG EPS (ttm) was divided by the share price. This process was repeated for all other ratios.
For further details see:
FLEX LNG: Is There A Better Alternative Currently? Apparently Not