FSI - Flexible Solutions And Its Real Value
2023-08-30 18:22:40 ET
Summary
- Flexible Solutions International, Inc. has a wide array of environmentally-friendly products and is poised for growth in the water conservation and energy conservation markets.
- Flexible Solutions has shown consistent earnings growth over the past 10 years, with a large spike in earnings in 2022.
- The company's fundamentals, including return on equity and debt-to-equity ratio, are strong, and Flexible Solutions International is currently undervalued according to its price-earnings ratio and estimated stock value.
Flexible Solutions International, Inc. ( FSI ) appears poised to take off in the near future. Despite not living up to the latest earnings report projections, FSI's CEO Mr. Daniel B. O'Brien remains optimistic about their growth. After all, FSI's Energy and Water Conservation product sales increased 16% this quarter. And while they may be seeing headwinds in some product categories, FSI's large array of products suggests that full development of the many markets they occupy is key to unlocking their earnings potential.
Specifically, FSI's main product lineup includes biodegradable polymers, detergent ingredients, water treatment, and crop nutrient availability chemistry. Flexible Solutions also manufactures biodegradable and environmentally safe water and energy conservation technologies. As touched on, it appears that the key to FSI reaching target earnings is continuing to develop their products and markets. This is auspicious news for FSI, as countries around the globe are treating energy and water conservation and environmentally safe products with increasing importance.
In fact, one of the United Nations Sustainable Development goals is providing safe, affordable water to all by 2030. As a result, Flexible Solutions will look to capitalize on a market primed with demand for their products. Additionally, it's worth noting that FSI reportedly has many products that are not yet commercialized.
Year to date, the Specialty Chemicals market that FSI operates in has risen 3.1%. This upward trend is encouraging for the market, and follows news trends as we would expect to see. It's given this market outlook, and FSI's wide variety of product applications in this space, that FSI appears to be an attractive company to consider current investment in, before the capabilities of their products are fully realized.
When considering these current stories about FSI, we need to determine which news topics will have a long-term and ongoing effect on the company and its share price. While reports of underperforming earnings may hurt the company in the short term, FSI's product development and continuous addition of product applications should have a more long-term and positive impact on the company and its earnings potential.
While current news stories, good or bad, can sway our opinion about investing in a company, it's good to analyze the fundamentals of the company and to see where it's been in the past and in which direction it's heading.
This article will focus on the long-term fundamentals of Flexible Solutions International, which tend to give us a better picture of the company as a viable investment. I also analyze the value of the company versus the price and help you to determine if FSI is currently trading at a bargain price. I provide various situations which help estimate the company's future returns. In closing, I will tell you my personal opinion about whether I'm interested in taking a position in this company and why.
Snapshot of the Company
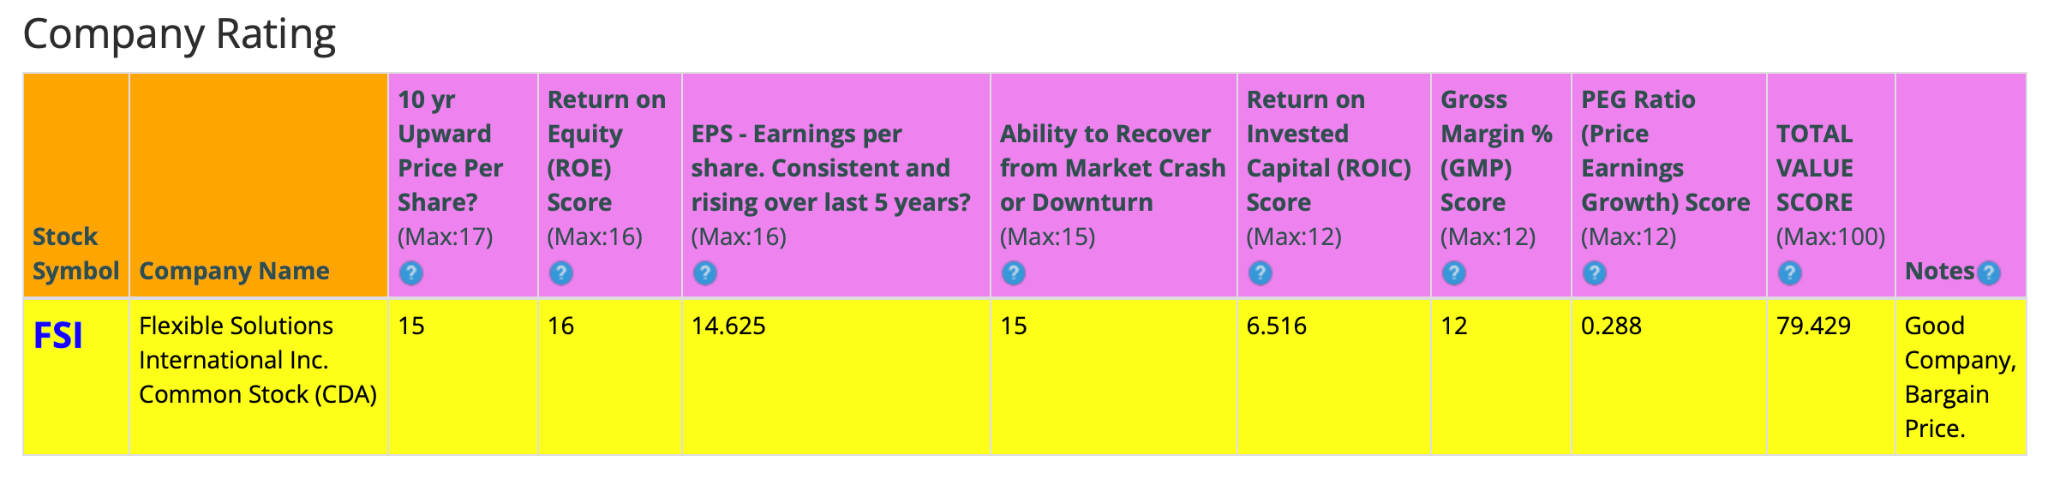
A fast way for me to get an overall understanding of the condition of the business is to use the BTMA Stock Analyzer's company rating score. FSI currently has a company rating score of 79.4 out of 100. To summarize, FSI appears to have several fundamentals producing above average numbers, with only two unfavorable scores bringing down their overall company rating.
Before jumping to conclusions, we'll have to look closer into individual categories to see what's going on.
Fundamentals
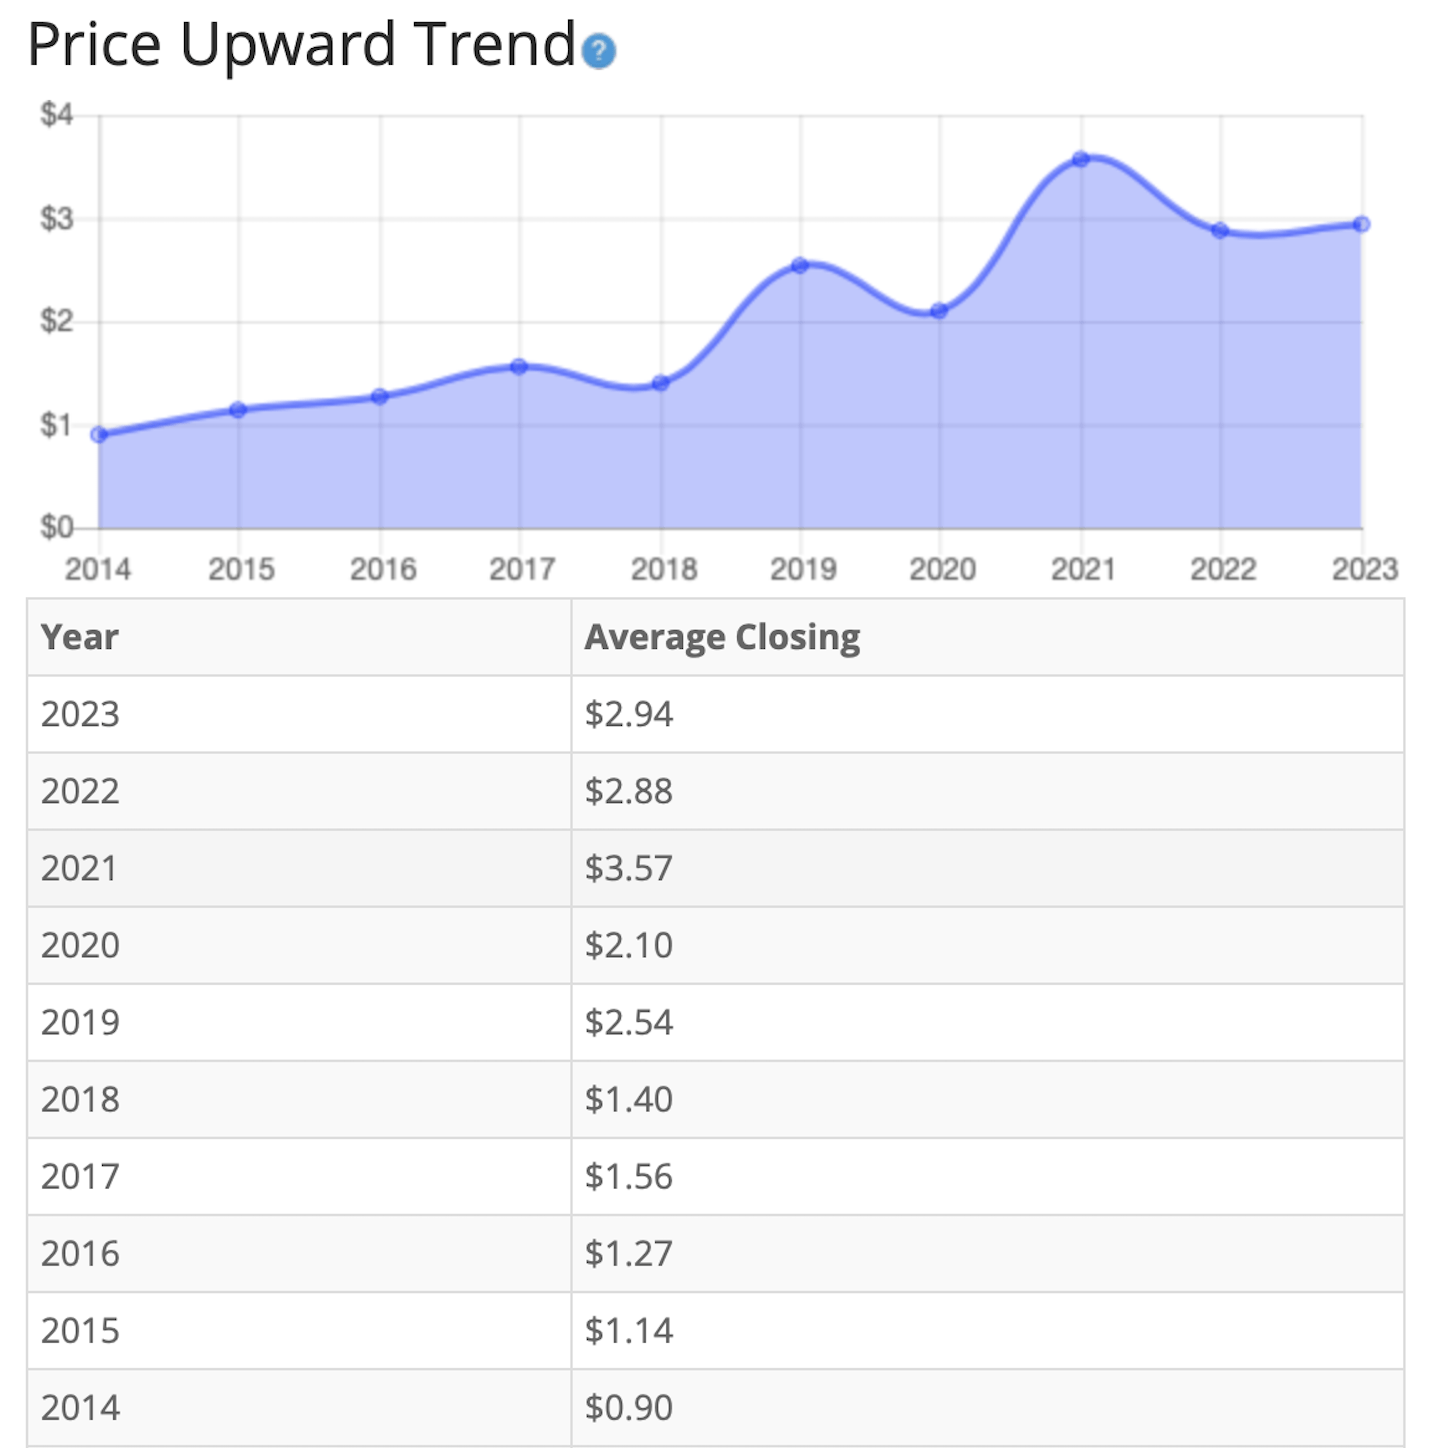
Let's examine the price per share history first. In the chart below, we can see that price per share has been on an upward trend over the last 10 years. Overall, share price average has grown by about 226.67% over the past 10 years, or a Compound Annual Growth Rate ((CAGR)) of 14.06%. This is a respectable return.
Earnings
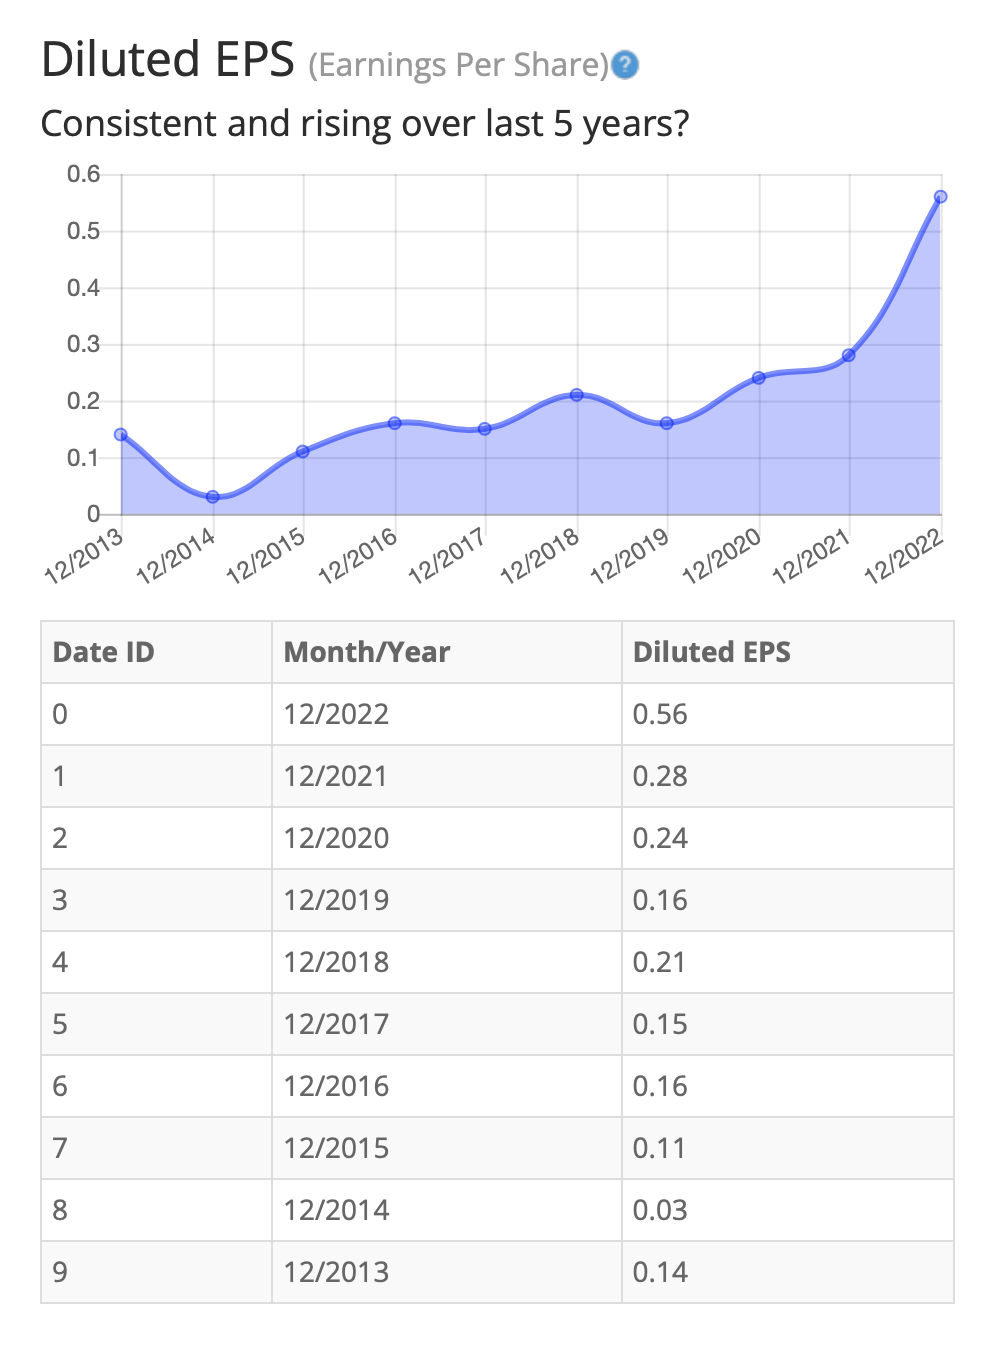
Looking closer at earnings history, we see earnings have been on an upward trend of growth over the last 10 years. It's worth noting that of the last 10 years, there have only been 3 years in which the earnings did not rise, and in each of these cases, earnings rose again substantially the year after. Most recently, FSI saw its largest earnings increase to date, from 2021 to 2022.
This large earnings spike in 2022 is encouraging for FSI, and could be attributed to the United Nations goal touched on earlier. As we get closer to 2030, the UN's goal date to ensure availability and sustainability management of water for everyone, FSI earnings should continue trending increasingly upward. While earnings over the next 8 years may not be as drastic as the increase from 2021 to 2022 was, general upward movement is predicted.
Consistent earnings make it easier to accurately estimate the future growth and value of the company. So, in this regard, FSI is a good example of a stock to accurately estimate future growth or current value.
Since earnings and price per share don't always give the whole picture, it's good to look at other factors like the gross margins, return on equity, and return on invested capital.
Return on Equity
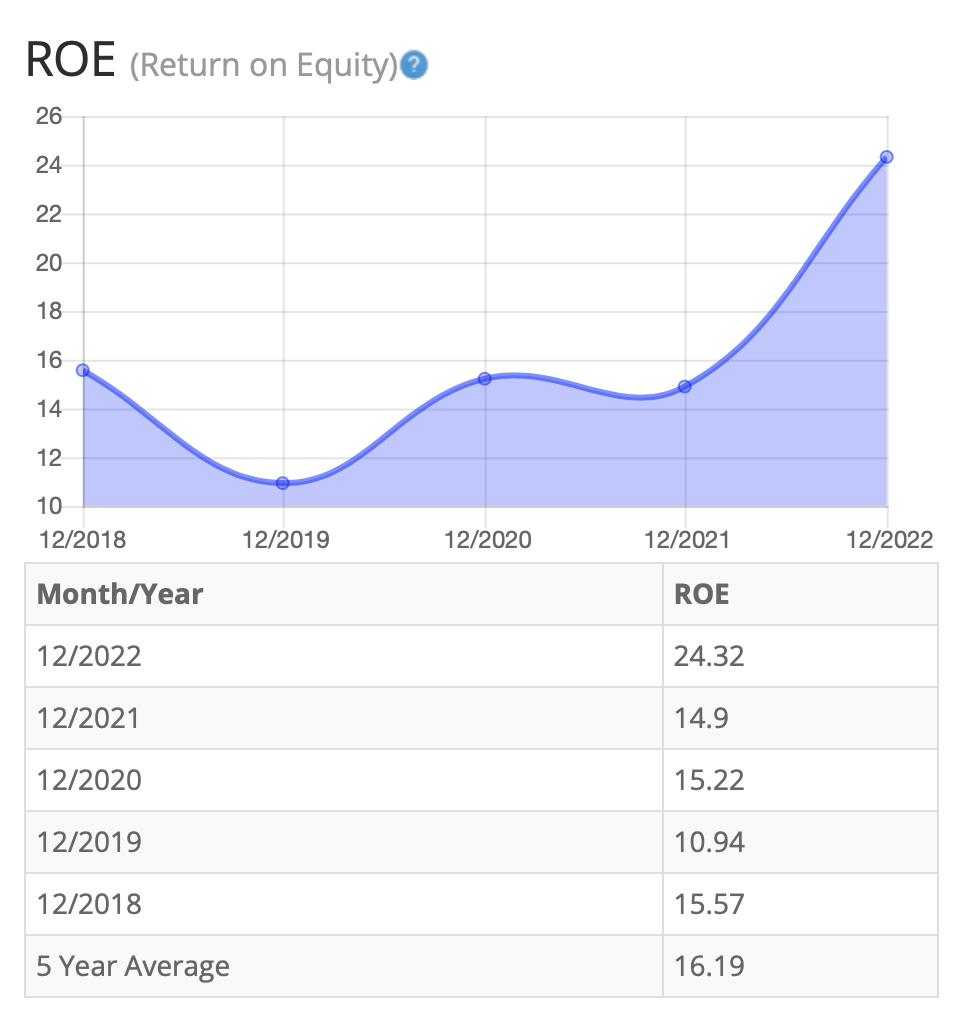
The return on equity ("ROE") has improved considerably in the period from 2018 to 2022. The most recent decrease in ROE occurred in 2019. After this decrease, it rebounded significantly the following year, holding at this level in 2021 as well. Most recently, ROE has risen 63.22% in 2022, for a total ROE increase of 122.30% since 2019. For return on equity, I look for a 5-year average of 16% or more. Hence, FSI meets this requirement.
Let's compare the ROE of this company to its industry. The average ROE of 76 Specialty Chemical companies is 11.43%.
Therefore, both FSI's 5-year average of 16.19%, and current ROE of 24.32%, are well above average.
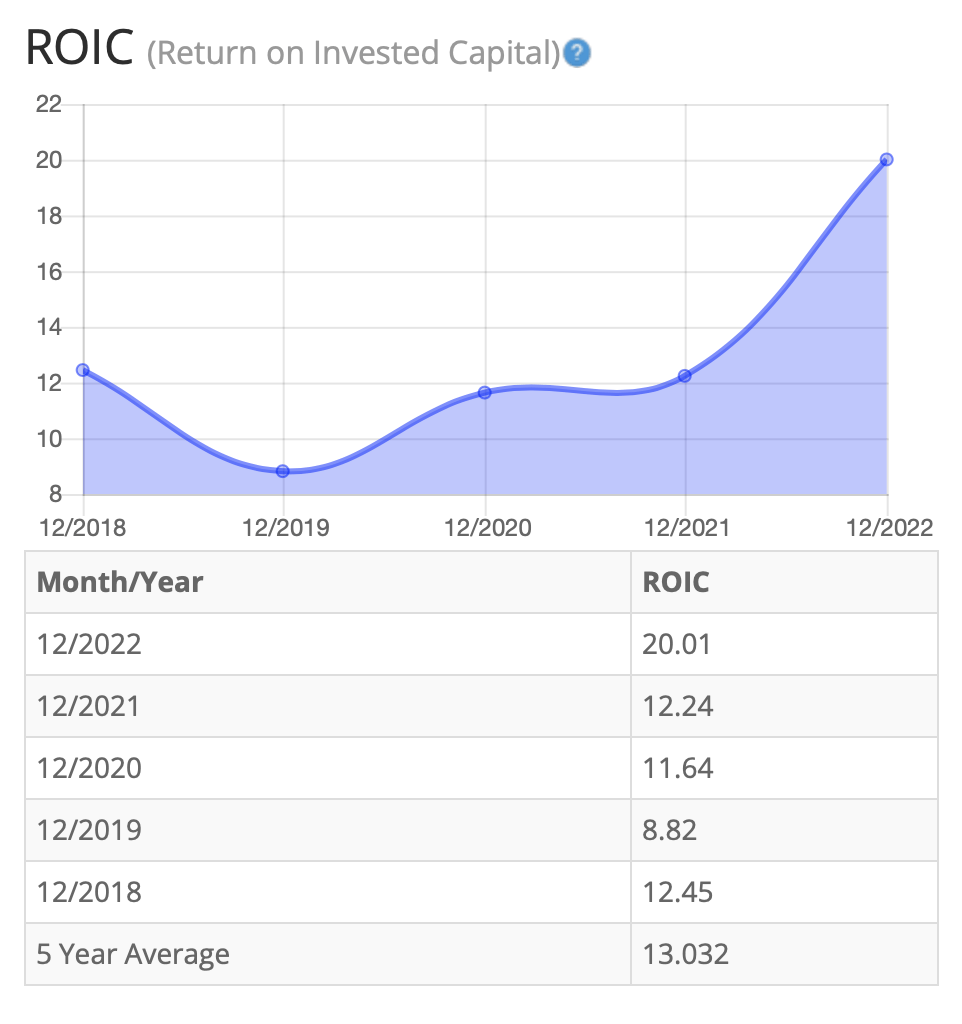
Return on Invested Capital
The return on invested capital has mirrored FSI ROE trends. ROIC fell in 2019, before rebounding the year after. ROIC recorded the same spike upwards in 2022 as well, with a 20.01% ROIC that year. For return on invested capital ("ROIC"), I also look for a 5-year average of 16% or more. FSI narrowly misses this average, recording at 13%.
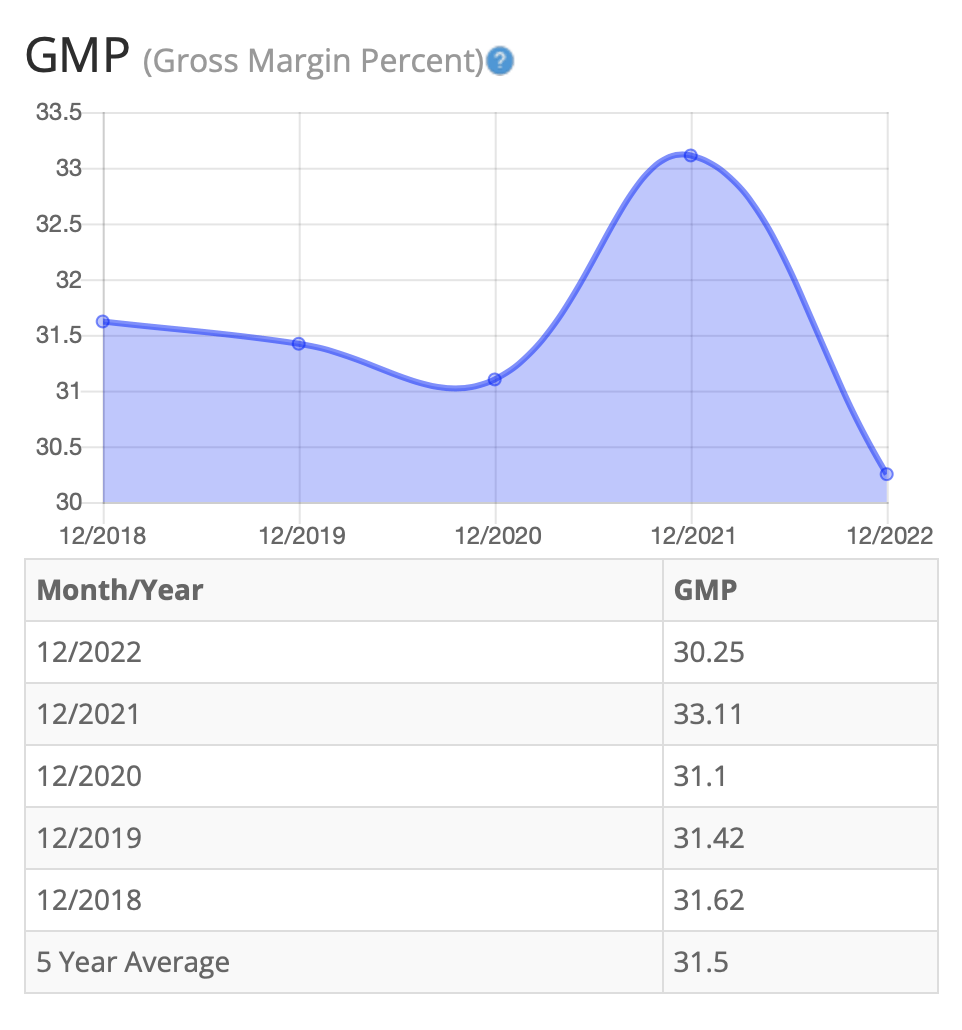
Gross Margin Percent
The gross margin percent ((GMP)) has mostly decreased over the last five years. GMP greatly rose in 2021, but then fell by even more, nearly 9%, in 2022. Even with the decline, however, overall gross margin percent is at high levels. Five-year GMP is good at around 31.5%. I typically look for companies with gross margin percent consistently above 30%. So, FSI has proven that it has the ability to maintain acceptable margins over a long period. However, I would like to keep an eye on the GMP to make sure that there is not a continual downward trend.
Financial Stability
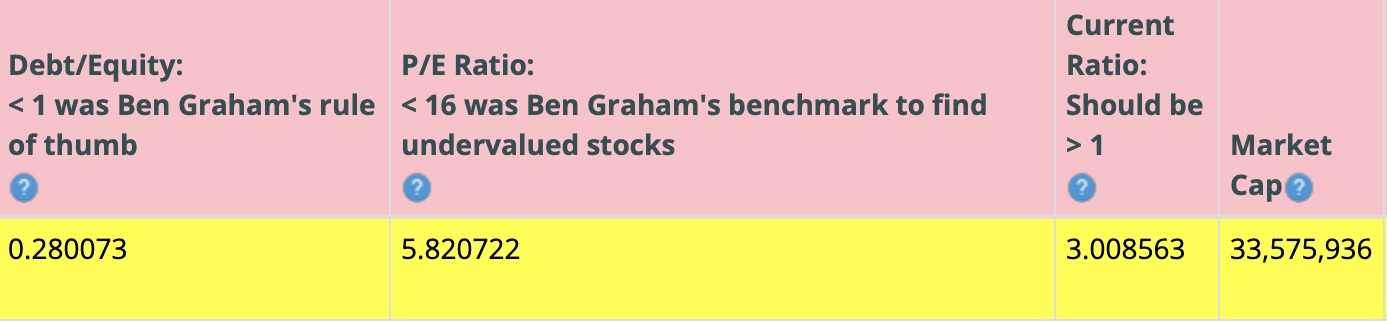
Looking at other fundamentals involving the balance sheet , we can see that the debt-to-equity is less than 1. This is a positive indicator, telling us that the company owns more than it owes.
FSI's Current Ratio of 3.00 is satisfactory, indicating it has an adequate ability to use its assets to pay its short-term debt.
Ideally, we'd want to see a Current Ratio of more than 1, so FSI exceeds this amount.
According to the balance sheet, the company appears to be in good financial health. In the long term, the company has more than enough assets to cover its debts. In the short term, the company is generating enough cash flow to fulfill its obligations.
FSI doesn't pay a regular dividend, but it does have a history of occasionally paying a dividend.
This analysis wouldn't be complete without considering the value of the company vs. share price.
Value Vs. Price
The company's Price-Earnings Ratio of 5.82 indicates that FSI could be selling at a severely undervalued price when comparing FSI's PE Ratio to a long-term market average P/E Ratio of 15.
The 10-year and 5-year average P/E Ratio of FSI has typically been 10.3 and 13.4, respectively. This indicates that FSI could be currently trading at a low price when comparing to its average historical P/E Ratio range.
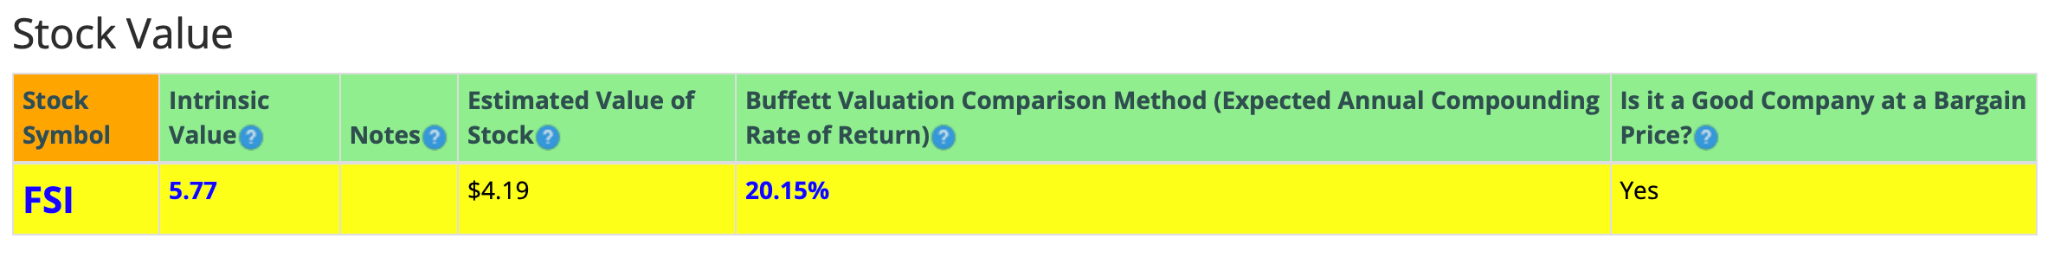
The Estimated Value of the Stock is $4.19, versus the current stock price of $2.70. This indicates that FSI is currently selling at a bargain price.
For more detailed valuation purposes, I will be using a conservative diluted EPS of 0.44. I've used various past averages of growth rates and PE Ratios to calculate different scenarios of valuation ranges from low to average values. The valuations compare growth rates of EPS, Book Value, and Total Equity.
In the table below, you can see the different scenarios, and in the chart, you will see vertical valuation lines that correspond to the table valuation ranges. The dots on the lines represent the current stock price. If the dot is towards the bottom of the valuation range, this would indicate that the stock is undervalued. If the dot is near the top of the valuation line, this would show an overvalued stock.
BTMA Wealth Builders Club
BTMA Wealth Builders Club
According to this overall valuation analysis, FSI is undervalued. But in terms of the short-term future projections, FSI is overpriced with a valuation of $1.93 to $2.12, versus a current price of $2.64.
Summarizing the Fundamentals
According to the facts, Flexible Solutions International, Inc. is financially healthy in a long-term sense in having enough equity as compared with debt, and in the short-term sense because the current ratio indicates that it has plenty of cash to cover current liabilities.
This company has an impressive earnings record, which shows upward improvement of earnings over a 10-year period.
Another consideration is that FSI's wide range of environmentally-friendly and energy-conservative products will see an increase in demand in the coming months and years. With world leaders across the globe pledging support to the environment by taking steps to limit energy consumption and prioritize water conservation, the demand for FSI's products should only rise.
FSI Vs. The S&P 500
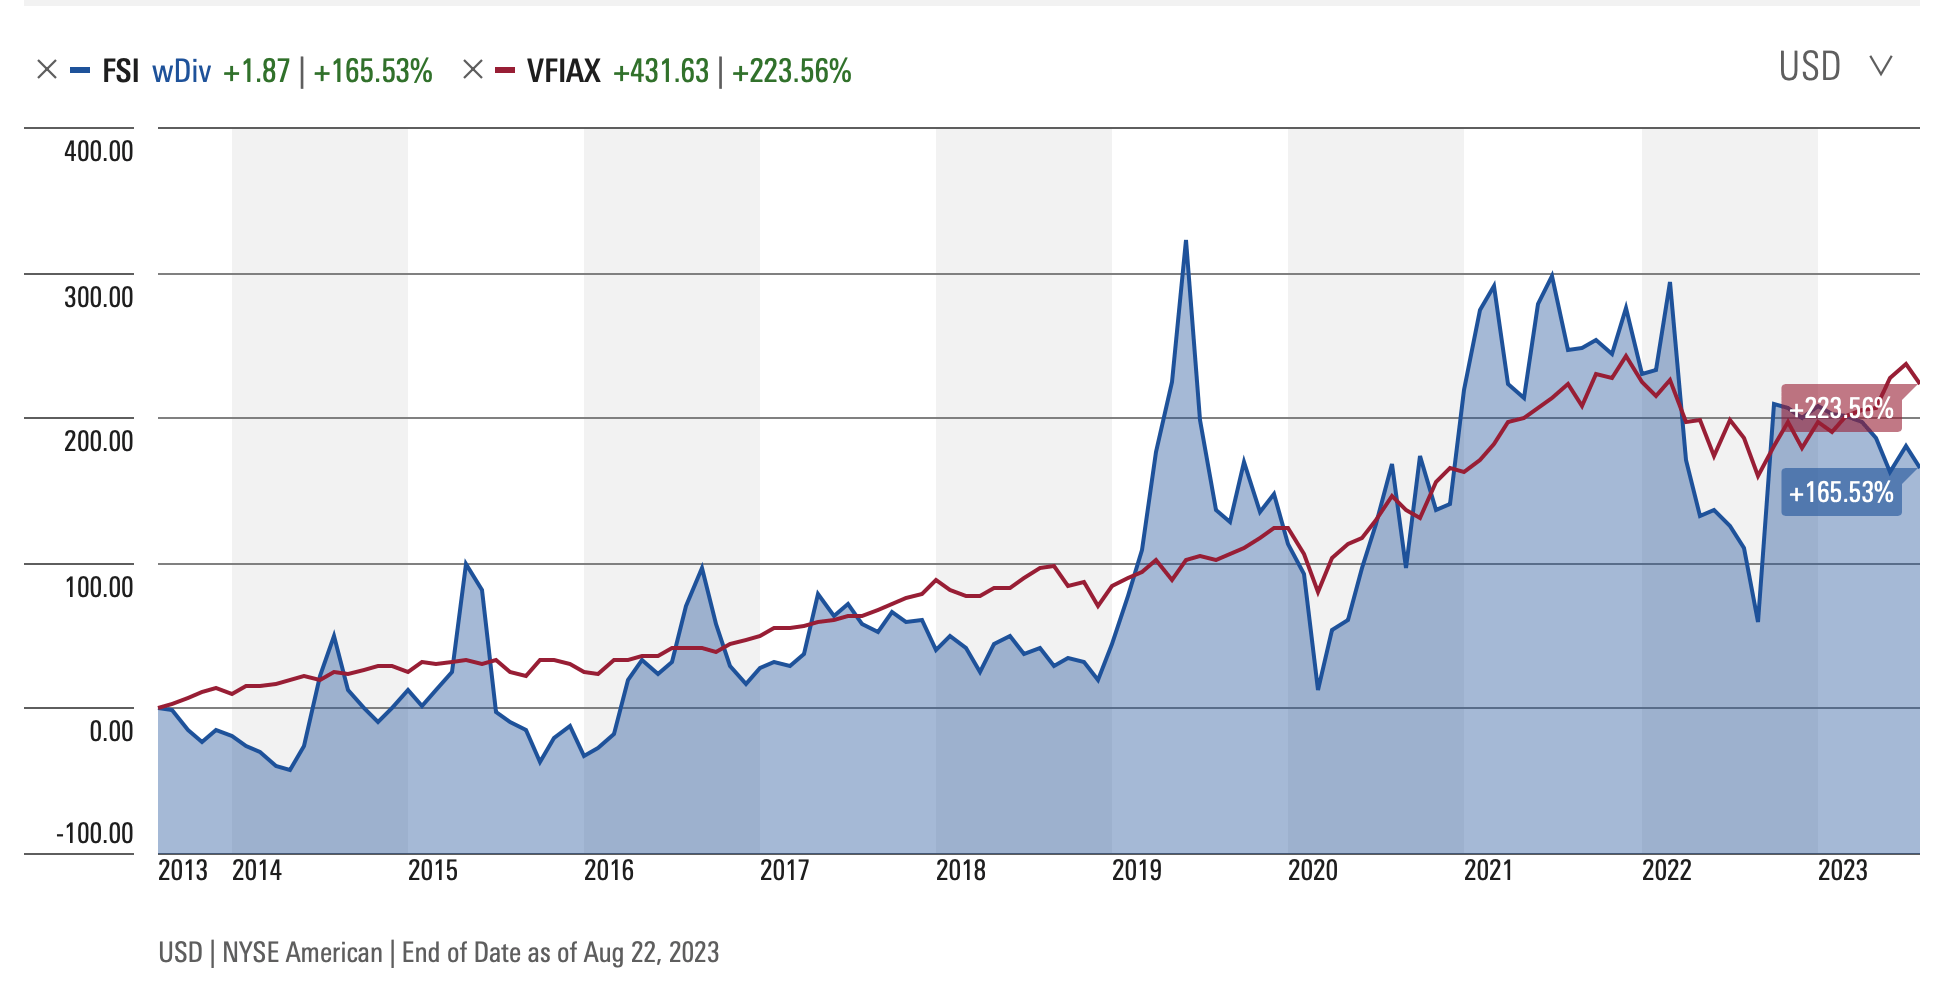
Now, let's see how FSI compares versus the U.S. stock market benchmark S&P 500 (SP500) over the past 10 years. From the chart below, we can see that the general market has outperformed FSI during a majority of the 10-year period. FSI, however, has shown remarkable resistance to down markets, and has seen encouragingly steady upward movement over the last 10 years. Notice that FSI has a repeated pattern of spikes and valleys that follow along with the benchmark. This pattern of volatility makes FSI an opportune stock to buy during the dips when FSI falls significantly in relation to the benchmark, then to sell when FSI peaks significantly above the benchmark performance.
Forward-Looking Conclusion
Over the next five years, the analysts that follow this company are expecting it to grow earnings at an average annual rate of 21.12%.
In addition, the average one-year price target for this stock is at $6.00, which is about a 122.22% increase in a year.
The Expected Annual Compounding Rate of Return is 17.81%.
If considering actual past results of FSI Company, the story is a bit different. Here are the actual 10 and 5-year return results.
______________
10-Year Return Results if Invested in FSI:
Initial Investment Date: 8/30/2013.
End Date: 8/30/2023.
Cost per Share: $1.13.
End Date Price: $2.65.
Dividends Received: $0.15.
Total Return: 147.79%.
Compound Annualized Growth Rate: 10%
_______________
5-Year Return Results if Invested in FSI:
Initial Investment Date: 8/30/2018.
End Date: 8/30/2023.
Cost per Share: $1.50.
End Date Price: $2.65.
Dividends Received: $0.15.
Total Return: 86.67%.
Compound Annualized Growth Rate: 13%
_________________
From these scenarios, we have produced results from 10% to 13%. I feel that if you're a long-term patient investor and believer in FSI, and its existing products (polymers and water treatment), you could expect FSI to provide you with an average of 12% annual return over the long haul. But, if you're able to take advantage of FSI's pattern of price swings and buy when it's low in relation to the S&P 500 and sell when it has peaked above the S&P 500, you could experience gains near 20%.
Does FSI Pass My Checklist?
- Company Rating 70+ out of 100? YES (79.4).
- Share Price Compound Annual Growth Rate > 12%? YES (14.06%).
- Earnings history mostly increasing? YES.
- ROE (5-year average 16% or greater)? YES (16.2%).
- ROIC (5-year average 16% or greater)? NO (13.0%).
- Gross Margin % (5-year average > 30%)? YES (31.5%).
- Debt-to-Equity (less than 1)? YES (0.28).
- Current Ratio (greater than 1)? YES (3.0).
- Outperformed S&P 500 during most of the past 10 years? NO.
- Do I think this company will continue to successfully sell their same main product/service for the next 10 years? YES.
FSI scored 8/10 or 80%. Therefore, FSI is definitely worth considering as a potential investment.
Is FSI currently selling at a bargain price?
- Price Earnings less than 16? YES (5.82).
- Estimated Value greater than Current Stock Price? YES (Value $4.19 > $2.70 Stock Price. Also, the detailed average valuation from the charts above was $4.17).
Overall, I'm impressed with the fundamentals of FSI. The return is as good or better than the S&P 500 benchmark. I feel that when bought at a bargain price, the returns in Flexible Solutions can far exceed the benchmark. Additionally, I see plenty of potential growth for this small company and its involvement in the water conservation niche. Therefore, I'm interested in obtaining shares of Flexible Solutions International, Inc.
For further details see:
Flexible Solutions And Its Real Value