FLS - Flowserve Needs Margin Stability
2023-05-29 05:16:06 ET
Summary
- Flowserve is enjoying excellent revenue growth.
- The company struggles with generating consistent margins with low variability.
- The dividend yield is low and has grown slowly over the past five years.
Flowserve Corporation ( FLS ) is seeing strong revenue growth but has struggled to generate consistent margins and returns. The company's dividend yield is low for this rate environment, and its dividend has grown slowly over the past five years. The company's revenue growth rate may be propping up the stock. FLS stock is overvalued, given its cash flow generation capacity. Investors may have to wait for a pullback before investing in Flowserve.
The revenue growth rate may be behind the stock's strength
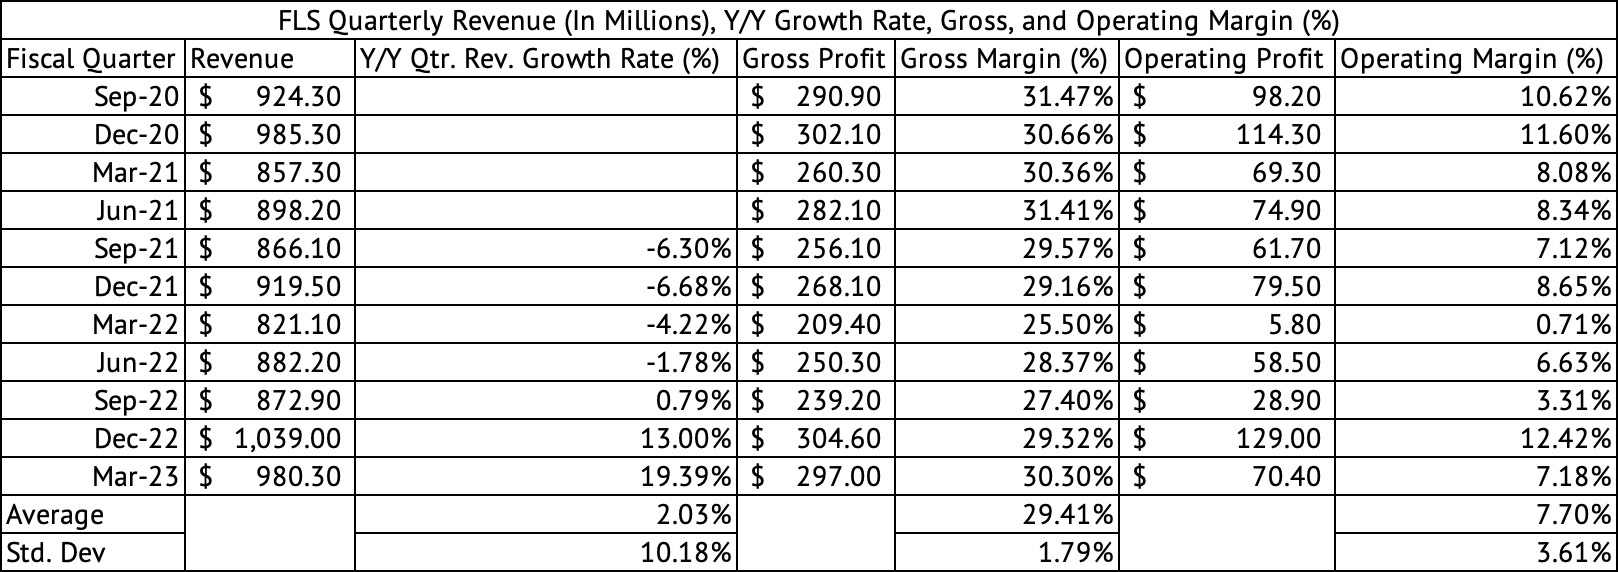
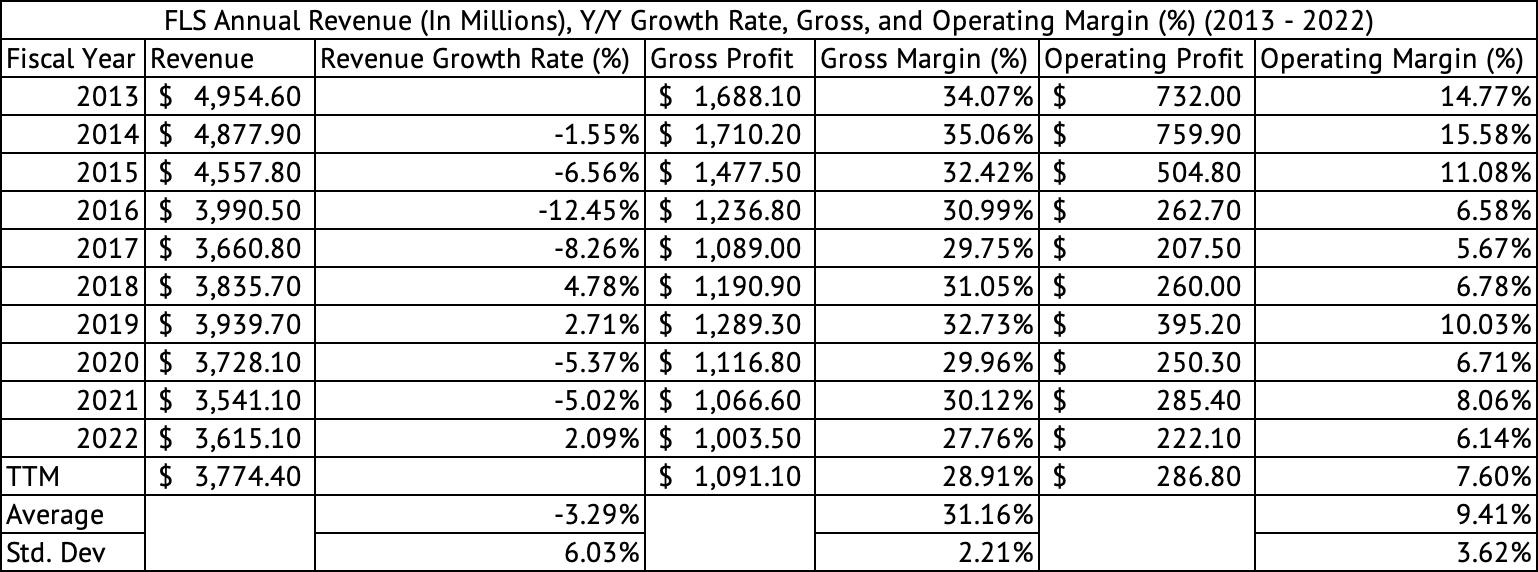
The company showed remarkable y/y revenue growth of 19.4% in Q1 2023. The company expects a 10% to 12% growth in revenue for the fiscal year. The company grew revenue by 13% y/y in Q4 2022. The strong demand for the company's products and double-digit revenue growth may be the biggest reason behind the stock's strength. The company has returned 9.9% over the past year compared to the 3.6% return for the Vanguard S&P 500 Index ETF ( VOO ). The Vanguard Industrials Index fund ETF ( VIS ) has returned 6.7% over the past year. Investors are willing to pay a premium for this double-digit revenue growth. The company's quarterly gross margins, which have been under pressure since September 2021, are beginning to improve (Exhibit 1) . The company has averaged 29.4% gross margins since September 2021 compared to its annual average gross margin of 31.1% since 2013 (Exhibit 2) .
Exhibit 1:
Flowserve Quarterly Revenue, Gross, Operating Profits, and Margins (%) (Seeking Alpha, Author Compilation)
Exhibit 2:
Flowserve Annual Revenue, Gross, Operating Profits, and Margins (%) (Seeking Alpha, Author Compilation)
Increased inventory costs hit operating cash flows
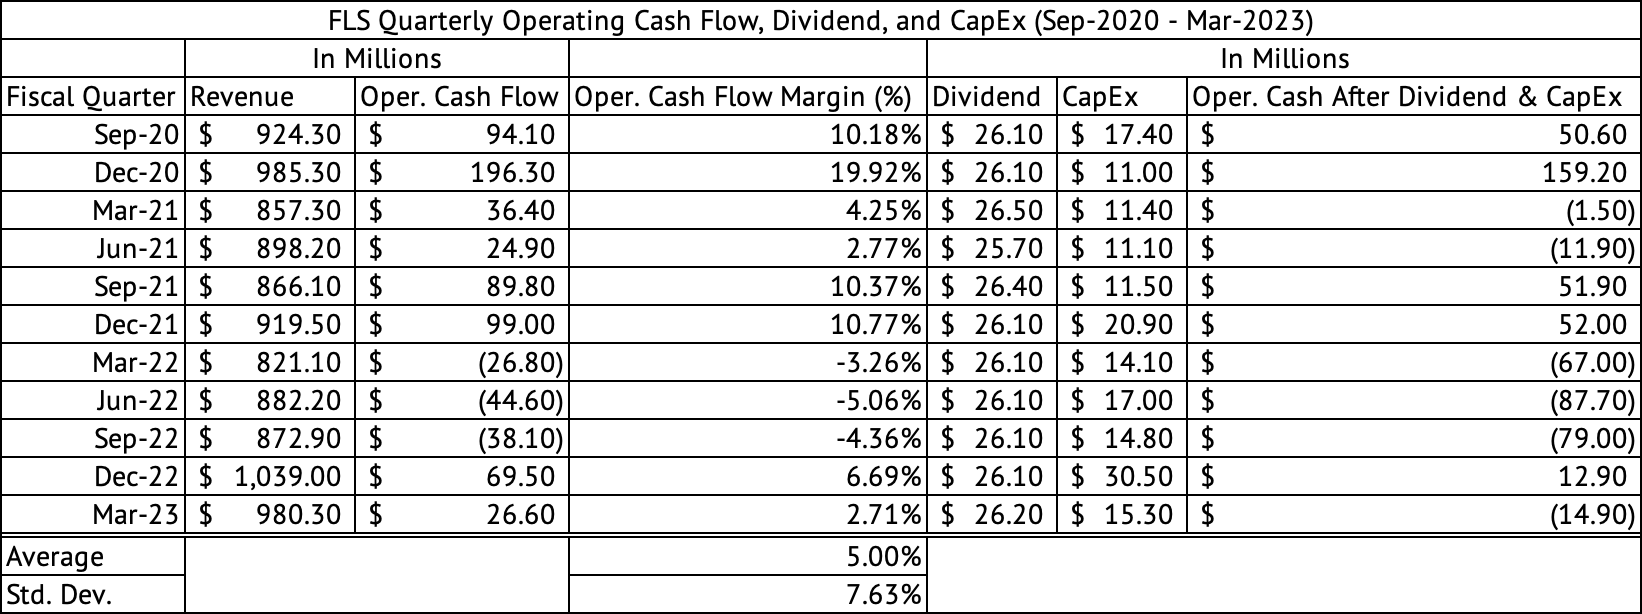
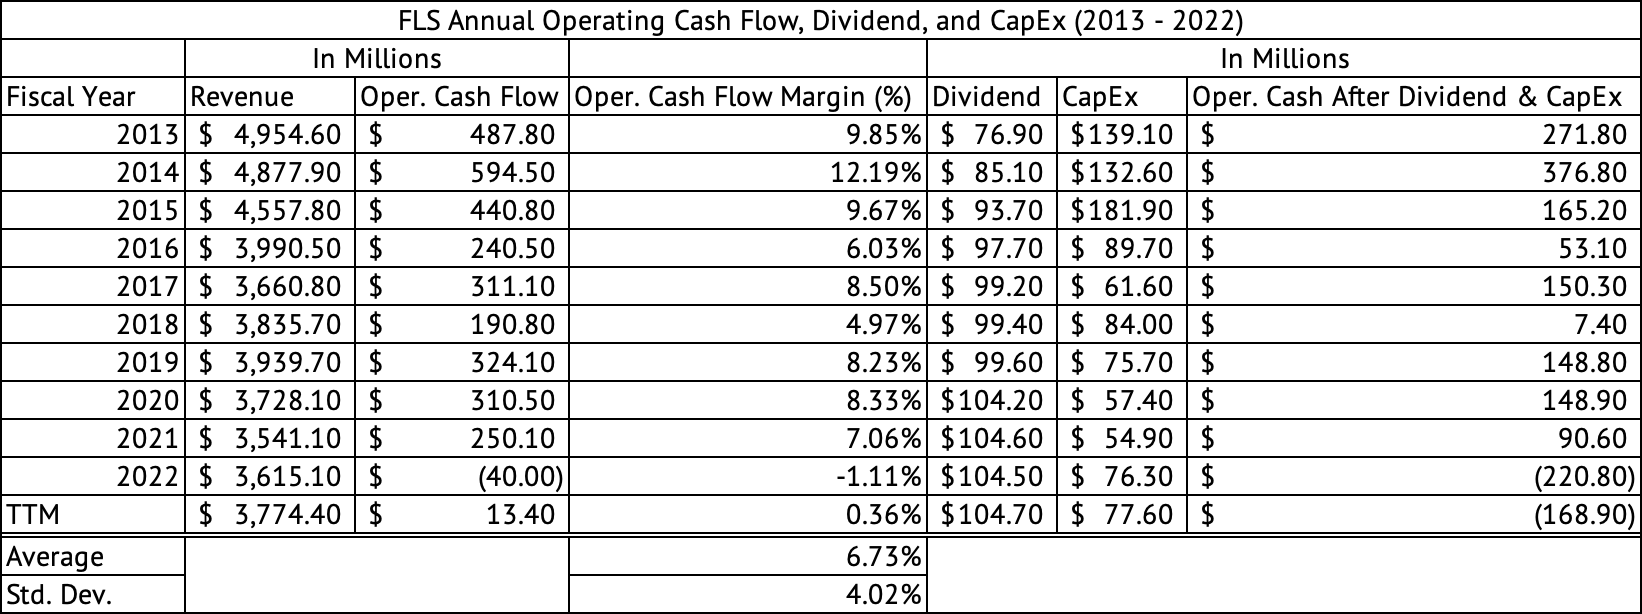
The higher variability in its operating margins has translated into higher variability of its cash flows. Its annual operating cash flow margins have averaged 6.7% with a standard deviation of 4% (Exhibit 4) . While its quarterly cash flow margins have averaged 5% since September 2020, which is lower than the annual rate partly due to increased inventory costs (Exhibit 3) . These inconsistent margins should be a concern for investors. It may show a need for more management control over their firm's operations.
Exhibit 3:
Flowserve Quarterly Operating Cash Flow, Dividend, and CapEx (Seeking Alpha, Author Compilation)
Exhibit 4:
Flowserve Annual Operating Cash Flow, Dividend, and CapEx (Seeking Alpha, Author Compilation)
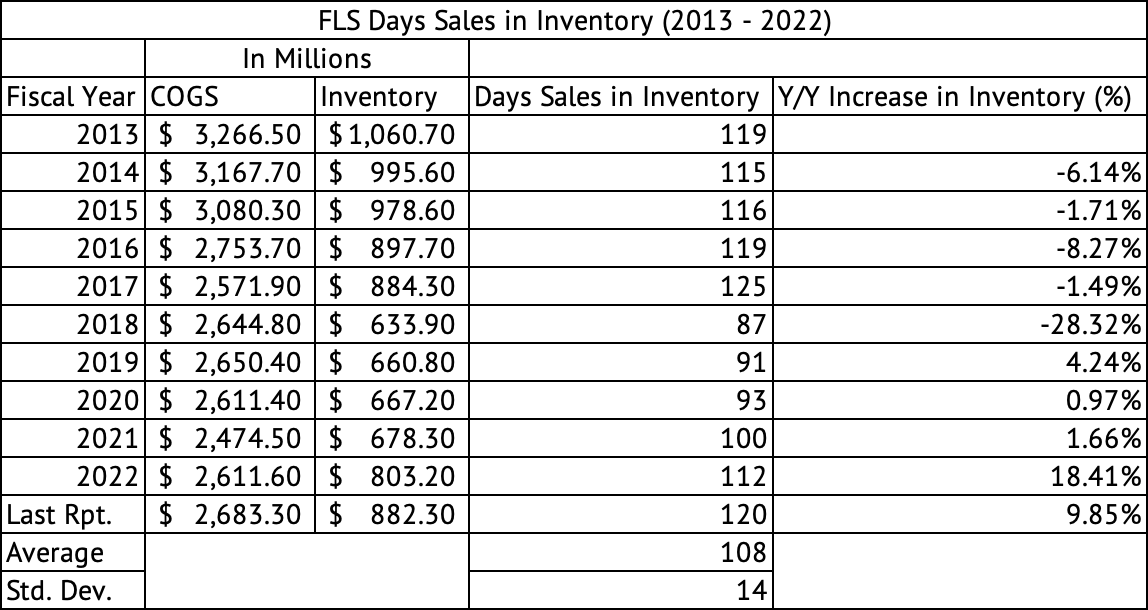
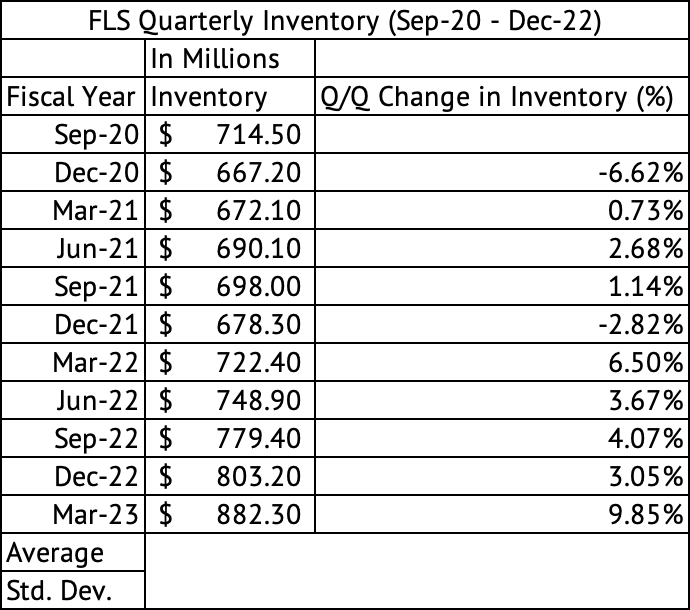
The company's operating cash flows have taken a hit due to increased inventory carrying costs and outstanding receivables. The company saw a y/y increase in inventory of 18.4% and a 9.8% increase in inventory in 2021 and 2022, respectively (Exhibit 5) . The company has seen a 5.4% average Q/Q increase in inventory carrying costs since March 2022 (Exhibit 6) . At the end of March, the company held 120 days of inventory compared to its average of 108, with a standard deviation of 14. The company used cash in its operations, not a good sign, in three of the last five quarters (Exhibit 3) . The lack of cash flows from operations may explain why the company's cash position has shrunk in the past few years. The company used up cash in four of the last five quarters when accounting for its dividend and CapEx expenditure.
Exhibit 5:
Flowserve Day's Sales in Inventory (Seeking Alpha, Author Compilation)
Exhibit 6:
Flowserve Quarterly Inventory (Seeking Alpha, Author Compilation)
High debt-to-EBITDA ratio
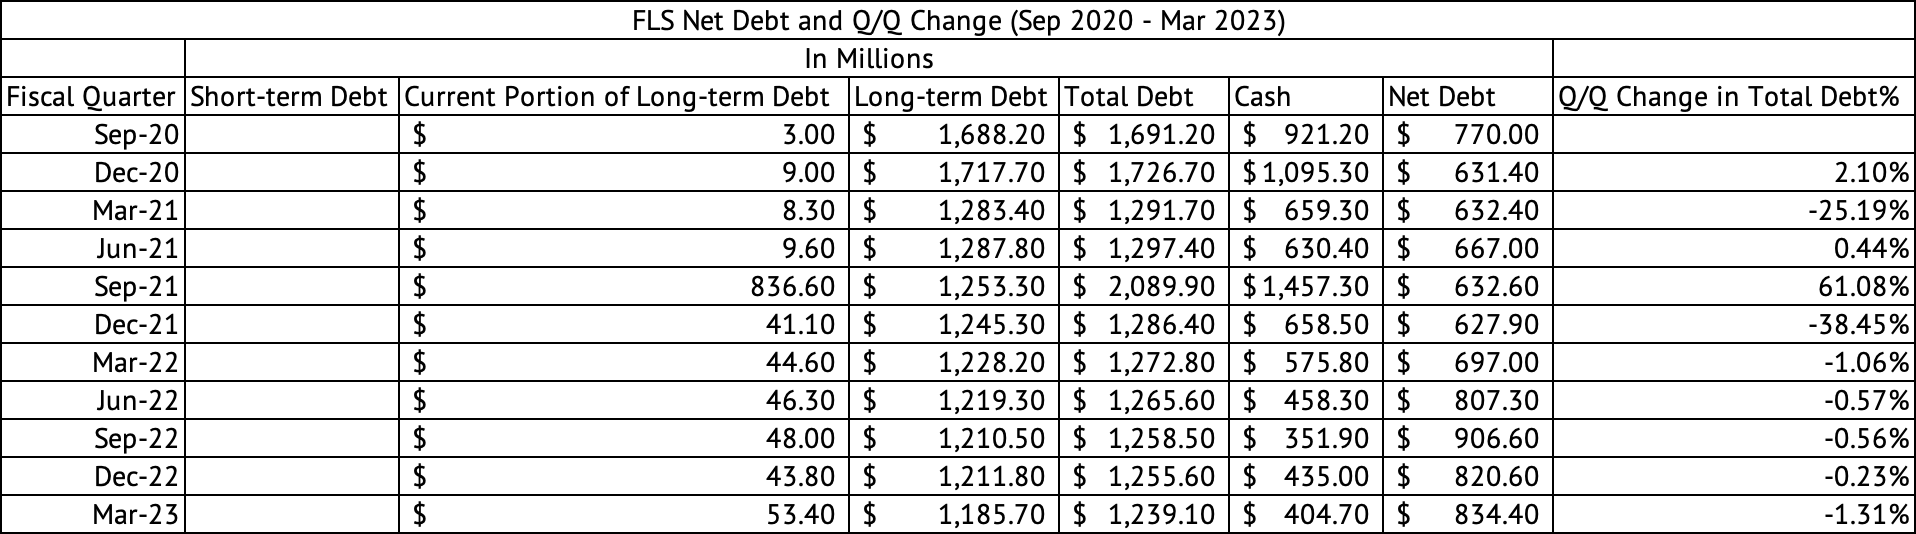
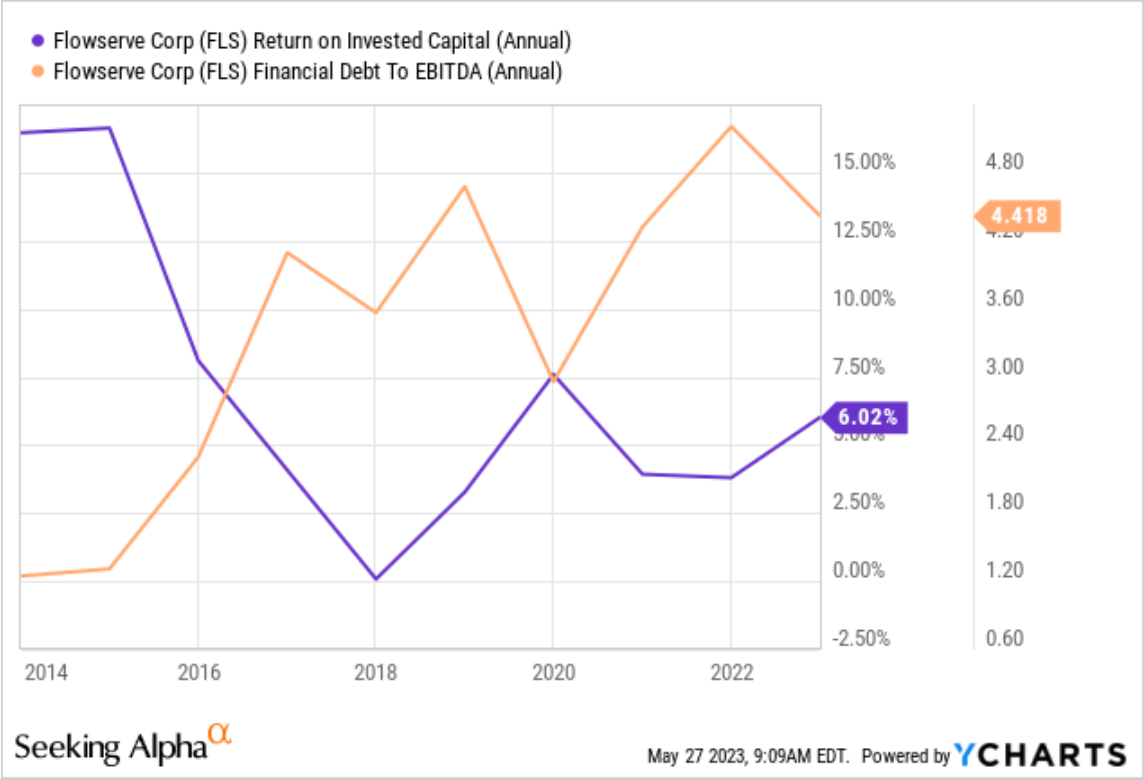
The company had a total debt of $1.23 billion at the end of its March quarter (Exhibit 7) . The company's debt-to-EBITDA ratio stands at a high of 4.4x (Exhibit 8) . The company has reduced its total debt since September 2020 from $1.69 billion to $1.23 billion in March. But, its net debt has increased from $770 million to $834 million during the same period due to reduced cash and short-term investments.
Its cash balance went from $921 million in September 2020 to $404 million in March 2023. The company's operating income has taken a hit due to increased SG&A costs, which impacted its EBITDA generation and thus increased its debt-to-EBITDA ratio. Over the years, the company has shown high variability in its operating margins, impacting its EBITDA. Its annual operating margins averaged 9.4% with a standard deviation of 3.6%.
Exhibit 7:
Flowserve Debt and Q/Q Change in Debt (%) (Seeking Alpha, Author Compilation)
Exhibit 8:
Flowserve Debt-to-EBITDA Ratio, and Return on Invested Capital (Seeking Alpha)
Valuation
The interest rate increases by central banks globally have increased the cost of capital for companies. Flowserve has work to do to improve its return on invested capital. It generated a 6% return on invested capital in 2022, and its returns have been well below the 10% over the past five years (Exhibit 8) . Flowserve's capital cost is between 9% and 10% (source: Author's estimate) . The company does not generate any excess return compared to its capital costs.
The company trades at a premium, given the vast margin variability. The company trades at a forward GAAP PE of 21x compared to the sector median of 17.7x. It trades at a discount to its five-year average forward GAAP PE of 27.9x. When viewed from the perspective of the PEG ratio, the stock trades at a discount. Its PEF ratio is 0.14x. The company's forward GAAP EV to EBITDA multiple is 12x compared to the sector median of 10.4x.
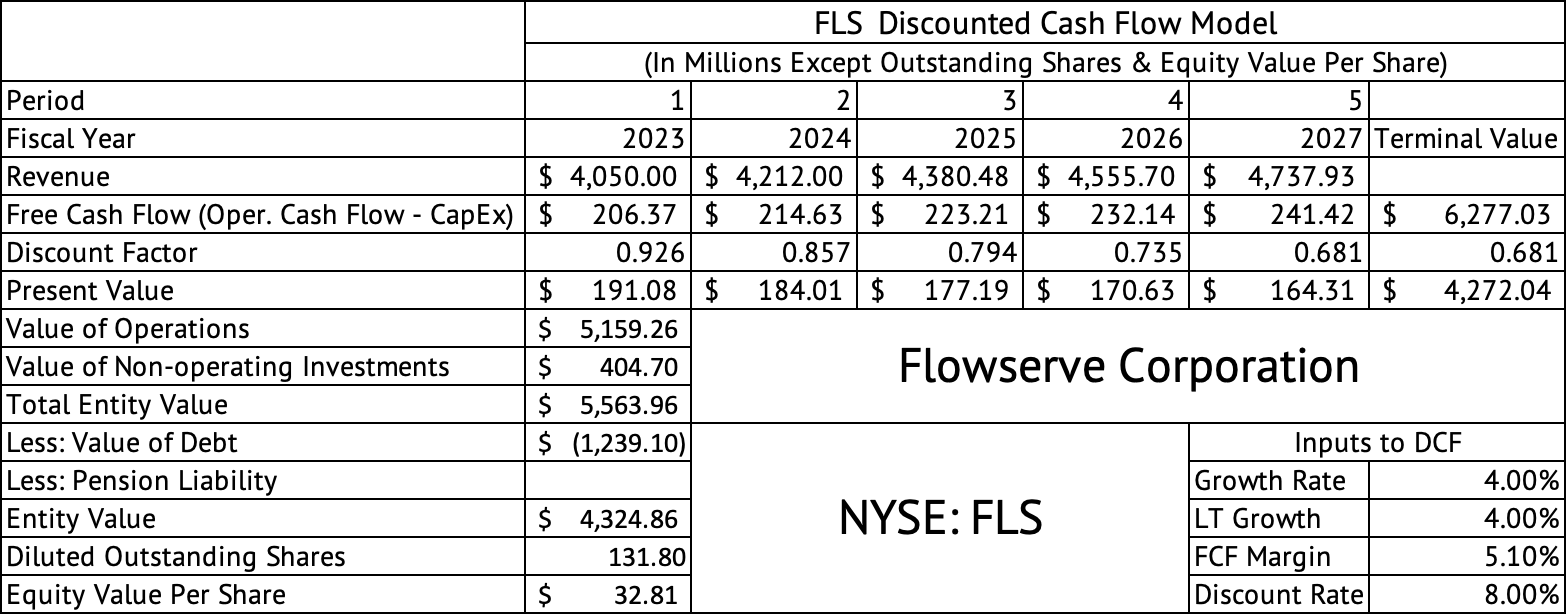
A discounted cash flow model estimates a per-share equity value of $32; the stock trades at $33.97 (Exhibit 9) . This model assumes a growth rate of 4%, a free cash flow margin of 5.1%, and a discount rate of 8%. The company had a free cash flow margin of 6.3% in 2019, the pre-pandemic year. If the company can consistently achieve a 6.3% margin, the per-share equity value would jump to $42, a 31% increase in the company's value for a 120 basis point increase in free cash flow margins. The short-term growth rate (the next five years) assumption of 4% might be low, but a long-term 4% growth rate assumption may be reasonable.
Exhibit 9:
Flowserve Discounted Cashflow Model (Seeking Alpha, Author Compilation. )
The 8% discount rate may be a liberal assumption in this model. Given the uncertainty in the company's cash flows, the company's cost of capital is probably higher than 8%, especially given the current rate environment.
Dividend
The stock yields 2.3% , a low yield compared to the 2-year U.S. Treasury yield of 4.5% (US2Y). The company has grown its dividend at a 1% CAGR over the past five years. The dividend payout ratio is 56%, and the company has paid dividends for 14 consecutive years. Given the company's cash flow uncertainty and low dividend growth rate, investors should consider investing only when the yield crosses 3%. The company paid $104 million in dividends in 2022. Its total dividend payment has increased from $76.9 million in 2013 to $104.7 million in the trailing twelve months. The company's diluted outstanding shares have been rising despite spending $34.9 million on share buybacks since September 2020. The diluted share count has gone from 130.9 million in September 2020 to 131.8 million in March 2023. The increasing share count may be another reason behind the lackluster growth in the company's dividend.
Flowserve's inconsistent cash flow generation may be a reason for new investors only to buy the stock once it pulls back to a more reasonable valuation. The company has struggled to grow its dividend giving investors another reason to wait for a much higher yield than the current 2.3%. Existing investors with higher yield-on-cost may continue holding the stock. The stock may have to drop to $26 before it would yield 3%. Coincidentally the stock's 52-week low is $23.89, close to the $26 target.
For further details see:
Flowserve Needs Margin Stability