FLRN - FLRN: Equity-Like Returns Without The Same Risks
2023-10-03 21:32:58 ET
Summary
- Portfolio managers and investors are seeking alternatives to the traditional 60/40 portfolio due to more stock-bond correlations and abysmal performance in 2022.
- Floating rate debt offers less risk than equities, with equity-like returns and lacks duration risk.
- Investors and portfolio managers should consider replacing their equity allocation with floating-rate debt.
Introduction
With traditional correlations breaking, over the last few years portfolio managers have been looking for alternatives to both equities and bonds. 2022 was the worst year for the 60/40 portfolio since 1937 .
Many portfolio managers are worried about owing equities due to their high valuation and economic uncertainty. On the other hand, they don't want to own bonds due to duration risk. Other instruments like junk bonds which have equity-like returns with less duration risk come with significant credit spread widening risk.
Most portfolio managers want an instrument that offers less risk than equities with equity-like returns with a lack of duration risk. Neither equities nor traditional fixed income can achieve this. One of the "alternative investment vehicles" that I believe more portfolio managers will look at is floating rate debt.
The easiest way for retail investors to get access to floating-rate debt is through the Bloomberg Investment Grade Floating Rate ETF ( FLRN ).
Floating Rate Credit Returns Relative To Equity Returns
The first area I'd like to compare both investments is return expectations.
I'll start with equities since it's the benchmark for most investors and portfolio managers.
To get return expectations for the S&P 500 we have to make some assumptions. In this case, the big factor we don't know about is earnings, so we'll assume that it will stay the same.
If earnings are assumed to stay the same then to get the expected return of the S&P 500 we take the earnings yield and add inflation to it.
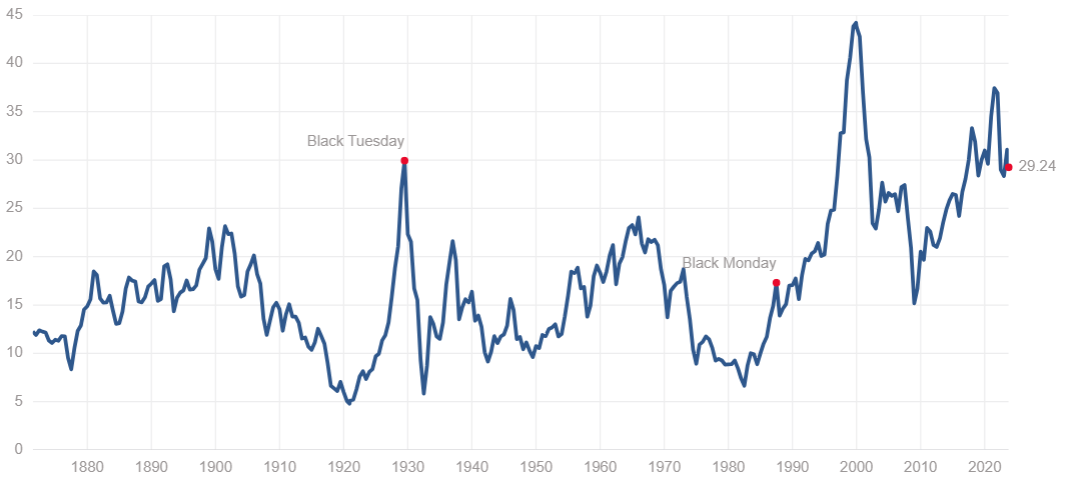
S&P 500 CAPE ratio:
Above is the CAPE ratio of the S&P 500. The CAPE ratio is derived by using the average of the last 10 years of earnings and adjusting it for inflation.
To get the earnings yield from this we would take the inverse. 100/29.24=3.42 (rounded). This means that the S&P 500 earnings yield is 3.42%; since companies can raise prices over time we add the expected inflation rate to this:
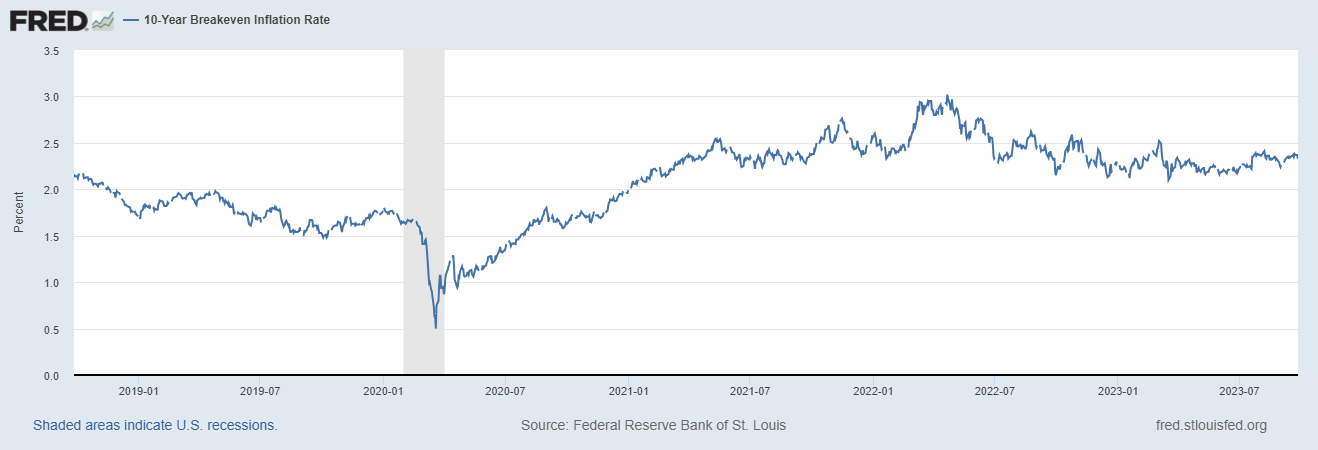
The 10-year breakeven is at 2.33. If we go shorter in duration to the 5-year or longer in duration to the 30-year they are all pricing in similar inflation expectations.
This makes for an expected CAGR on the S&P 500 (assuming earnings continue to stay the same) of 5.75% over the next 10 years.
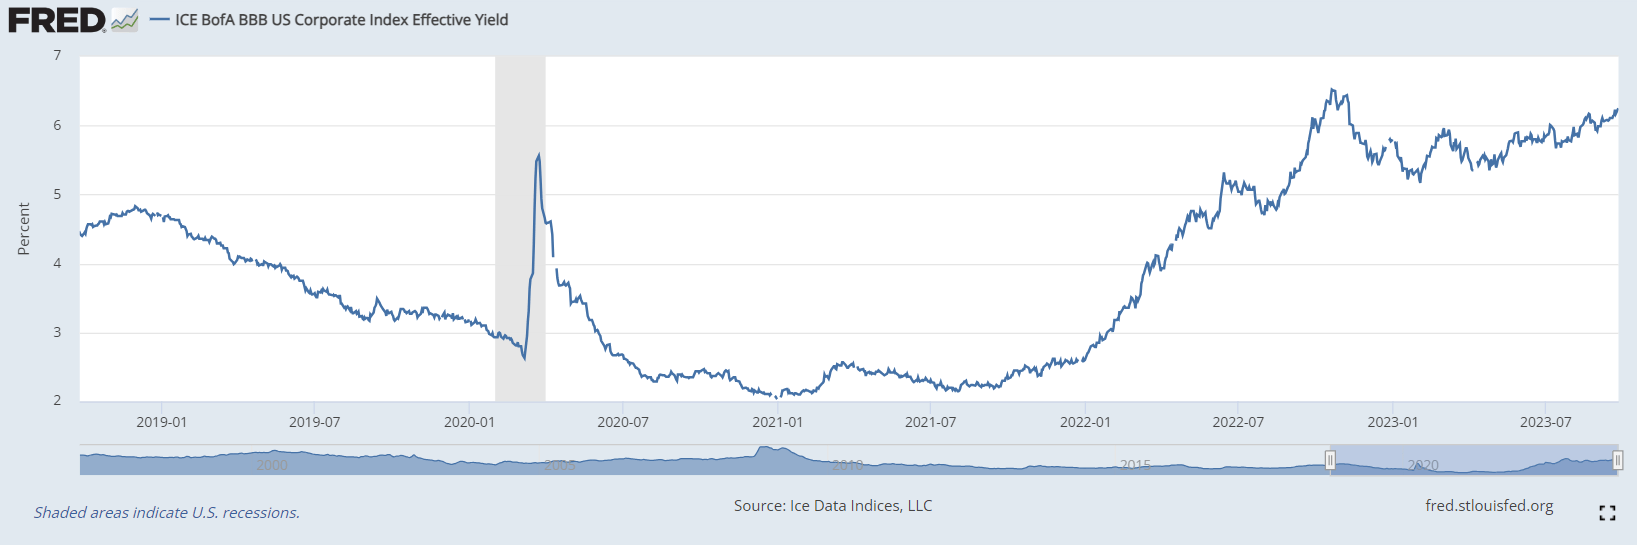
Since FLRN is an investment-grade bond ETF we can look at the ICE BofA BBB US Corporate Index Effective Yield, which will give us an average of what the investment-grade market is yielding right now:
The index currently has a yield of 6.26%.
This means that right off the bat the expected return for investment-grade debt is higher than for the S&P 500.
Risks Comparison
Both equities and investment-grade debt have risk, but investment-grade debt comes with less risk.
The first very obvious point is that investment-grade debt has a higher position on the capital stack. Companies will always pay their debt payments before returning capital to shareholders or doing CAPEX.
The second risk with equities is duration risk. As interest rates go up equities should be valued at a lower earnings multiple. FLRN being a floating rate doesn't have this risk.
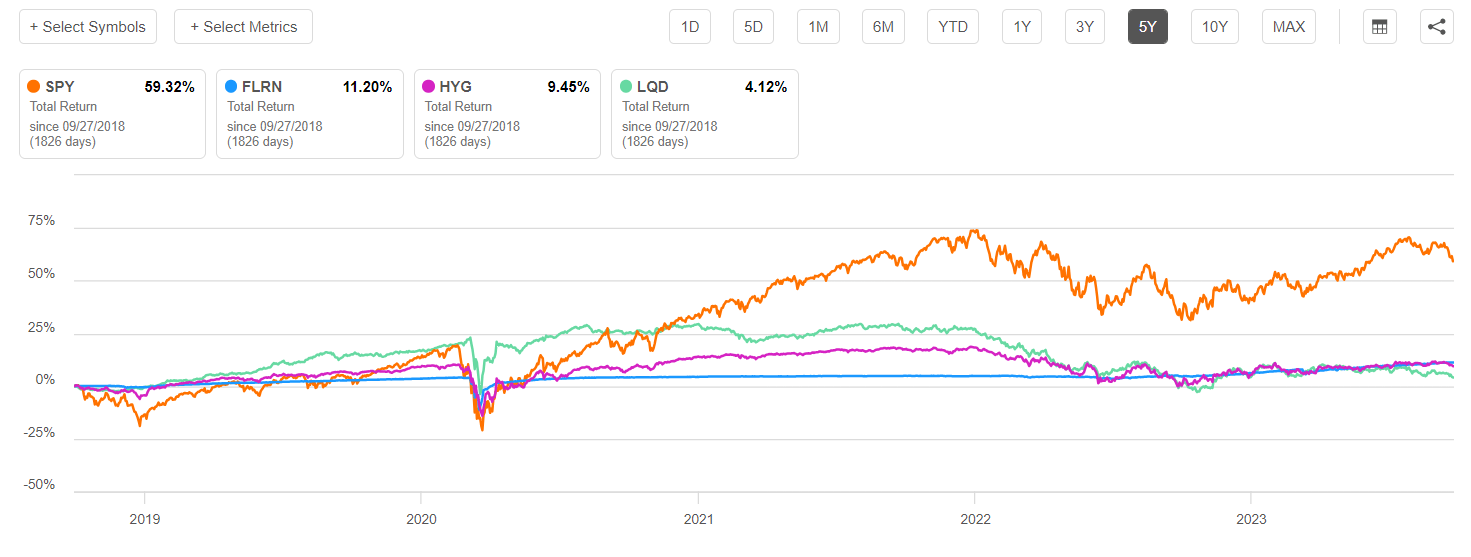
When it comes to volatility FLRN has lower volatility than SPY, LQD, and HYG:
And in 2022 FLRN traded as a cash equivalent:
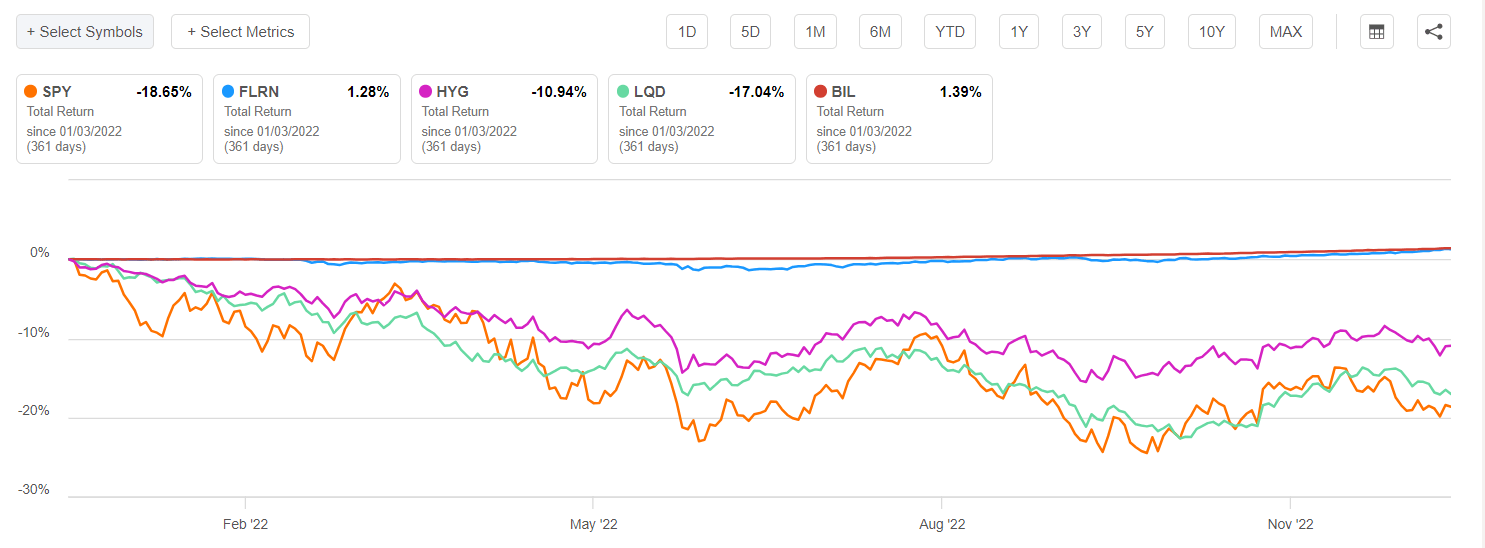
The above chart has the total returns of SPY, LQD, HYG, FLRN, and BIL in 2022.
BIL is an ETF that holds T-bills and its total return distribution is close to zero, as it is a cash equivalent. As seen in the above chart, the total return of FLRN was a lot more closely correlated with T-bills than any of the other assets.
All in all, FLRN has significantly lower risk, volatility, and return distribution than the S&P 500.
The Impact Of Interest Rates On Relative Returns
With all else being equal our quick back-of-the-napkin math shows that FLRN has a higher expected rate of return with lower risk, volatility, and return distribution compared to the S&P 500.
A piece of pushback I get when I say that portfolio managers should replace FLRN or another investment-grade floating-rate instrument with equities is that interest rates might go lower.
Usually, those giving pushback say that interest rates could go back down to the point where FLRN would make a lower return than the S&P 500. While theoretically, this is possible, I find the chance of rates going lower while having no recession to be low.
To understand why I say this we would need to look at the stock-bond correlation since 1890 compared to inflation:
Bogle Heads
What we see here is that when there is high inflation stocks and bonds are highly correlated.
This is because rather than counterweights, stocks and bonds become competition. For example, if a treasury had an interest rate of zero then a 5% return in the S&P 500 would be considered acceptable, but if the interest rate on treasuries went up to 6% then the equity market would need to go down to get a higher rate of return. In essence, high inflation periods create competition between stocks and bonds.
Below is a chart of Fed Funds:
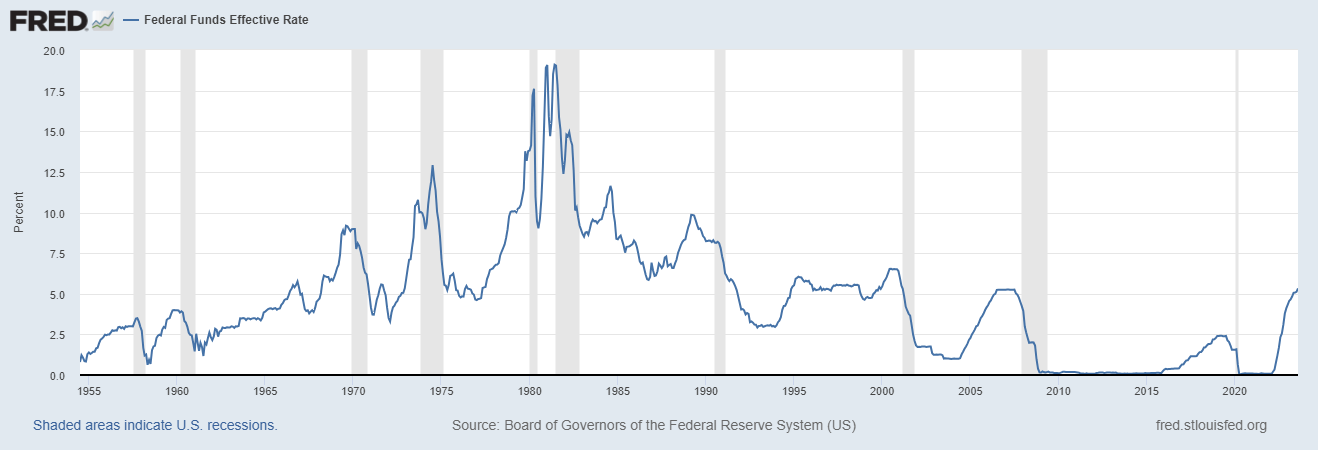
What can be seen on the above chart is that the only time interest rates have significantly gone down while in (or exiting) a high inflation environment, is when there has been a recession.
So if rates do go back down to zero it will likely be because the US is in a deep recession and disinflation, which would cause the stock-bond correlation to flip to negative once again; in that scenario, bonds would go up due to lower rates and a flight to safety while stocks would go down due to economic uncertainty and disinflation.
On the other hand, inflation could continue to stay sticky and we could see more rate hikes than what the market is pricing in, which would be a boost to total returns for floating rate instruments like FLRN while putting more downward pressure on both equities and traditional fixed-income.
Credit Risk
The only major risk in buying FLRN is credit risk. BBB is considered the lowest end of investment-grade debt with Barclays Bank saying that historically defaults have only been 0.3%:
Repayment of capital and coupon is the primary concern for buy-and-hold investors. So the probability of default is crucial. Investment grade default rates seem relatively contained. At 0.1% in July, the 12 months-trailing default rate in BBB-rated bonds compares with the 0.3% average default rate over the last 99 years. By contrast, the rate for US high-yield bonds is 3% (ten times higher).
Importantly, even the credit crisis in 2008 did not push default rates within the BBB segment, in a 5-year rolling period, over 2.5%. Additionally, during the 1987 crisis, the rate peaked at 5%. So while default rates look set to rise, they still seem manageable.
With a 2.5%, 5-year rolling default rate in 2008, if we wanted to put a total return figure on that we can take a look at historical total returns of investment-grade debt relative to other asset classes in 2008. The NYU Stern School of Business has put together a comparison of the historical total return of the S&P 500, treasury bonds, T-bills, and investment-grade debt on a yearly basis. Below are the total returns of the four assets in 2008:
S&P 500: -36.55%
T-bills: 1.37%
Treasury bonds: 20.1%
Investment grade debt: -5.07%
Investment grade debt was down in 2008 but weathered the storm a lot better than equities. If we see a recession in 2024 or 2025 we can likely expect something similar.
Key Takeaways:
- With stock-bond correlations positive for the first time in decades due to higher rates, alternatives like a floating-rate debt, whose total returns are positively correlated to higher rates, look more attractive.
- The expected returns for floating-rate debt are higher than equities with less risk, volatility, and return distribution.
- The price of floating-rate debt has no correlation to interest rates, so it removes the tail risk of rates going a lot higher or lower than expected.
- The only major risk to investment-grade floating-rate debt is credit risk.
- Investors and portfolio managers should consider replacing their equity allocation with a significant allocation to investment-grade floating-rate debt. FLRN is the most widely used ETF to get exposure to this asset class.
For further details see:
FLRN: Equity-Like Returns Without The Same Risks