SMLF - FNDA: Small-Cap ETF Beating The Benchmark But Not Some Competitors
2023-12-22 17:56:45 ET
Summary
- Schwab Fundamental U.S. Small Company Index ETF holds over 900 small caps, selected based on sales, cash flow, yield and buybacks.
- The FNDA ETF portfolio is well-diversified across sectors and holdings, but valuation and growth metrics are unattractive.
- FNDA beats the Russell 2000 index, but it has significantly lagged some competitors for 3 years.
FNDA strategy
Schwab Fundamental U.S. Small Company Index ETF ( FNDA ) started investing operations on 08/15/2013 and tracks the Russell RAFI™ US Small Company Index. The fund has 959 holdings, a distribution yield of 1.53% and a total expense ratio of 0.25%.
The starting universe is the FTSE Global Total Cap Index. As described in the prospectus by Charles Schwab Asset Management ,
The index selects, ranks, and weights securities by fundamental measures of company size – adjusted sales, retained operating cash flow, and dividends plus buybacks.
The portfolio is split in four segments, which are reconstituted separately on an annual basis in four quarterly partial reconstitutions. The portfolio turnover rate was 24% in the most recent fiscal year.
The 4 th factor of the strategy (“dividends plus buybacks”) is quite unusual in ETF descriptions and it looks a lot like shareholder yield, although the shareholder yield theoretically also includes debt reduction. Cambria Shareholder Yield ETF ( SYLD ), reviewed here , implements a strategy based on this factor in a larger universe including large and mid-cap companies.
In this article, the small cap fund iShares Russell 2000 ETF ( IWM ) will be used as a benchmark.
FNDA portfolio
The heaviest sectors in the portfolio are industrials (20.5%), financials (15.8%) and consumer discretionary (15.5%). Compared to the Russell 2000, the fund massively underweights healthcare, and to a lesser extent technology and energy. It overweights mostly industrials, consumer discretionary, real estate and communication.
Sector breakdown (Chart: author; data: Schwab, iShares)
The top 10 holdings, listed below with their weights and valuation ratios, represent only 3.1% of asset value. None of them weighs more than 0.5%, so risks related to individual companies are very low.
| Ticker |
| Name |
| Weight |
| P/E ttm |
| P/E fwd |
| P/Sales |
| P/Book |
| P/FCF |
| Yield% |
| Diversified Healthcare Trust |
| 0.45 |
| N/A |
| 0.61 |
| 0.35 |
| N/A |
| 1.12 |
| 3.86 |
| Abercrombie & Fitch Co. |
| 0.44 |
| 16.28 |
| 1.22 |
| 5.66 |
| 10.30 |
| 0 |
| 2.99 |
| XPO, Inc. |
| 0.29 |
| 32.05 |
| 1.39 |
| 8.88 |
| N/A |
| 0 |
| 1.28 |
| TopBuild Corp. |
| 0.29 |
| 19.07 |
| 2.31 |
| 4.95 |
| 17.54 |
| 0 |
| 0.05 |
| Macerich Co. |
| 0.29 |
| N/A |
| 3.86 |
| 1.38 |
| 13.97 |
| 4.35 |
| 0.42 |
| American Eagle Outfitters, Inc. |
| 0.28 |
| 15.65 |
| 0.82 |
| 2.40 |
| 7.98 |
| 2.38 |
| 1.94 |
| G-III Apparel Group Ltd. |
| 0.27 |
| 8.53 |
| 0.49 |
| 1.04 |
| 3.05 |
| 0 |
| 2.73 |
| Fair Isaac Corp. |
| 0.27 |
| 49.46 |
| 19.46 |
| N/A |
| 63.39 |
| 0 |
| 1.85 |
| Super Micro Computer, Inc. |
| 0.27 |
| 17.41 |
| 2.35 |
| 8.03 |
| 29.39 |
| 0 |
| 1.44 |
| Signet Jewelers Ltd. |
| 0.27 |
| 10.36 |
| 0.64 |
| 2.99 |
| 8.68 |
| 0.89 |
| 1.46 |
Ratios: Portfolio123.
FNDA is slightly cheaper than the Russell 2000 in price/book, price/sales and price/ cash flow ratios. However, the price/earnings is higher and growth metrics are significantly inferior to the benchmark, as reported in the next table. In aggregate, FNDA is not really attractive regarding the usual fundamental metrics.
| FNDA |
| IWM |
| Price / Earnings TTM |
| 14.72 |
| 13.03 |
| Price / Book |
| 1.51 |
| 1.74 |
| Price / Sales |
| 0.82 |
| 1.09 |
| Price / Cash Flow |
| 7.61 |
| 8.03 |
| Earnings growth |
| 16.81% |
| 20.78% |
| Sales growth |
| 2.15% |
| 10.88% |
| Cash flow growth |
| -6.67% |
| 2.62% |
Source: Fidelity.
Performance
Since inception in August 2013, FNDA has outperformed the Russell 2000 by 49 bps in annualized return, as reported in the next table. The risk measured in drawdown and volatility is a bit higher, but the fund still is ahead of the benchmark in risk-adjusted performance (Sharpe ratio).
| Total Return |
| Annual Return |
| Drawdown |
| Sharpe ratio |
| Volatility |
| FNDA |
| 157.17% |
| 9.57% |
| -44.64% |
| 0.46 |
| 20.05% |
| IWN |
| 123.26% |
| 8.08% |
| -41.13% |
| 0.39 |
| 19.81% |
Data calculated with Portfolio123.
FNDA beats the Russell 2000 by about 3% in 2023 to date:
FNDA vs competitors
The next table compares characteristics of FNDA and 5 other small cap ETFs focused on fundamentals:
- Vanguard Small Cap Value ETF ( VBR )
- Avantis U.S. Small Cap Value ETF ( AVUV )
- Pacer US Small Cap Cash Cows 100 ETF ( CALF )
- iShares U.S. Small-Cap Equity Factor ETF ( SMLF )
- ALPS O'Shares US Small-Cap Quality Dividend ETF ( OUSM ).
| FNDA |
| VBR |
| AVUV |
| CALF |
| SMLF |
| OUSM |
| Inception |
| 8/15/2013 |
| 1/26/2004 |
| 9/24/2019 |
| 6/16/2017 |
| 4/28/2015 |
| 12/30/2016 |
| Expense Ratio |
| 0.25% |
| 0.07% |
| 0.25% |
| 0.59% |
| 0.15% |
| 0.48% |
| AUM |
| $7.67B |
| $47.54B |
| $8.79B |
| $6.26B |
| $841.71M |
| $441.74M |
| Avg Daily Volume |
| $20.65M |
| $97.16M |
| $57.04M |
| $73.43M |
| $2.45M |
| $2.59M |
| Holdings |
| 960 |
| 838 |
| 746 |
| 103 |
| 801 |
| 109 |
| Top 10 |
| 3.11% |
| 5.77% |
| 8.62% |
| 20.24% |
| 5.78% |
| 20.79% |
The two value funds have different approaches: VBR tracks the CRSP U.S. Small Cap Value Index, whereas AVUV is actively managed, combining value and profitability characteristics. CALF selects stocks with high cash flow yields in the S&P Small Cap 600 index. SMLF combines value, quality, momentum and low size. OUSM strategy is based on 4 factors: quality, low volatility, dividend yield and dividend quality.
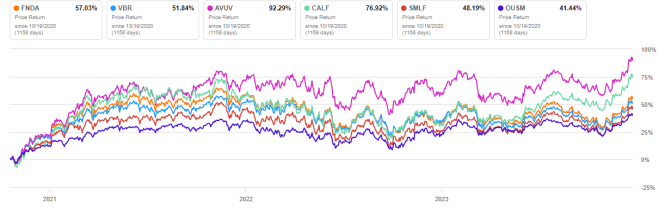
In this list, FNDA is the third largest fund in assets under management, and ranked 4 th regarding liquidity measured in dollar volume. It has the most diversified portfolio. The next chart plots total returns, starting on 10/19/2020 to match all inception dates. FNDA is in the middle of the pack, far behind AVUV and CALF.
FNDA vs. Competitors, total return since 10/19/2020 (Seeking Alpha)
Takeaway
Schwab Fundamental U.S. Small Company Index ETF is invested in over 900 small caps companies, mostly selected based on sales, cash flow and shareholder yield. The portfolio is well-diversified across sectors and holdings. Valuation and growth metrics are unattractive, but FNDA has outperformed the small cap benchmark Russell 2000 since inception in 2013, and in 2023. In the last 3 years, it has lagged the actively managed value fund AVUV and the cash-flow focused fund CALF. In conclusion, FNDA strategy makes sense, it beats the benchmark, but it has been unable to show an edge over some competitors until now.
For further details see:
FNDA: Small-Cap ETF Beating The Benchmark, But Not Some Competitors