FNDX - FNDX: Tactical Exposure To High-Beta Large Cap Equally Sported On The Strategic Side
2023-11-04 06:00:00 ET
Summary
- The case for strategically allocating to equities in the New Year is supported by key macroeconomic and fundamental catalysts.
- The Schwab Fundamental U.S. Large Company Index ETF (FNDX) is a high-beta option for investors seeking large-cap exposure.
- U.S. corporate fundamentals remain resilient, with positive earnings growth and projections for the next 1-3 years, supporting the potential for capital appreciation over this duration.
Investment brief
The case for strategically allocating to equities as we roll into the New Year has been bolstered by a set of key macroeconomic and fundamental catalysts. For one, the Federal Reserve's decision to pause its hiking cycle for the 2nd consecutive FOMC meeting has seen investors lift the bid on key US equity benchmarks. Second, with a sharp pullback in equity values across the broad selection of markets, valuations and entry points are more compelling than what we've seen in the last 2 years. Three, the technicals of various instruments are starting to improve, particularly on the momentum side, with short-term momentum showing initial signs of a reversal off October low points.
Critically, the broad indices have been propped up by a concentrated few stocks this year, posing a concentration risk to investor portfolios, especially for those holding market-based ETFs. Stripping out the "magnificent 7" companies, stocks have actually performed this year on aggregate. However, there appears to be a large influx of demand for risk assets in the back end of 2023. As such, in my opinion, investors should be looking towards strategic allocations to equities, and diversified large-cap exposure on the tactical side.
For investors following this kind of strategy, the Schwab Fundamental U.S. Large Company Index ETF (NYSEARCA: FNDX ) is one offering that immediately springs to the front of the page.
The fund tracks the Russell RAFI US Large Company Index using a full replication method that aims to invest 90% of assets within this benchmark. Critically, the fund has a tracking error of around 6—7% from this watermark, with annualized volatility of ~14%, placing it in the 90th percentile of the fund universe.
FNDX has $11.5Bn in AUM, and charges a 25bps expense fee on these assets. Dividends , which are paid quarterly, currently yield 2% as I write, on a trailing payout of $1.11. What is most attractive about the fund (in my view) is that it has a reasonably broad sector exposure that still keeps the high beta segment of the market the most concentrated section of the portfolio. Tech is weighted at 18.5% of total holdings, whereas the advisor also has 17.2% and 11.9%, weighting to financials and healthcare, respectively. The top 10 holdings make up around 21% of the total weight, and it has allocations across 730 securities.
In my view, this is an attractive setup in the current market, where high beta names could rally leading into the New Year, given what we've seen in the market's reaction since the Fed's latest moves.
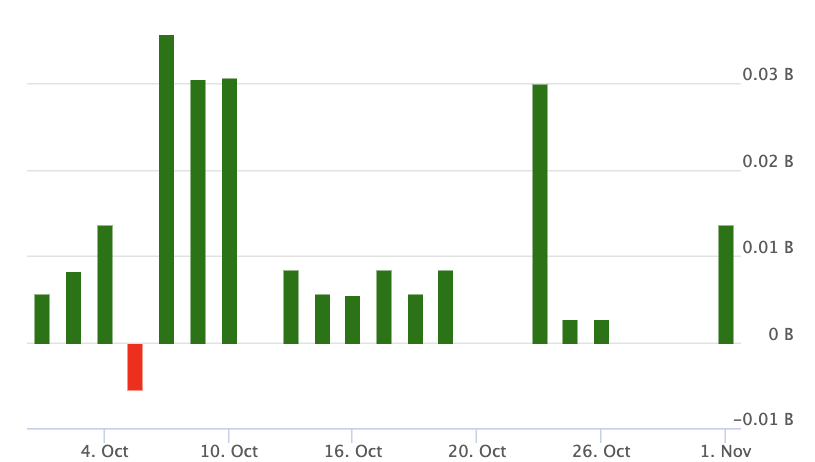
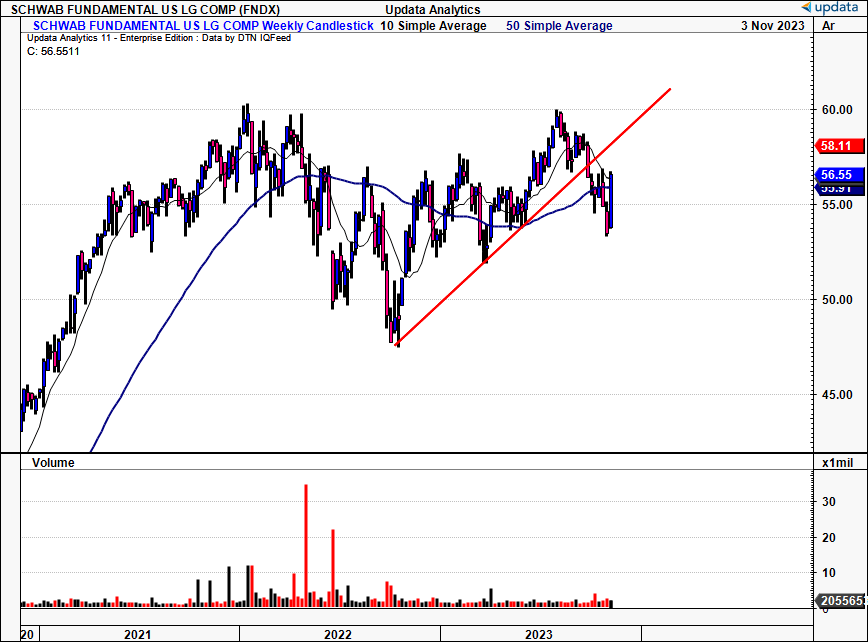
Like the majority of its large-cap peers, FNDX had crossed its 50DMA and 200DMA in the last few weeks. However, with its most recent price action, investors have piled into the fund and brought it back to its long-term trading range. In fact, the fund has not really seen an extensive period of net outflows over the last 12 months, and November has proven to be an average period of inflows.
Figure 1. FNDX net fund flows last 12 months
As such my recommendations over, the three investment horizons are as follows:
Fundamental—
- Short term (coming, 12 months) – bullish ; starting valuations are attractive at 13.5x earnings, below large-cap peers and below the broad S&P 500 index. Therefore coming 12-month returns are attractive and have scope for a reversion higher. Allocations on any weakness are supported, and there is scope to size up longs to increase money-weighted returns over this duration.
- Medium term (1–3 years) - bullish; Q3 earnings growth and forward projections came in well ahead of consensus expectations, particularly in sectors where FNDX is heavily weighted. allocations on any pullbacks are supported, and appreciation over the next 1—3 years is also supported based on the robust fundamentals.
- Long-term (3 years+) — The US economy still presents with the most compelling reward potential based on the trio of 1) GDP, revisions, and forecasts, 2) company, balance sheet and fundamentals; and 3) strength of the domestic markets. Allocations over the long term are still supported.
Technicals—
- Bullish on all time horizons, with medium-term turning far more constructive as I write.
Net-net, I rate FNDX a buy long-term value for the reasons raised in this analysis.
Figure 1a. FNDX long-term price evolution, crossing back above 50DMA and 200DMA.
Talking points
- Corporate fundamentals resilient despite tightening financial conditions
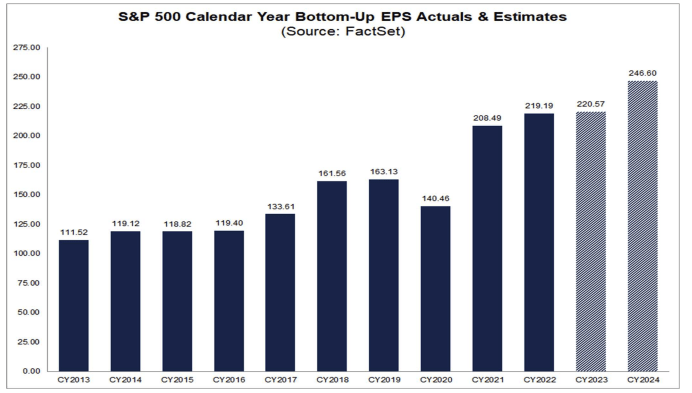
Third-quarter earnings season proved to be an economic surprise for most strategists and managers. A total of 8 out of 11 sectors reported YoY earnings growth. This was headed up by communication services, consumer discretionary, financials, and technology. Critically, for FNDX, financials saw its largest increase in earnings since September 30, according to FactSet's analysis of the quarter. In fact, financials reported the "third-largest positive (aggregate) difference between actual earnings and estimated earnings", per FactSet.
Moreover, 77% of financials, 73% of communication services, and a large chunk of technology names scored the highest percentages of names that reported above consensus revenues. In addition, tech and communication services reported the highest percent of names with above-consensus earnings, with 95% and 91% of each domain beating estimates, respectively.
Moving forward, projections are equally as strong. Markets have already efficiently priced in the prospects of better business in the coming 2 years via its discounting mechanism. This lays the bedrock for a period of robust capital gains out until 2024/'25.
Figure 2.
- FNDX fundamentals add weight to next 12 months returns
In addition to the positive earnings growth projected in the coming 2—3 years, FNDX's fundamentals, support its potential in the coming 12 months as well.
The fund trades at 13.5x earnings, within one standard deviation of the category average, but still ahead of FactSet's segment average of 5.6x earnings. In my opinion, the latter multiple is overly compressed and only offers a statistical discount, and perhaps not so much compelling value. This is critical, as forward 12 months' returns are heavily impacted by starting valuations, which in this case are below FNDX's large-cap peers and below the S&P 500 index on aggregate. This would appear to be a function of the diversified weighting of the fund.
The other factor being hotly debated right now is allocation to US or non-US equities, with the latter offering a compelling risk /reward scenario as well. In fact, those at Goldman Sachs ( GS ) recently illustrated that since the "post-pandemic cycle", European stocks have performed the US counterparts on an annualized EPS basis, as seen in Figure 3. Crucially, however, this trend is projected to change over the coming 2 years which, in combination with the low starting multiples FNDX sells at today, support the notion of a strong period of capital appreciation in the next year. Therefore 1) the case for large-cap equities, 2) US strategic allocation, and 3) for growth over a 12-month to 3-year horizon are well supported within the data. This is a bullish signal for FNDX in my view.
Figure 3.
Source: Goldman Sachs
Technical considerations
1. Regarding momentum
We have two critical factors which are exhibiting positive signs for the fund's momentum in the coming weeks to months.
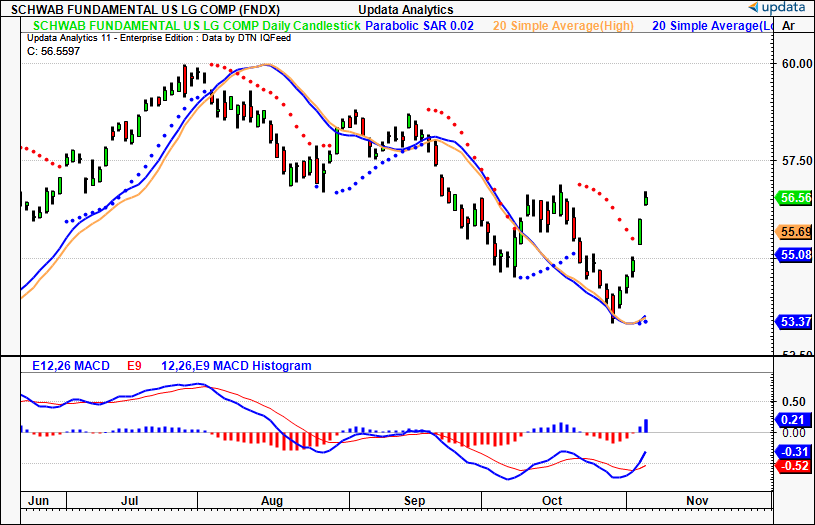
One, we have seen a bull cross of the MACD leading into November, coinciding with a relief rally in broad equity markets. FNDX has gapped higher on 2 occasions in the last week, retaking levels in the process.
Two, the price line has also crossed the 20 DMA highs and lows, suggesting that, on average, we could expect to see a period of higher highs and higher lows. This is definitely one to consider leading into the final stages of the year.
Figure 4.
2. Skew, directional bias of price distribution
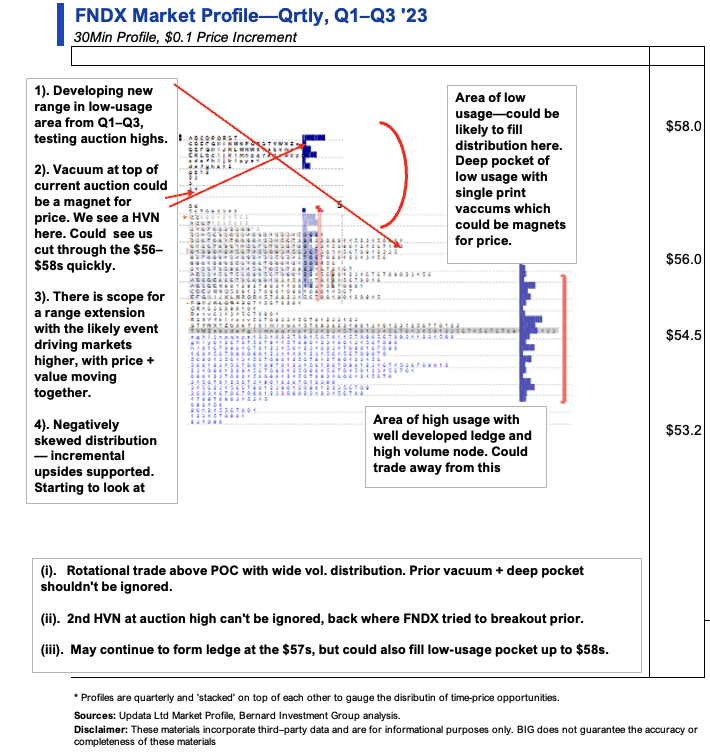
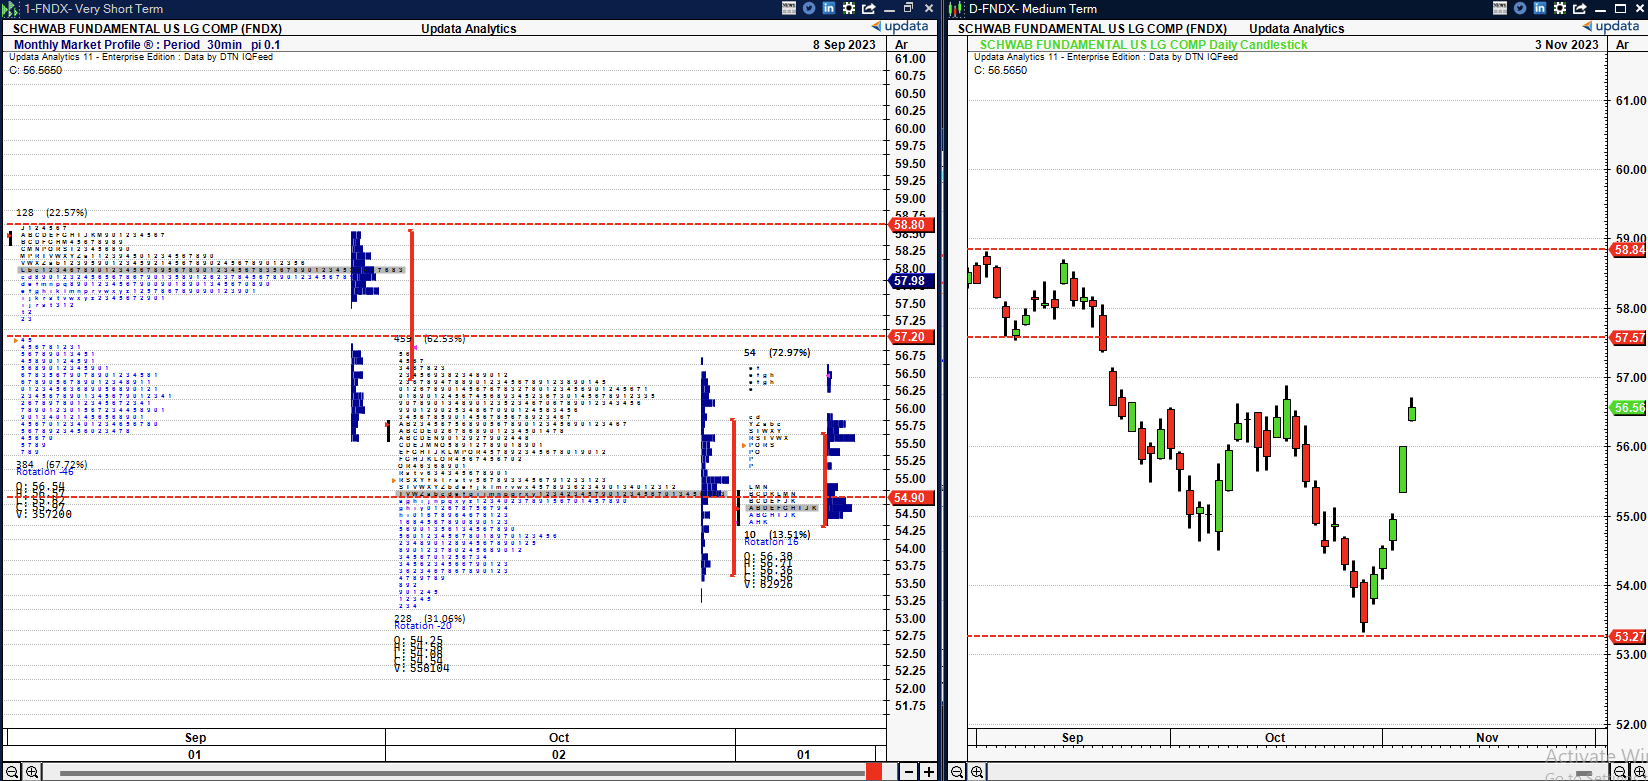
- Observations: Q3 was a broad distribution of price usage after a fairly narrow profile in the prior quarter. Critically we are developing a new range in the low usage area from Q1—Q3, where FNDX tested the auction highs of this period (Figure 5). Further, the single-print vacuum in the current low-usage pocket could be a magnet price at the $56–$57s. We see a high volume note forming here from the previous quarter. This could see us cut through the $56-$58s zone fairly quickly if investors continue lifting the bid (Figure 6). We are also forming a ledge around the $55-$56 mark, aiming to fill out the lower distribution in the process. Markets tend to move from areas of high usage to low usage, and with the negative skew of the distribution, this supports the notion of small incremental price gains, testing the auction highs of the prior month and filling the deep pocket within the single print vacuum. If prices continue to rally, there is scope for a range extension above the $58s. In my opinion, we could even begin to fill out the underdeveloped ledge at the top of the auction, which is also a high volume node itself.
- Key levels: the curve looks to be nearly completed and this is gearing up for a directional view. We may continue to rotate between the auction high and the current POC, but with such a wide value area, in my opinion, the pocket of low usage between $56-$58 might be the new range. Look for prices to cut through this area quickly within the next weeks months. On the downside, a break below $54 would be remarkable, and I would support longs beneath this level.
- Actionable strategy: Range trade is still supported until we have a full confirmation of the breakout. However, given the combination of 1) the nearly completed lower distribution from Q3, 2) the single print vacuums in the low pocket of usage above $57, and 3) the high volume node in the $58s, positioning for a directional view is warranted in my opinion. Once the bell curve is completed at the mid-$50s, this would be the time to look directionally.
Figure 5.
Figure 6.
3. Directional bias on trends going forward
Trend action is turning far more constructive for FNDX across all three horizons.
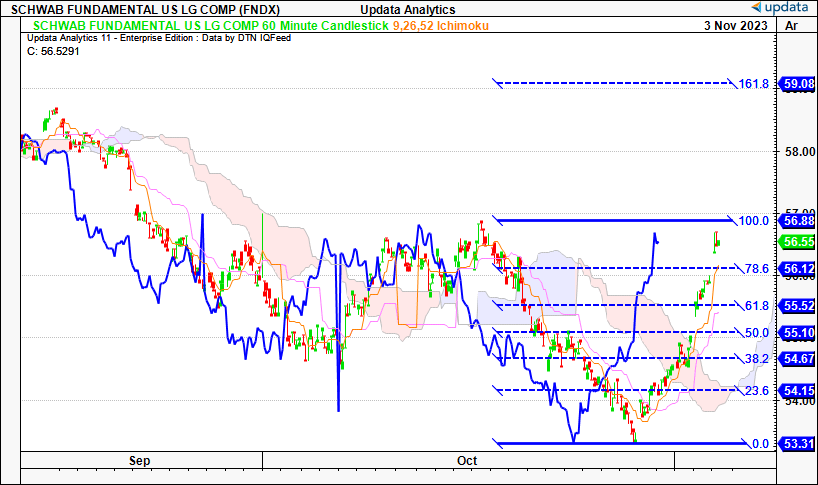
Figure 7 . Short-term (60-minute chart, looking to coming days)—
Observations:
- We have already retaken around 100% of the October selloff, following the bounce leading into November.
- Bullish cross above the cloud with strong cloud support well into November. The lagging line has crossed as well, giving the bullish signal.
- If it does cross the 100% retracement, which it does look like doing, we would be looking to retake the gap down in September.
Key levels:
- Next level is above $57, then we would be looking to $59 on the upside, which would retake the September high.
- On the downside, we would look to $55 high and low, and a break below $54 would put us back beneath the cloud.
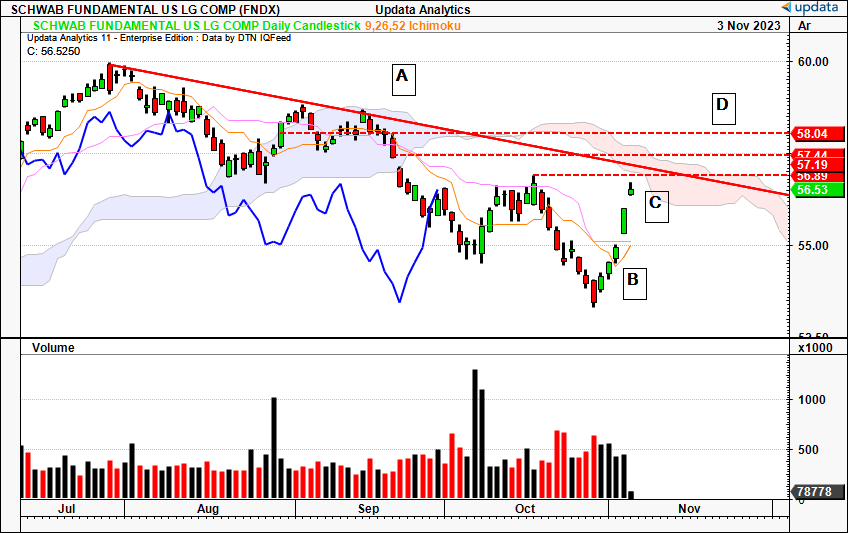
Figure 8. Medium-term (daily chart, looking to the coming weeks)—
Observations:
- We had completed a 3 waves-down move by the end of October, and the reversal of this low is abundantly clear. The trendline at A serves as long-term resistance on this frame, and with the 2x gaps higher in the last week or so we have converged this level with authority.
- The piercing formation at B signals the reversal along with the momentum indicators from earlier, and we are now looking to the $57s as a critical zone at C.
- We haven't crossed the cloud yet. But, 3 things to consider. Prices have crossed the turning line and conversion line; both the turning line and conversion line also pointing north,; and we are in countertrend to the bearish cloud. I am turning far more constructive on this chart.
Key levels:
- Next key levels on the upside are through the $57s and then we would be above the cloud; we would then need to retake $58, which is the marabuzo from August. If we pierce this, we could look to $60 as an upside target.
- On the downside, anything below $55 could change the character of the market.
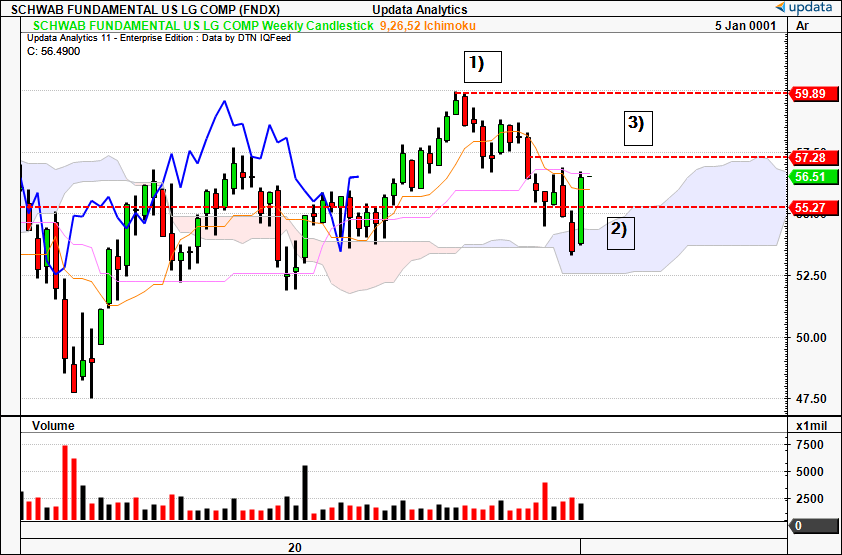
Figure 9. Long-term (weekly chart, looking to coming months)—
Observations:
- Top of the previous range is 1) and a bearish engulfing Candle characterized the counter trend in July. We then crossed into the cloud at 2), however, the buying thrust leading into November has seen a deep bullish candle which has taken out the last two weeks' range.
- We are now back in bullish territory and advancing towards the marabuzo line of October, which now corresponds with the top of the cloud across December.
- Constructive setup and with volume this could rally to new heights.
Key levels:
- Next level is the mid $57s as mentioned earlier, and this is the marabuzo line and the single print vacuum discussed in the talk on price distribution.
- If we cut through this region, we'd be looking to $60, and we would find support at the cloud at $57 all across December as mentioned.
- On the downside a cross back into the cloud at $54 would be remarkable.
Discussion Summary
In short, there are now a handful of catalysts that make the outlook on large-cap equities more appealing over the coming 12 months. Beyond this, fundamentals support a robust period of growth that diverges from the opinions of a hard landing in the US. Critically, for FNDX, this means its strategic allocations across tech, financials, and others could be a selective opportunity for investors seeking exposure to the larger end of town. The funds' starting multiples lay the bedrock for the next 12 months' returns, bolstered by the fundamentals mentioned earlier. Regarding fundamental bias, I am bullish across all time frames, and on the technicals and positioned the same. Net-net, I rate FNDX a buy on long-term value.
For further details see:
FNDX: Tactical Exposure To High-Beta Large Cap, Equally Sported On The Strategic Side