EFIV - For DSI Ethics Is Not A Drag
2023-11-30 16:24:24 ET
Summary
- iShares MSCI KLD 400 Social ETF invests with environmental, social, and corporate governance principles, or ESG.
- Valuation and growth metrics for the DSI ETF are underwhelming, but quality is above par. Past performance is similar to the S&P 500.
- Investors including ethical principles in their strategy may buy DSI without sacrificing performance, but keep in mind it is very heavy in technology.
DSI strategy
iShares MSCI KLD 400 Social ETF ( DSI ) is a passively managed exchange-traded fund, or ETF, launched on 11/14/2006 tracking the MSCI KLD 400 Social Index. It is designed for investors fostering an environmental, social, and corporate governance ("ESG") investing approach. It has a portfolio of 396 stocks, a 12-month trailing yield of 1.35% and a total expense ratio of 0.25%. Distributions are paid quarterly.
As described in the prospectus by iShares , the starting universe is the MSCI USA IMI Index. Then:
MSCI analyzes each eligible company ’ s ESG performance using proprietary ratings covering ESG criteria. When selecting companies for the Underlying Index, MSCI also considers market capitalization and liquidity. Companies that MSCI determines have significant involvement in the following businesses are not eligible for the Underlying Index: fossil fuel extraction, fossil fuel reserve , ownership, unconventional oil and gas extraction, thermal coal-based power generation, alcohol, tobacco, gambling, civilian firearms, nuclear power, controversial weapons, nuclear weapons, conventional weapons, adult entertainment and genetically modified organisms .
Constituents are weighted based on free float-adjusted market capitalization and the portfolio turnover rate in the most recent fiscal year was very low: only 4%.
DSI portfolio
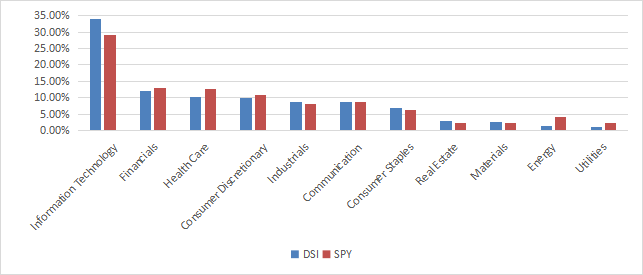
The fund is almost exclusively invested in U.S. companies (about 99% of asset value), mostly in large and mega-caps (79%). The sector breakdown is close to the S&P 500 Index (SP500), represented in the next chart by SPDR® S&P 500 ETF Trust ( SPY ). Compared to the large cap index, DSI moderately overweights technology (34.1% of assets), and mostly underweights energy, utilities, and to a lesser extent, healthcare.
DSI sector breakdown (chart: author; data: iShares, SSGA)
DSI is more expensive than the S&P 500 regarding valuations ratios and has inferior earnings growth and cash flow growth, as reported below.
| DSI |
| QQQ |
| Price/Earnings |
| 22.83 |
| 20.79 |
| Price/Book |
| 4.39 |
| 3.69 |
| Price/Sales |
| 2.54 |
| 2.38 |
| Price/Cash Flow |
| 15.66 |
| 14.73 |
| Earnings growth % |
| 12.92% |
| 17.50% |
| Cash flow growth % |
| 2.37% |
| 7.99% |
Source: Fidelity.
The next table lists the top 10 issuers with fundamental ratios. They represent 36.8% of assets. For convenience, the two share series of Alphabet Inc. (GOOGL) (GOOG) have been grouped. Microsoft weighs over 12%, Alphabet Inc and Nvidia are between 5% and 7%. Risks related to other individual companies are low.
| Ticker |
| Name |
| Weight% |
| EPS growth %TTM |
| P/E ttm |
| P/E fwd |
| Yield% |
| Microsoft Corp. |
| 12.21 |
| 11.28 |
| 36.69 |
| 33.73 |
| 0.79 |
| GOOGL, GOOG |
| Alphabet Inc. |
| 6.81 |
| 3.56 |
| 25.88 |
| 23.50 |
| 0 |
| NVIDIA Corp. |
| 5.28 |
| 222.20 |
| 63.56 |
| 39.86 |
| 0.03 |
| Tesla, Inc. |
| 3.27 |
| -4.04 |
| 78.62 |
| 79.43 |
| 0 |
| Visa Inc. |
| 1.94 |
| 19.04 |
| 31.19 |
| 25.71 |
| 0.82 |
| Procter & Gamble Co. |
| 1.68 |
| 6.63 |
| 24.57 |
| 23.50 |
| 2.49 |
| Mastercard Inc. |
| 1.64 |
| 14.67 |
| 35.70 |
| 33.69 |
| 0.56 |
| The Home Depot, Inc. |
| 1.46 |
| -6.08 |
| 19.96 |
| 20.64 |
| 2.69 |
| Adobe Inc. |
| 1.33 |
| 9.52 |
| 55.56 |
| 38.75 |
| 0 |
| Merck & Co., Inc. |
| 1.20 |
| -70.05 |
| 56.17 |
| 66.00 |
| 3.05 |
Quality
DSI currently holds about 400 stocks, which I have scanned for quality. In my ETF reviews, risky stocks are companies with at least 2 red flags among: bad Piotroski score, negative ROA, unsustainable payout ratio, bad or dubious Altman Z-score, excluding financials and real estate where these metrics are unreliable. Here, risky stocks weigh 8.7% asset value, which is a good point.
According to my calculation of aggregate metrics reported in the next table, the quality of the portfolio is significantly superior to the S&P 500. The aggregate return on assets is especially good.
| DSI |
| SPY |
| Altman Z-score |
| 7.92 |
| 3.53 |
| Piotroski F-score |
| 5.97 |
| 5.76 |
| ROA % TTM |
| 12.9 |
| 7.24 |
Historical performance
Since inception, the differences with SPY in performance and risk metrics are insignificant: 17 bps in annualized return, 1% in maximum drawdown and 0.3% in standard deviation of monthly return (named “volatility” in the next table).
| Total Return |
| Annual.Return |
| Drawdown |
| Sharpe ratio |
| Volatility |
| DSI |
| 337.47% |
| 9.06% |
| -54.23% |
| 0.52 |
| 16.11% |
| SPY |
| 349.35% |
| 9.23% |
| -55.19% |
| 0.54 |
| 15.81% |
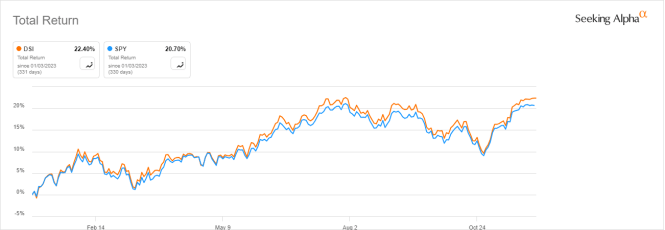
In 2023 to date, DSI has slightly outperformed the benchmark:
DSI vs. SPY, year-to-date (Seeking Alpha)
DSI vs. competitors
The next table compares characteristics of DSI and three ESG ETFs
- SPDR S&P 500 ESG ETF ( EFIV )
- iShares ESG Aware MSCI USA ETF ( ESG U)
- Nuveen ESG Mid-Cap Growth ETF ( NUMG ).
| DSI |
| EFIV |
| ESGU |
| NUMG |
| Inception |
| 11/14/2006 |
| 7/27/2020 |
| 12/1/2016 |
| 12/13/2016 |
| Expense Ratio |
| 0.25% |
| 0.10% |
| 0.15% |
| 0.31% |
| AUM |
| $3.92B |
| $1.06B |
| $12.68B |
| $427.20M |
| Average Daily Dollar Volume |
| $11.60M |
| $2.32M |
| $63.68M |
| $1.34M |
| Number of Holdings |
| 401 |
| 321 |
| 300 |
| 62 |
| Assets in Top 10 |
| 35.66% |
| 40.90% |
| 30.24% |
| 25.73% |
| Turnover |
| 4.00% |
| 12.00% |
| 25.00% |
| 84.00% |
DSI is the oldest fund in the list, and it takes the second position in size and liquidity. The expense ratio is reasonable, but above the two other large cap funds. It has the lowest turnover in this group.
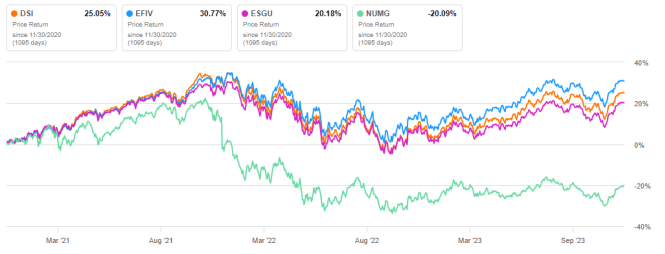
It is second to EFIV in 3-year total return, as reported on the next chart. The mid-cap fund NUMG has been lagging, mostly due to underperformance of this size segment during the period.
DSI vs. competitors, 3-year total returns (Seeking Alpha)
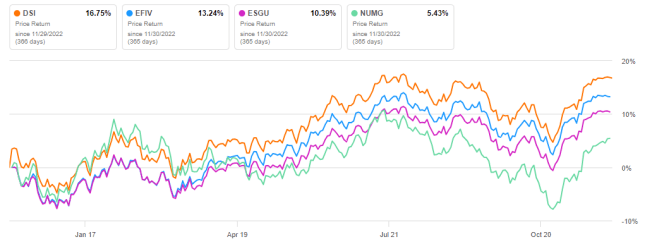
DSI is ahead of the pack on a 12-month time frame:
DSI vs. competitors, 12-month total returns (Seeking Alpha)
Takeaway
iShares MSCI KLD 400 Social ETF ((DSI)) implements an environmental, social, and corporate governance ("ESG") approach in a large cap universe. It is overweight in technology, and its sector breakdown is close to the S&P 500 index. Valuation and growth metrics are underwhelming, but quality is superior to the benchmark. Regarding performance, iShares MSCI KLD 400 Social ETF is almost on-par with the S&P 500 in performance and risk metrics since November 2006, and it has performed quite well relative to competitors recently.
In conclusion, it seems that investors including ethical principles in their strategy may buy DSI without sacrificing performance or taking more risks relative to a broad market fund. However, keep in mind it is very heavy in technology.
For further details see:
For DSI, Ethics Is Not A Drag