MID - Ford GM U.S. Steel Vs. S&P 500: A Look At Annual Returns And Returns On Invested Capital
2023-09-08 21:55:00 ET
Summary
- Ford’s annual return since 1990 was surprising, and wasn’t too far short of the S&P 500’s for the last 33 years.
- Looking at Morningstar financial data on US Steel, from 2013 to 2023, 4 of the last 10 years have seen substantial negative years of ROIC for the steel giant, with two of those years being a ROIC of greater than -20%.
- When U.S. Steel was recently put into play by Cleveland-Cliffs in the last month, the announcement popped X back above its June ’91 IPO price of $20 to $25 per share.
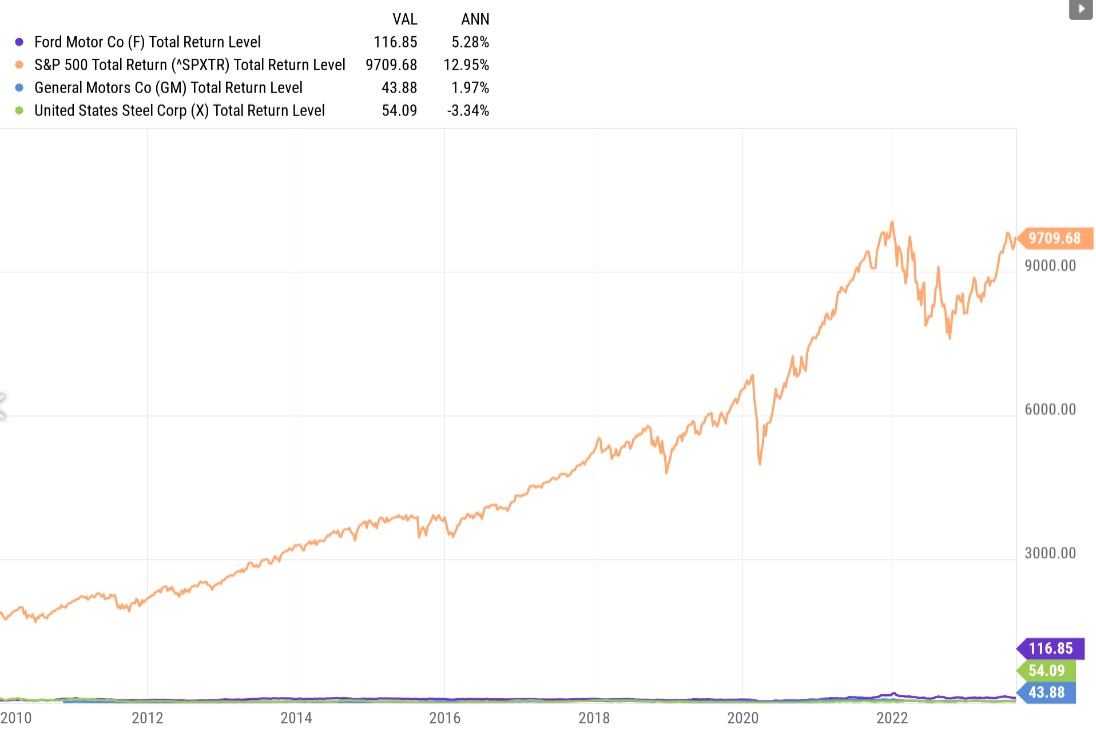
This chart from YCharts, shows the total returns for Ford Motor ( F ), General Motors ( GM ), and U.S. Steel ( X ) since 2010, and then the total return of the S&P 500 from the same inception date.
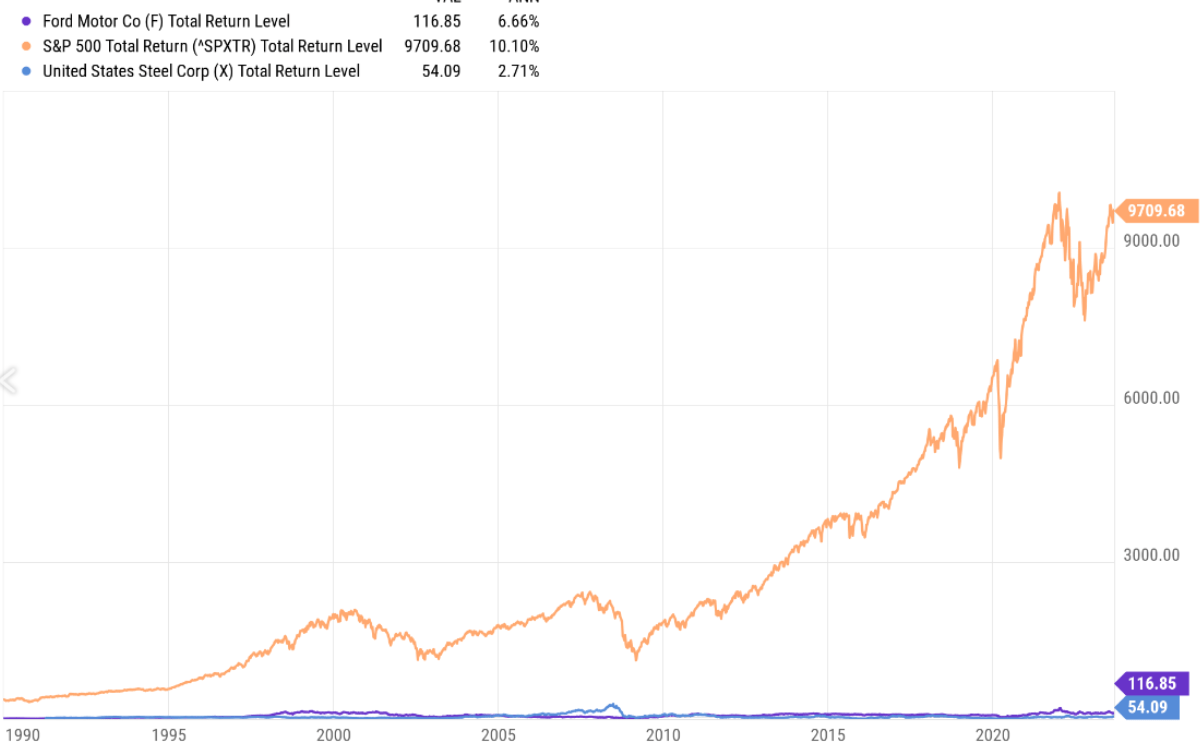
This chart takes us back to 1990, but GM had to be excluded from the calculation given its bankruptcy in 2008. Again, the S&P 500’s total return from 1990 to August 31, ’23 is daunting relative to Ford and U.S. Steel.
These are “annual” returns for each company and for each period, per the YCharts data.
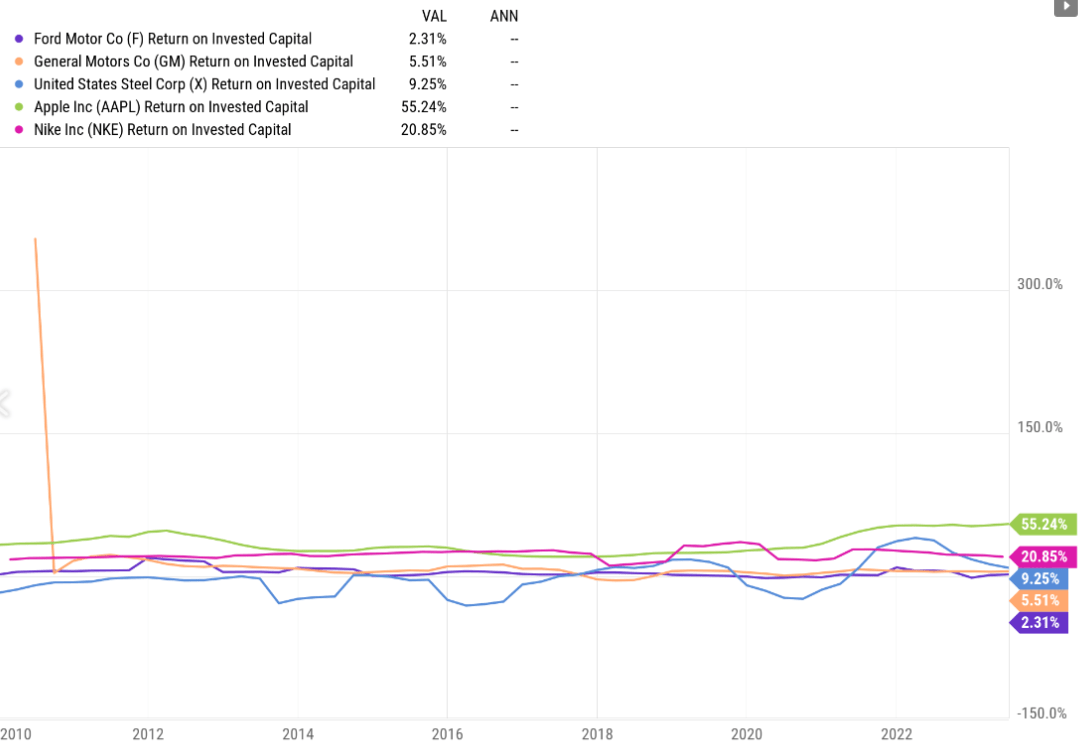
This last chart is return on invested capital for the three companies, i.e. Ford, GM and U.S. Steel, since 2010 but Apple ( AAPL ) and Nike ( NKE ) were added as a comparison.
A couple of thoughts:
1.) Ford’s annual return since 1990 was surprising (2nd chart), and wasn’t too far short of the S&P 500’s for the last 33 years, but Ford’s annual return in the 1990s decade was over 25% a year, which influenced the last 30 years.
2.) Looking at Morningstar financial data on US Steel, which Morningstar does not currently rate or assign a fair value to, from 2013 to 2023, 4 of the last 10 years have seen substantial negative years of ROIC for the steel giant, with two of those years being a ROIC of greater than -20%.
When U.S. Steel was recently put into play by Cleveland-Cliffs ( CLF ) in the last month, i.e. Cleveland-Cliffs announced it was looking to acquire the American steel giant, the announcement popped X back above its June ’91 IPO price of $20 to $25 per share, after the stock spent the majority of the time since 2010 trading under that level.
Summary/conclusion: What prompted this article was a note from a reader on the Big 3 and their United Auto Workers ((UAW)) union negotiations.
Much – but certainly not all – of old industrial America has rather unremarkable returns on invested capital and that comes with heavily-industrialized industries, that usually have a high degree of operating leverage (small changes in revenue generate large changes in operating profit and cash flow) as well as onerous capex requirements.
Clients owned Ford and GM stock after 2008 and the recovery after 2008, but the stocks were sold for good with little interest in owning given their constant issues with commodities (Ford), trouble maintaining profitability at overseas operations (Ford and GM) and pretty mediocre returns on invested capital over long time periods.
The UAW has a strong hand in terms of its bargaining position heading into the 2023 negotiations, with a 3.5% to 3.8% national unemployment rate and sympathetic President and Congress supporting the rank and file.
Frankly though with the ascension of Tesla ( TSLA ) and the stress that is putting on the traditional ICE (internal combustion engine) manufacturers, my own opinion, and I’m sure that many will disagree, is that the Big 3 are like the airlines, i.e. the mainstays like Ford and GM will continue to suffer from mediocre profitability and returns, while other OEMs that can shift, will do so to EVs (electric vehicles) and do so profitably, while the Big 3 suffer.
The unions will have a strong hand entering negotiations, but whatever the victory that comes from the negotiations for the union is likely a Pyrrhic win at best. The higher costs and expenses could result in lower returns going forward and that will not help the ultimate health of the business.
Take all this with healthy dose of skepticism, since it’s just one opinion. In no way does any of this represent advice, and past performance is no guarantee of future results.
All of the above data and charts are from YCharts. Capital markets can change quickly for both the good and bad, and readers should evaluate your own portfolio and market volatility in light of your own comfort level and adjust accordingly.
Thanks for reading.
Editor's Note: The summary bullets for this article were chosen by Seeking Alpha editors.
For further details see:
Ford, GM, U.S. Steel Vs. S&P 500: A Look At Annual Returns And Returns On Invested Capital