KN - Forensic Value Mid-Year Selections: Highest Positive And Negative Scoring Stocks For July 2023
2023-07-10 04:56:16 ET
Summary
- The new July 2023 selections are the current top positive/negative forensic stocks based on combined scores from four different forensic algorithms.
- Both the 2022 January Positive Forensic portfolio beat the S&P 500 by +6.59% and the Negative Forensic portfolio beat by +22.18% last year.
- These portfolio selections are released every 6 months based on extreme forensic scores for irregularities and risk but continue to outperform the benchmark indices.
- Current January Negative Forensic picks are up +7.29% YTD, led by MRNS +172.86%, RMNI +25.72%. 2 picks BLUE, ACRX are down over -50%.
- Current January Positive Forensic picks are up +15.01% YTD, led by TREX +54.9%, MSB +13.3%. Only 1 pick is negative with COP -12.2% YTD.
Introduction
These selections continue as ongoing tests and active portfolios for readers looking for value stocks using one of the best fundamental value models in peer-reviewed financial literature with additional customized enhancements.
Top Forensic Value Stock Mid-year Selections: Highest Positive & Negative Scoring Stocks For July 2023
This quantitative study continues a series of multi-year test now using the top four forensic algorithms applied to detect bankruptcy risk, earnings manipulation, and financial irregularities. This forward testing study makes portfolio selections from the highest positive and highest negative scoring stocks across the U.S. stock exchanges to measure performance variances between portfolios and benchmark indexes.
The different algorithms created by Beneish, Ohlson, and Altman are well documented from financial literature and rely exclusively on fundamental data including year over year operational performance measures. The combination of all three bankruptcy and financial irregularity algorithms creates a unique "deep dive" on key value characteristics and applies a total of 22 different fundamental financial variables for assessment. The newest addition of the Montier C-Score began in August 2020 and now increases the total combination of accounting variables to 28 across all four algorithms.
Frequently Asked Questions
1. Why would the negative forensic stocks perform well if they are the top outliers for negative forensic characteristics?
Enron was a top negative forensic stock that rapidly gained over 600% in a few years before whistleblowers finally revealed the financial irregularities that eventually led to bankruptcy. Extreme forensic outliers can be products of incredible positive growth conditions or financial irregularities that have not been addressed. In either case the stock price has proven to benefit greatly over significant periods of time.
bigcharts.marketwatch.com
2. Why would the positive forensic stocks perform well with outliers in positive conditions across all the forensic characteristics?
Stocks with extremely favorable forensic scores are likely to have excellent operations, strong stable financial ratios, solid fundamental valuations and attract premium pricing from investors. These stocks may have attractive low valuations as a result of receiving less hype, less glamorous operations, or out of favor industries that are still going strong.
Examples of Forensic Algorithm applications
Prior examples of the application of these forensic financial algorithms can be found in my published articles and interviews:
- Top Forensic Algorithms Check Published Fraud Allegations Against iQIYI ((NASDAQ:IQ))
- US Fraud examiner says forensic algorithms show no evidence of financial wrongdoing at Infosys
- Top Forensic Algorithms Check Whistleblowers' Allegations Against Infosys
- Top Forensic Algorithms Check Whistleblower's $6B Claims Against Disney
- Running Top Forensic Algorithms On 2012-2019 GE Financials
Prior articles and published references detail the composition and methods of each of the forensic algorithms used in this article. For simplicity, here is a summary of what each of the forensic algorithms used by fraud examiners and investigators scan for at high levels:
1. The Beneish model uses eight variables to detect earnings manipulation. Created by Professor Messod Beneish, an M-Score greater than -2.22 signals that the company is likely to be a manipulator.
2. The Altman model is used to predict whether a firm is likely to go into bankruptcy within 2 years and uses many variables from the income and balance sheets for this analysis. Distress is considered high with a value below 1.81.
3. The Ohlson model also predicts bankruptcy risk using a multi-factor financial algorithm developed by Dr. James Ohlson in 1980. Any percentage values above 50% indicate the risk of a firm's bankruptcy within 2 years.
4. Lastly, James Montier developed a C-Score that creates a simple scoring system to highlight firms that may be "cooking the books" with values above 4 being at risk firms.
The firms listed below for negative scoring all qualified in the high adverse levels for each of the forensic models described above. The positive scoring stock selections have the lowest or most favorable combined values of the forensic scores across the US exchanges.
Prior Negative Forensic Returns
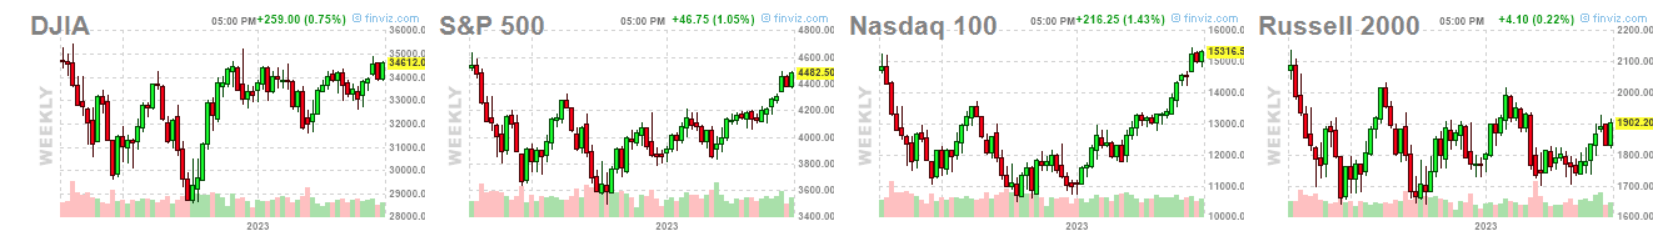
2023 has delivered the best start of the year for the Nasdaq +31.7% but nearly 90% of those gains have been unusually concentrated in the 10 largest mega cap stocks. In contrast the Dow index is only up +3.80%. Last year delivered the worst half-year start to the stock market since 1970 and the worst full-year returns since 2008. Those who followed the Momentum Gauges® to avoid record downturns can further enhance these portfolio returns.
1-year charts of the major indices
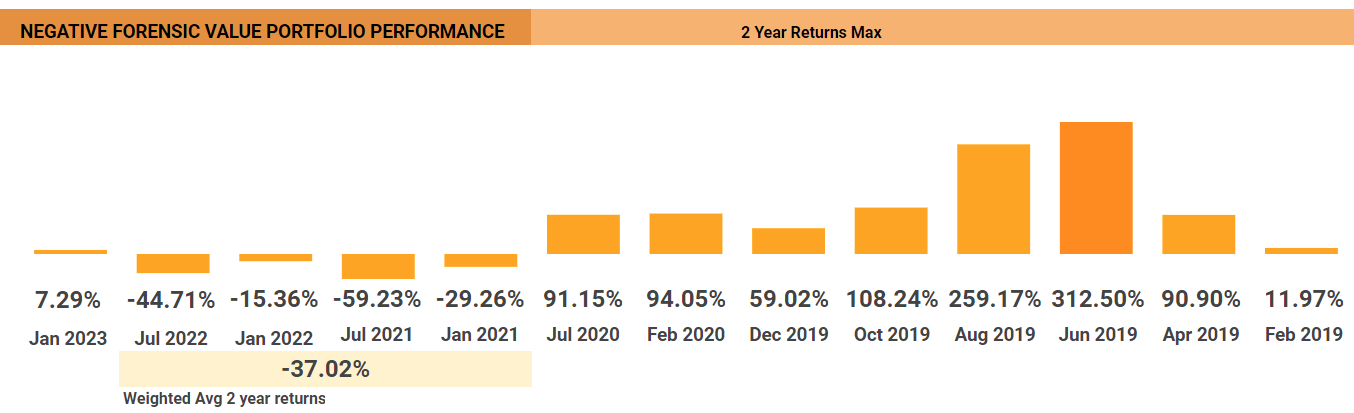
2023 Mid-Year Returns - Negative Forensic
Portfolios are measured for 2 years with current returns, average weighted returns, and peak gains tracked on the V&M Long Term Dashboard .
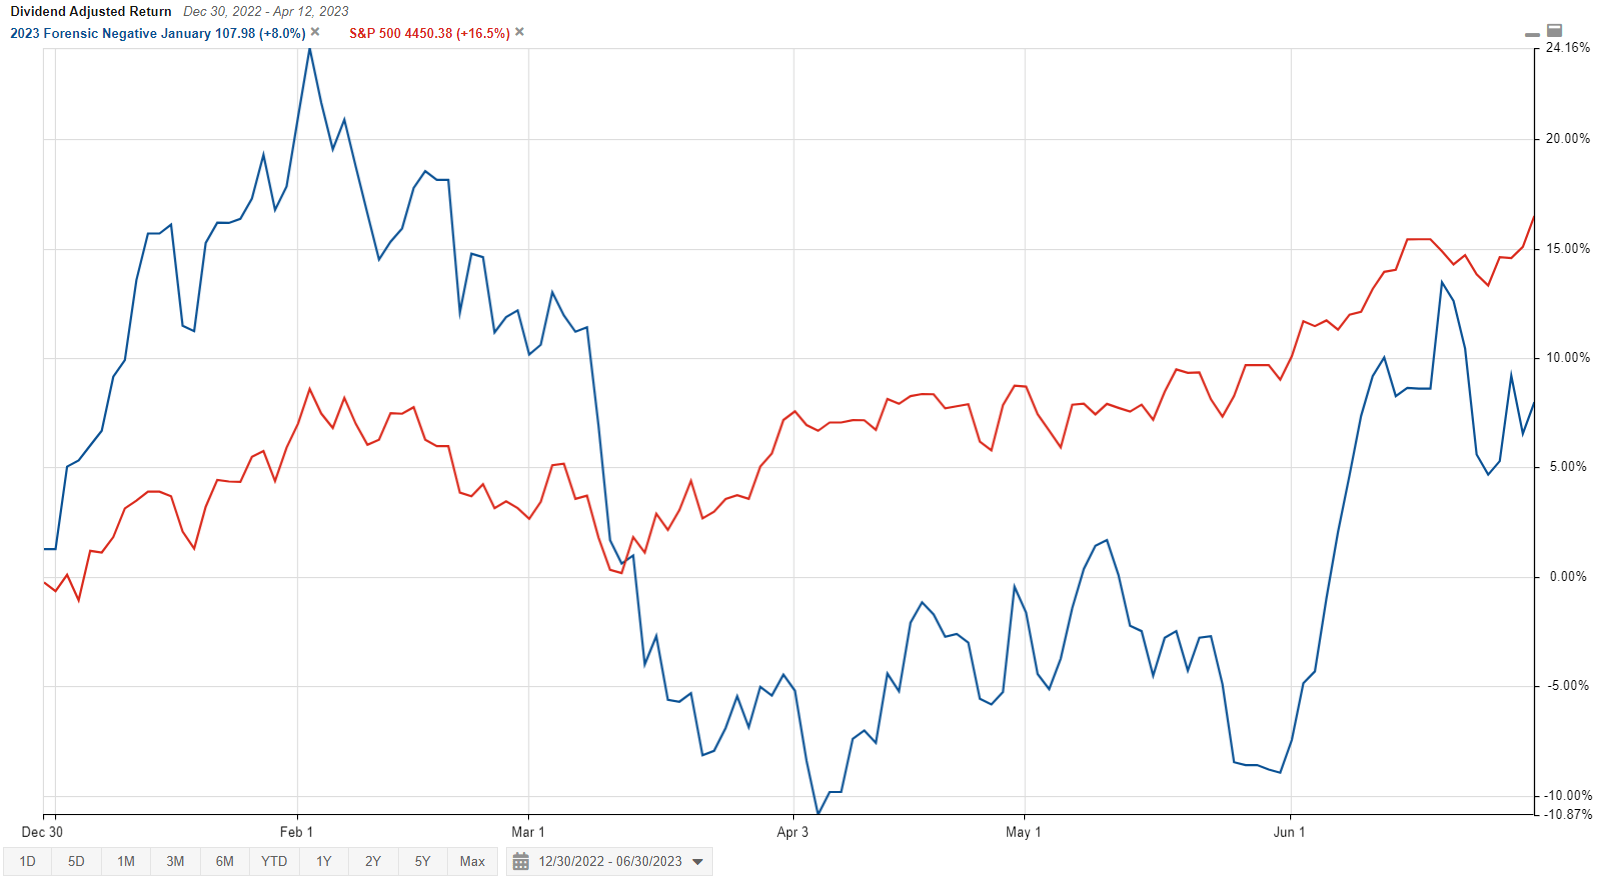
January Dividend Adjusted Returns vs. S&P 500
The January Negative Forensic YTD portfolio dividend adjusted returns are up +8.0% peaking in early February at +24.2% ahead of the negative Momentum Gauge signal on February 21st. The total return Negative Forensic portfolio beat the S&P 500 by +24.84% in 2022.
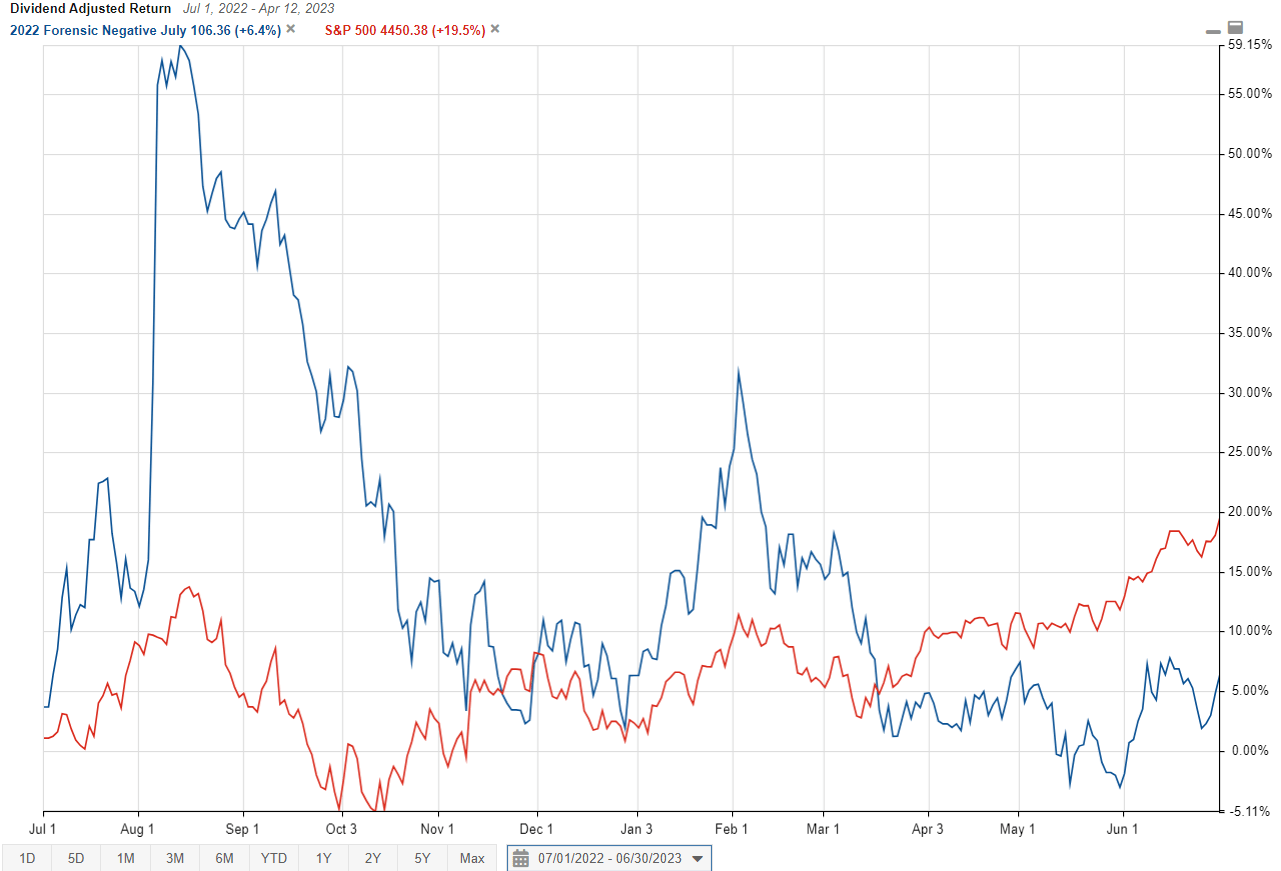
July 2022 1-year Dividend Adjusted Returns vs. S&P 500
The July Negative Forensic 1-year portfolio dividend adjusted returns are up +6.4% peaking in August last year +53.5% ahead of the negative Momentum Gauge signal on August 30th. The total return Negative Forensic portfolio beat the S&P 500 by +24.84% in 2022. One thing you may notice is that the Negative Forensic portfolios tend to generate high volatility and short term gains. Additionally, they have many irregularities on the forensic models that tend to lead to much higher levels of delisting, mergers, and acquisitions than any other portfolios I offer. Many of these stocks have high short floats and participate in large short squeeze events.
Following the Daily Momentum Gauge signals or even the Weekly Gauge signals shown below you could further enhance the posted returns of the long term portfolios. You can also add downside protection for additional gains.
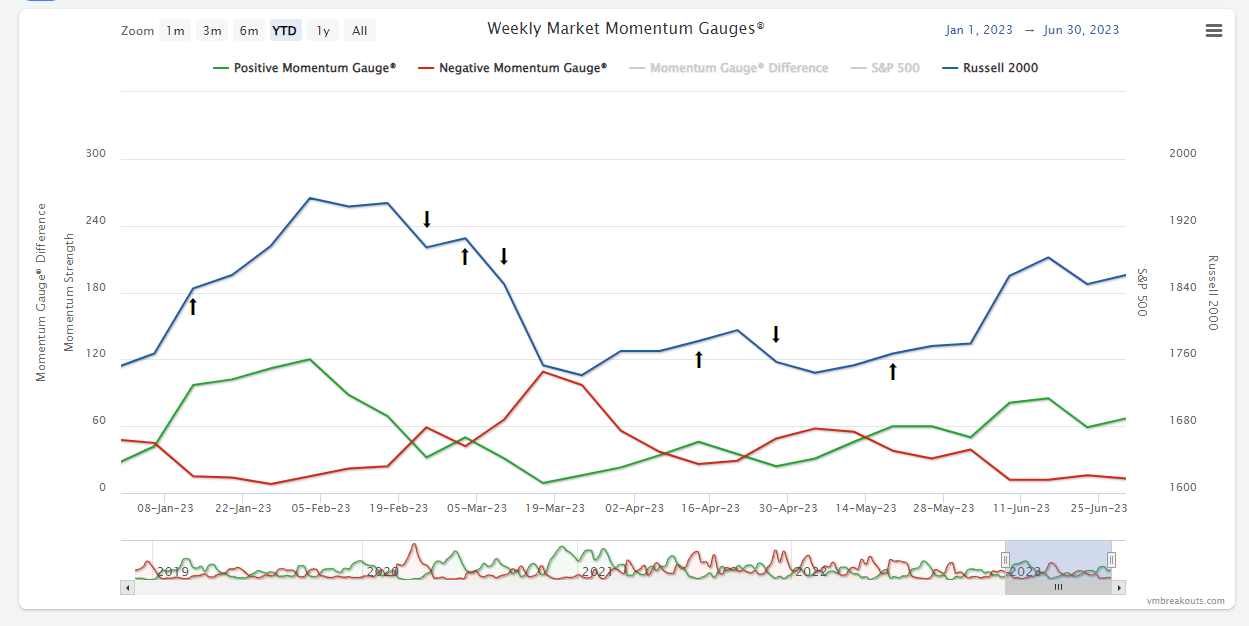
July 2023: Negative Forensic Value Enhanced Selections
Out of more than 8,000 stocks screened for July 2023 there were only six highly adverse scoring stocks across each of the four forensic algorithms. This is down significantly from 35 adverse stocks in July 2022 and may reflect lower levels of financial distress. By that I mean that fewer warning signals are turning up suggesting conditions are not as bad as they have been back during the Covid years.
| Date of Search |
| Number of highly adverse stocks |
| July 2023 |
| 6 |
| January 2023 |
| 8 |
| July 2022 |
| 35 |
| January 2022 |
| 21 |
| July 2021 |
| 41 |
| January 2021 |
| 187 |
| February 2020 |
| 11 |
| December 2019 |
| 6 |
| October 2019 |
| 7 |
| August 2019 |
| 9 |
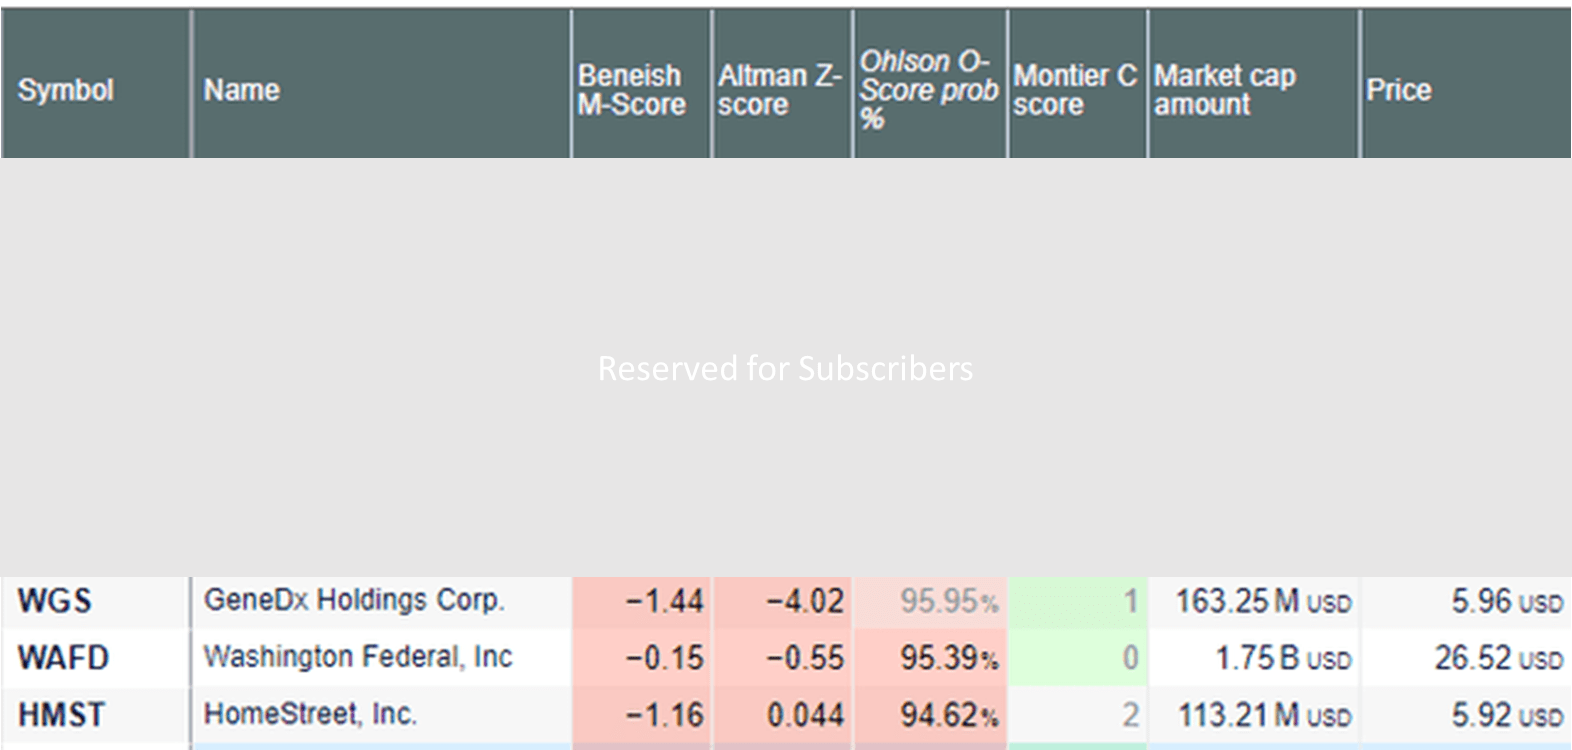
It is very likely the impact of the global pandemic caused the significant increase in highly negative forensic scoring stocks between July of 2020 to January 2021. The number of highest negative scoring stocks is dropping off again toward pre-pandemic levels with fewer extremely adverse stocks. The top 10 highest negative results for January are sorted along the Ohlson O-score probability percentage in descending order.
Top Negative Forensic stocks for July 2023
Overall Scores Independent of the Negative Forensic Selections
An independent ranking of these firms using other value and growth scores is shown below that may provide additional insight into the risk of these firms.
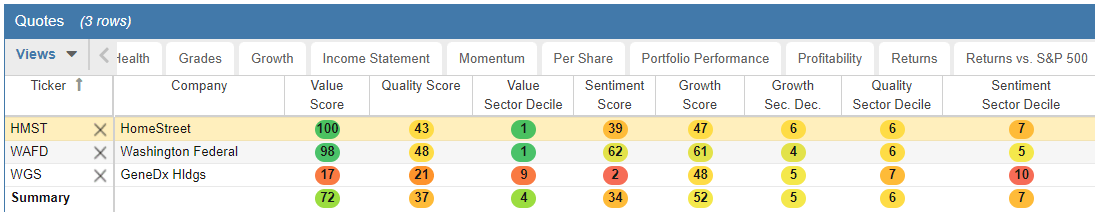
Morningstar Financial Health Grade
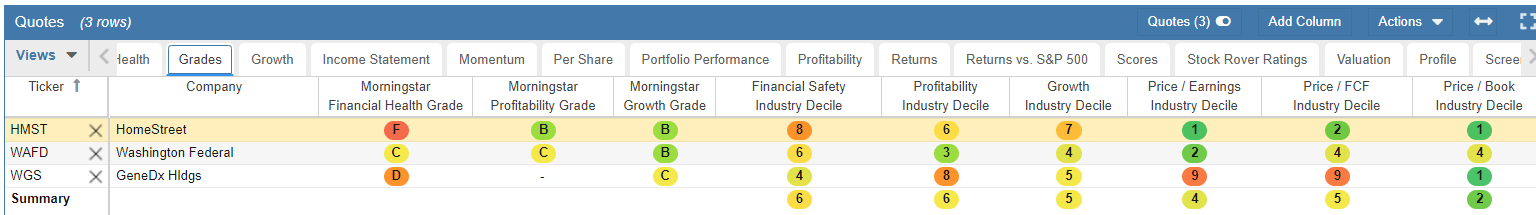
These highly negative forensic stocks seem unlikely to perform well based on fundamental analysis and the red flags of four different forensic algorithms. However, as we can see from several years of past performance the results have produced above average market performance even beating the major benchmarks the last 6 years. Some of the strong gains may be attributed to large short positions and overly negative perspectives about these stocks. The negative portfolios have an extremely high percentage of stocks delisting and getting acquired over the measured periods.
2023 Mid-Year Returns - Positive Forensic
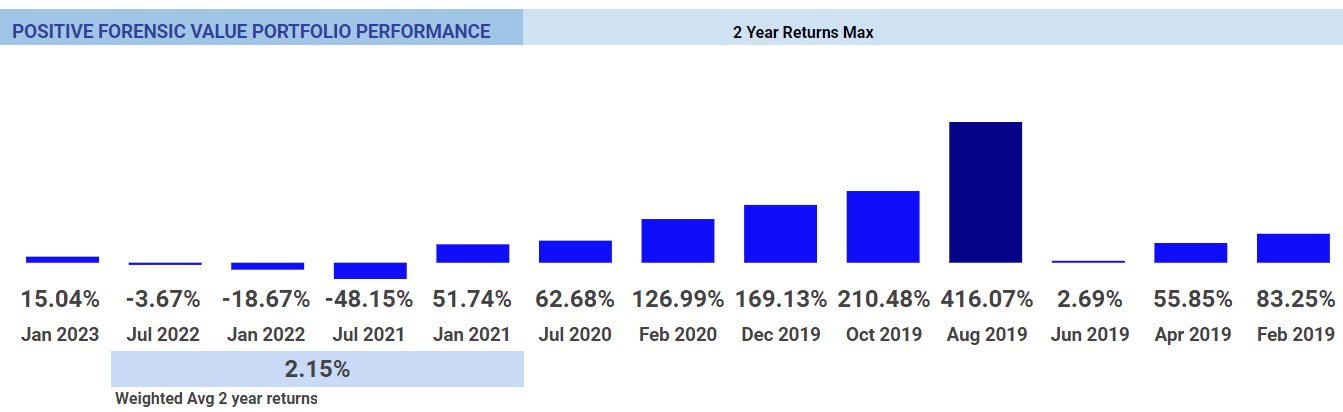
Portfolios are measured for 2 years with current returns, average weighted returns, and peak gains tracked on the V&M Long Term Dashboard . Because at least two of the forensic algorithms in the published financial research used 2-year models we will also follow at least 2 years of returns from these portfolios as shown below:
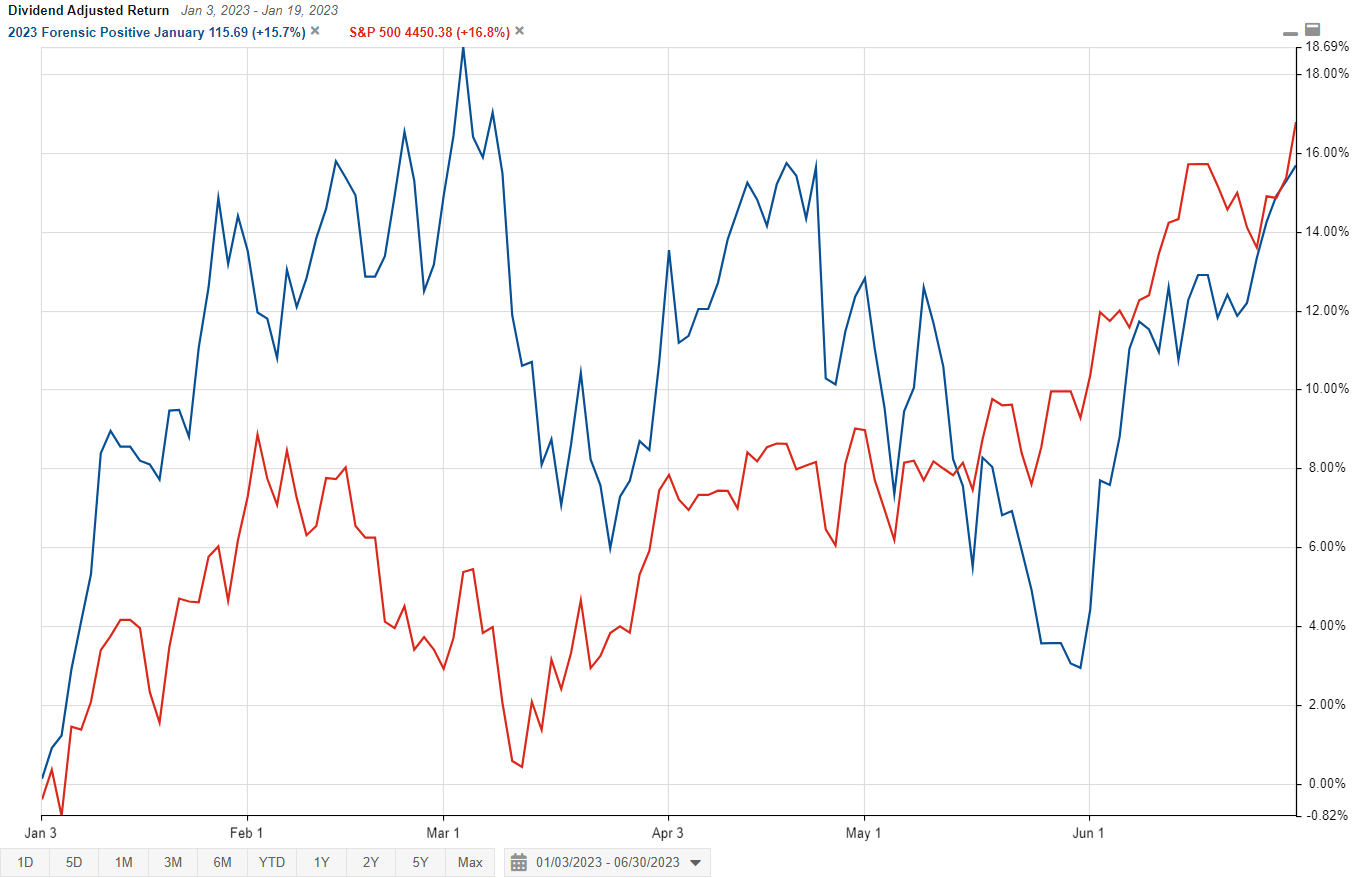
January Dividend Adjusted Returns vs. S&P 500
The January Positive Forensic portfolio 6-month dividend adjusted returns are up +15.7% peaking in early March at +18.7% just after the negative Momentum Gauge signal on February 21st. The total return Positive Forensic January portfolio beat the S&P 500 by +6.94% in 2022.
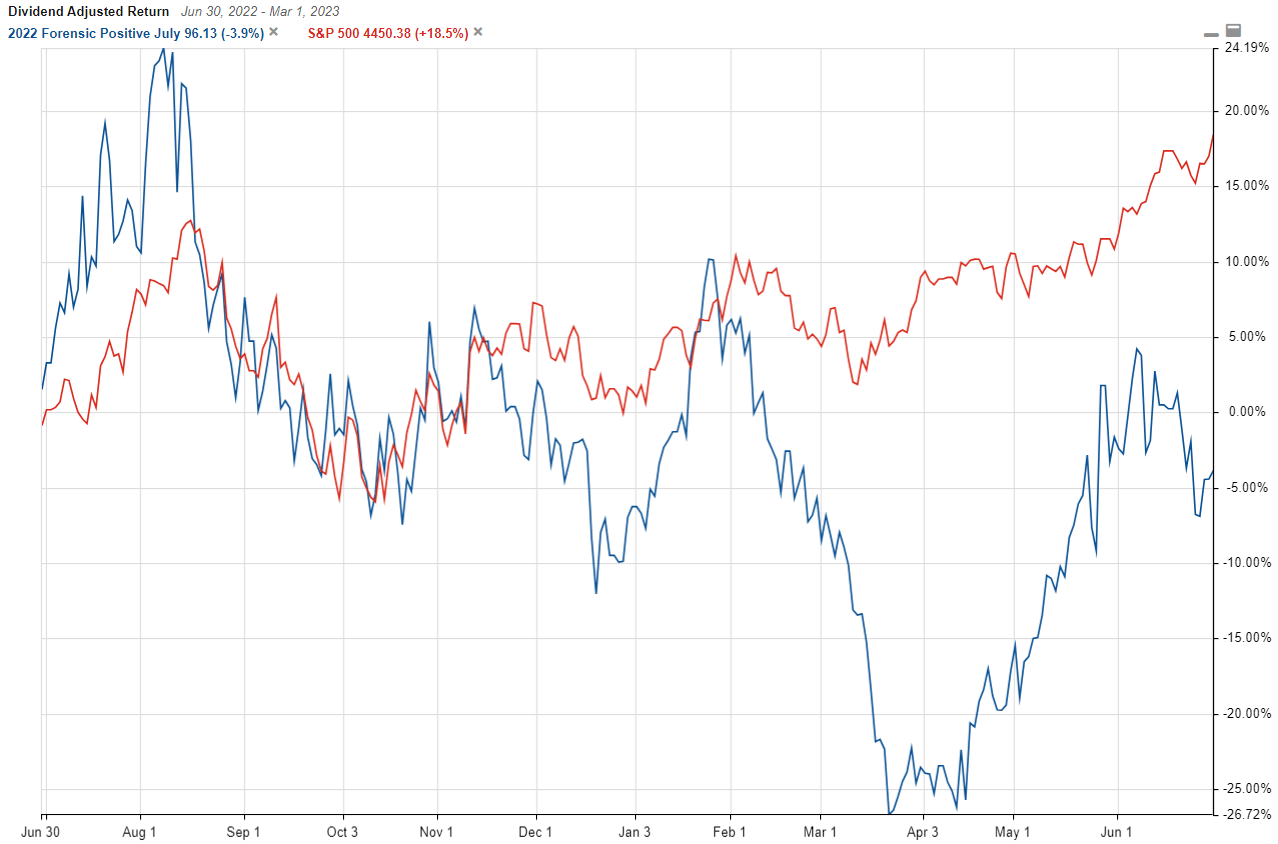
July 2022 1-year Dividend Adjusted Returns vs. S&P 500
Only three stocks qualified for the July 2022 Positive Forensic portfolio last year. After peaking at +24.2% gains in August last year, iTeos Pharmaceuticals ( ITOS ) has declined -36.6% pulling the small portfolio lower. The other two stocks, Tarsus Pharmaceuticals ( TARS ) is up +20.2% and XBiotech, Inc ( XBIT ) +5.32% would make the portfolio positive. This is the risk of such a small and highly concentrated portfolio in biotechs.
Following the Daily Momentum Gauge signals or even the Weekly Gauge signals shown below you could further enhance the posted returns of the long term portfolios. You can also add downside protection for additional gains.
July 2023: Positive Forensic Value Enhanced Selections
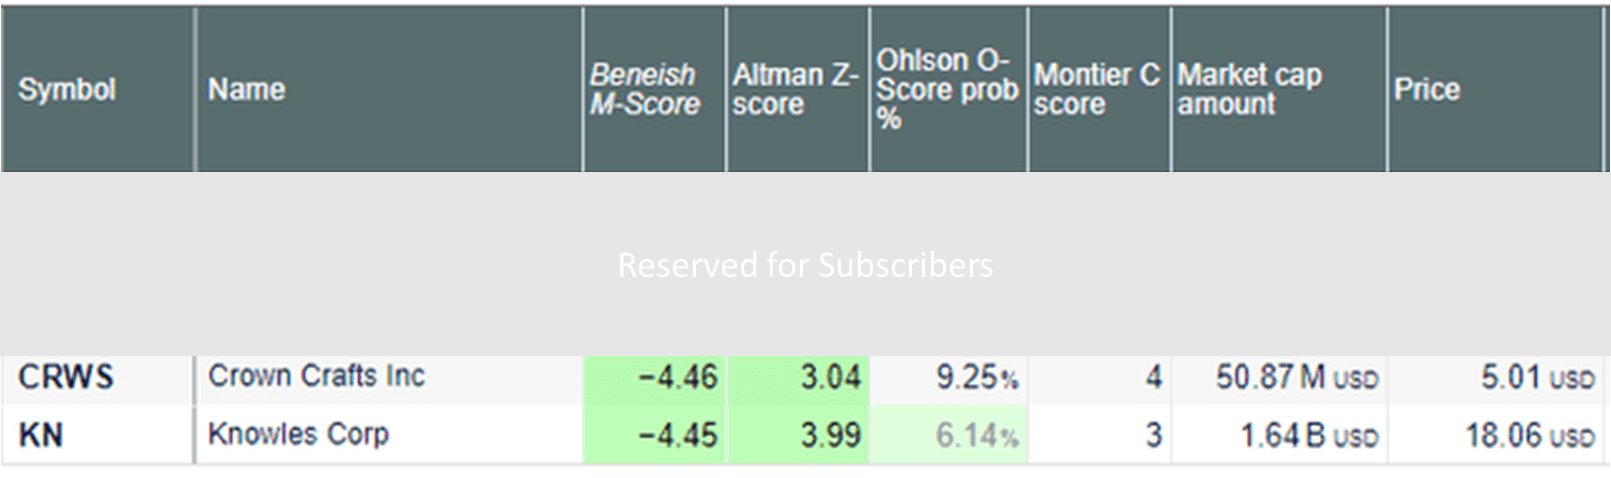
Out of more than 8,000 stocks screened across all the US exchanges, only 5 stocks qualified as highly positive across all the forensic algorithms for low risk of bankruptcy or financial irregularities. Most years the selections are fewer than 10 and this is a small qualifying group. It is typical for there to be fewer qualifying positive than negative forensic stocks across all the algorithms. The Beneish model is the only forensic algorithm tested in peer reviewed literature that shows higher performance results. As a result the four qualifying stocks sorted by the most favorable Beneish M-score are as follows:
These forensic scores do not necessarily forecast stock price growth. It would seem likely that stocks with low risk of bankruptcy, low probability of corporate distress, low chance of earnings manipulation, and low probability of financial irregularities on deep fundamental analysis should provide a safer value proposition for investors going forward. Prof. Beneish has documented positive returns from a favorable M-score in his research.
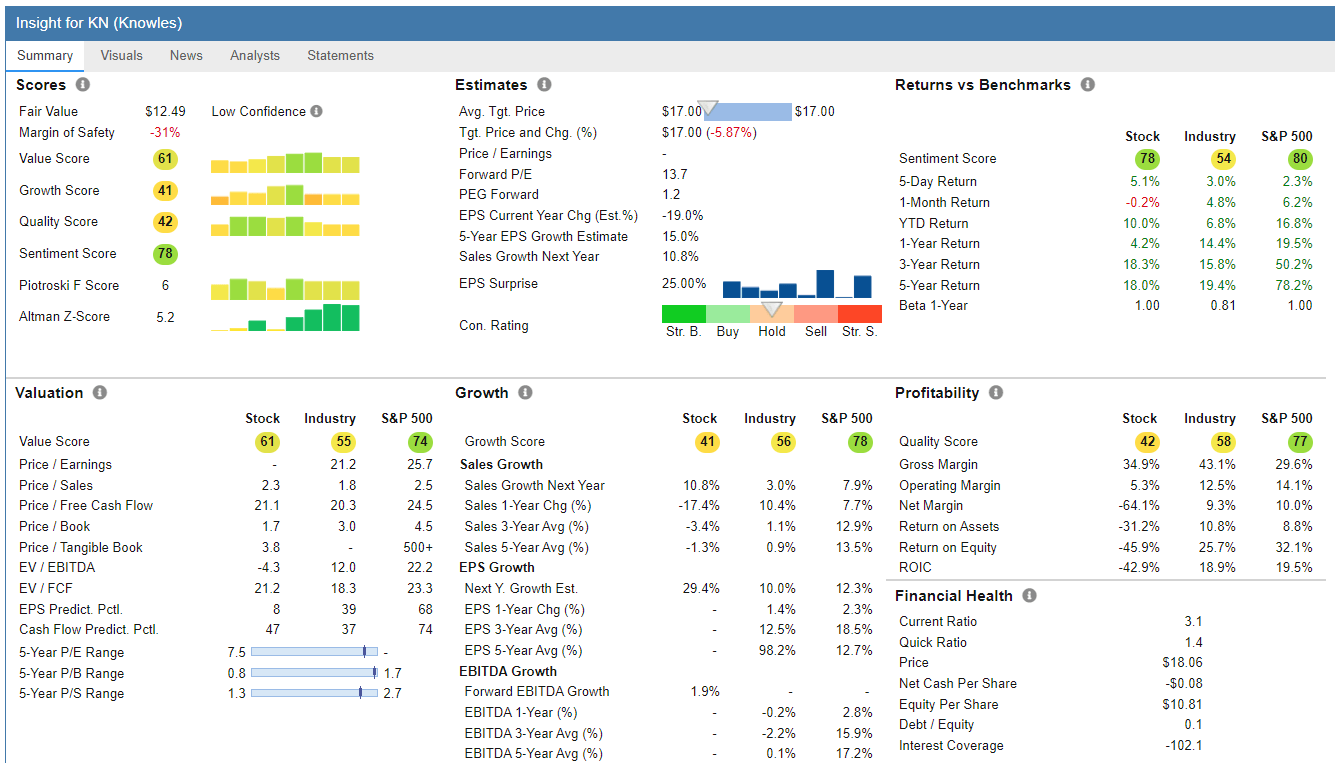
Overall Scores Independent of Top Forensic Algorithms
An independent ranking of these firms using other value and growth rankings is shown below that may provide additional insight into the risk of these firms.
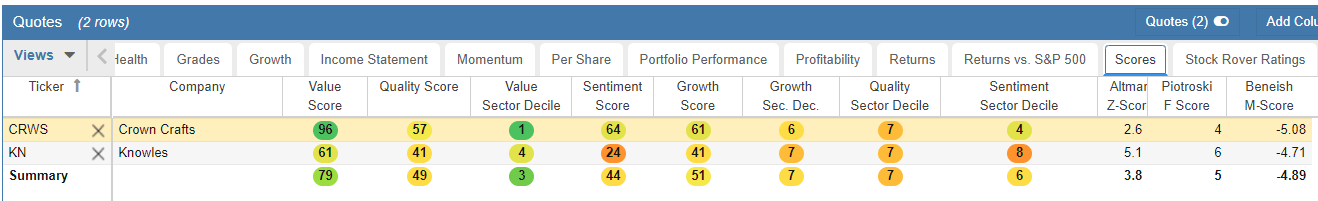
Morningstar Financial Health Grade
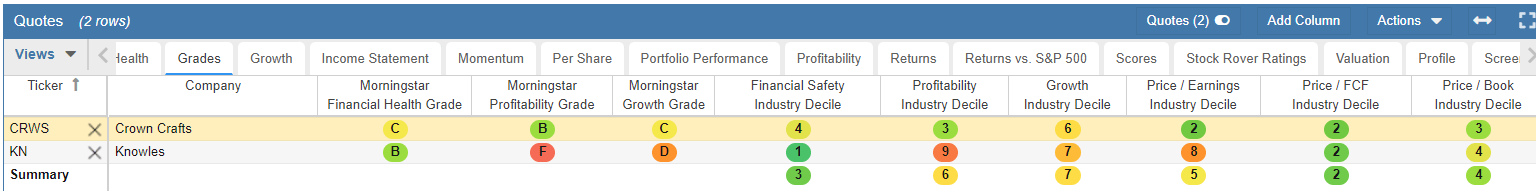
Positive Forensic Charts
Crown Crafts ( CRWS )
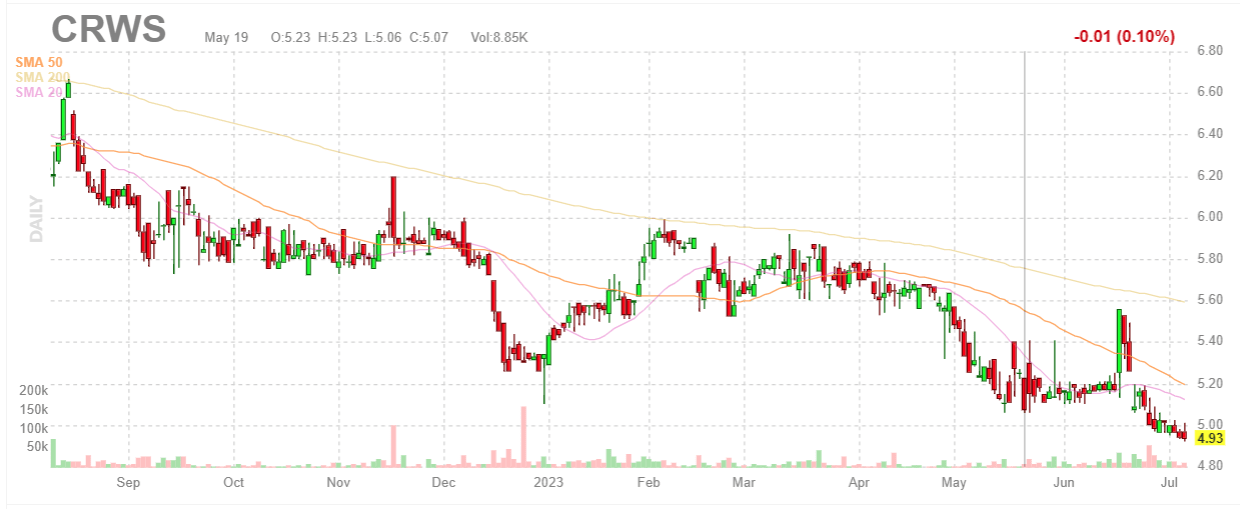
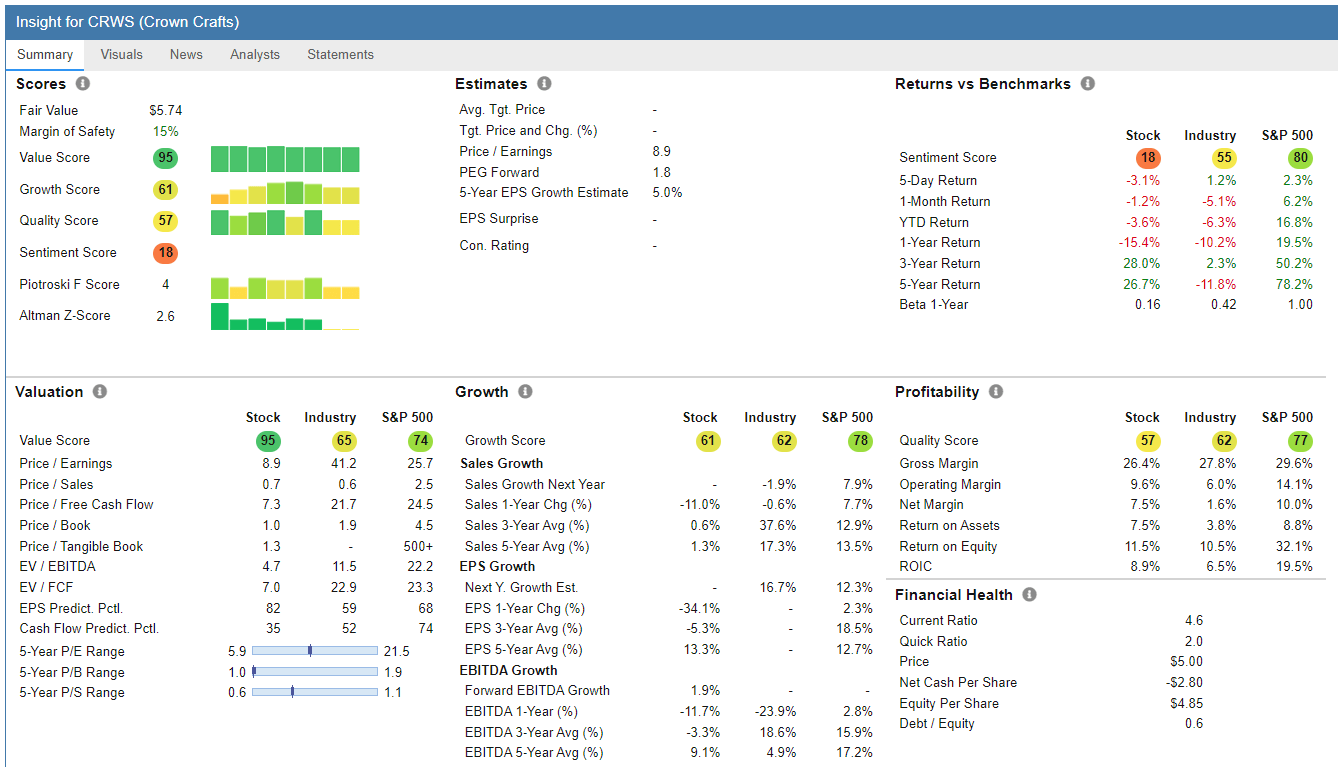
| Jul-02-23 10:27AM |
| Crown Crafts, Inc. ((NASDAQ:CRWS)) Q4 2023 Earnings Call Transcript Insider Monkey |
| Jun-23-23 01:35AM |
| Q4 2023 Crown Crafts Inc Earnings Call Thomson Reuters StreetEvents |
| Jun-22-23 09:23AM |
| Crown Crafts: Fiscal Q4 Earnings Snapshot AP Finance |
| 09:08AM |
| Crown Crafts Announces Financial Results for Fourth Quarter and Full Year Fiscal 2023 GlobeNewswire |
| Jun-15-23 06:28AM |
| Crown Crafts to Announce Fourth Quarter and Full Year Fiscal 2023 Results on June 22, 2023 GlobeNewswire |
| May-31-23 08:42PM |
| 7 Safe High-Yield Dividend Stocks to Buy in June 2023 InvestorPlace |
Knowles Corporation ( KN )
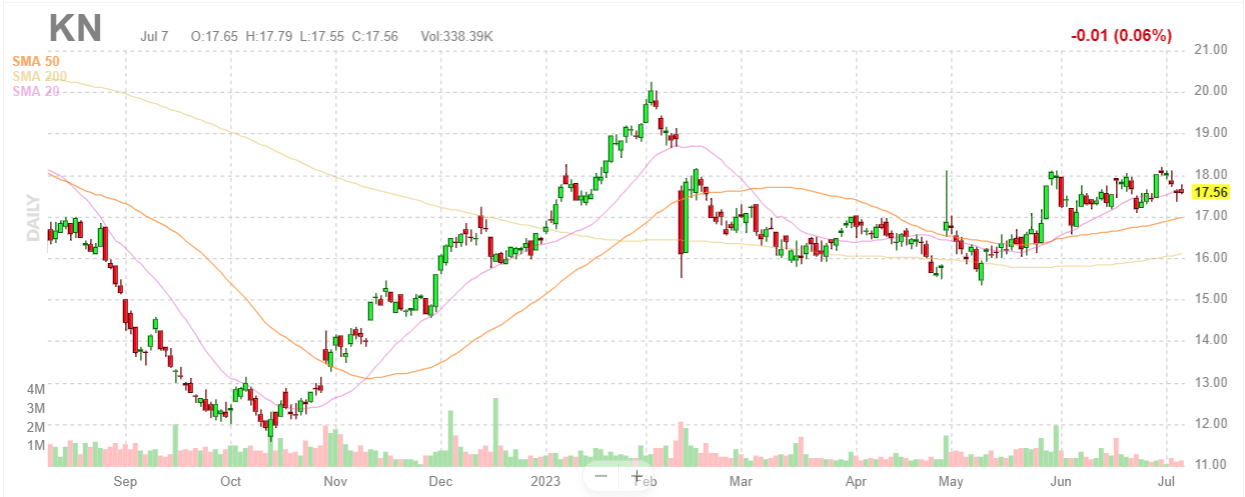
| Jun-22-23 09:00AM |
| Knowles Balanced Armatures Pack High-Fidelity Punch into 21-Driver UE PREMIER IEM Business Wire |
| Jun-21-23 08:00PM |
| KN: What does Argus have to say about KN? Argus Research |
| May-16-23 09:00AM |
| Knowles Appoints Erania Brackett to its Board of Directors Business Wire |
| May-09-23 09:00AM |
| Knowles Gifts $200K to Advance Gender Diversity in Engineering Business Wire |
| Apr-28-23 12:43PM |
| Knowles ((KN)) Revenues Falter Y/Y, Q1 Earnings Beat Estimates Zacks +6.70% |
Methodology Review
The purpose of this multi-year forensic analysis study is to provide investors with additional tools to evaluate financial irregularities according to four different detection models from academic research. Circumstances surrounding firms are always subject to change, open to extenuating circumstances, and models by their very nature always contain a degree of error.
Again, it is important to stress that firms identified by these academic models may not be in actual distress or suffer from any adverse irregularities whatsoever . These models are certainly not foolproof and were designed by academic researchers to improve the chance of detection of irregularities leading to bankruptcy, earnings manipulation, or flag the presence of financial distress.
At the same time, these models are among the best peer-reviewed forensic models in the financial literature and have some significant documented value.
The Beneish model for example has "correctly identified, in advance of public disclosure, a large majority (71%) of the most famous accounting fraud cases that surfaced after the model's estimation period" (Beneish, Lee, & Nichols, 2013, p. 57).
Further, in a survey of 169 chief financial officers of public companies, Dichev, Graham, and Rajgopal (2012) reported that respondents estimated that approximately 20% of all companies manage earnings to misrepresent economic performance. While three different financial forensic models are applied in the selection of these portfolios, researchers associated with testing the M-score described their approach this way:
Our main hypothesis was that companies that share traits with past earnings manipulators (i.e., those that "look like manipulators") represent a particularly vulnerable type of growth stock. Because of their strong recent growth trajectory, these companies are likely to be more richly priced. At the same time, they exhibit a number of potentially problematic characteristics, indicative of either lower earnings quality or a more challenging economic environment. Although the accounting games such companies engage in might not be serious enough to warrant legal action, we posited that their earnings trajectory is more likely to disappoint investors (i.e., they have lower earnings quality).
(Beneish, Lee, & Nichols, 2013, p. 57).
To my knowledge no similar longitudinal study of positive and adverse forensic scoring using all three models simultaneously has ever been conducted before. It is also important to constructively consider why such anomalies may exist in these stock selections at this moment in time. The resulting data which varies from month to month may prompt firms and investors to consider further due diligence of publicly available financial characteristics to mitigate any risk or error present in the marketplace.
Cycles can shift dramatically and this is another important reason for following the Momentum Gauges® closely. This is especially true with long term portfolios. The macroeconomic factors (QE, QT, Covid impacts) can greatly affect the success of individual portfolios and stocks. Back in 2021 during the largest QE stimulus in US history, many stock pickers assumed they were geniuses until the QE 4 program ended in 2022 subsequently delivering one of the worst market returns since 2008.
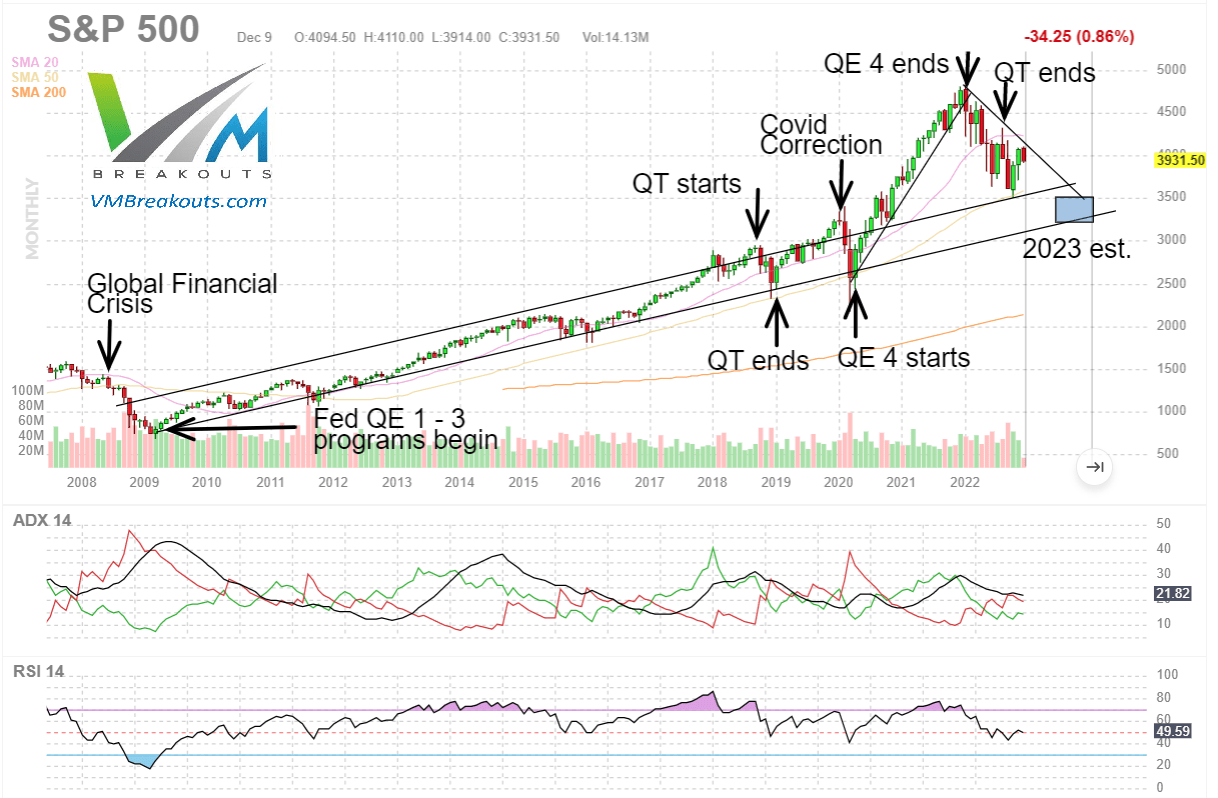
Conclusion
46 forensic portfolios (23 positive forensic value / 23 negative forensic value) have been formed for evaluation since the testing period began in July 2017.
Over multiple one-year test periods we are seeing strong differentiation in results between negative and positive forensic portfolios. Most notably delistings of stock symbols (merger, acquisition, leaving the exchange) are approximately 10x higher among negative forensic stock selections than for positive forensic stocks. Over the years we see that price behavior is more stable among individual positive selections, but that greater individual returns are coming from the negative portfolios. In several years with nearly 30% better average returns across eight portfolios. Overall the negative forensic stocks are producing higher returns, with larger variability and at a much higher rate of mergers/delisting.
In prior years of this study these portfolio selections were made every 2 months. The overlap of selections was found to be quite high for these long term portfolios. Now the selections are made every six months with a minimum 2-year measurement period and there are still overlapping stocks from prior selections. Prior tests in the literature of the Beneish M-score have shown the algorithm to generate excellent results on an annual basis for positive scores. The tests continue and more explanations may develop over time.
I trust that this research and these stock selections will give you added value for your investment goals and returns in 2023!
JD Henning, PhD, MBA, CFE, CAMS
References
Altman, E. I. (1968). The Prediction of Corporate Bankruptcy: A Discriminant Analysis. The Journal of Finance, 23(1), 193-194. doi:10.1111/j.1540-6261.1968.tb03007.x
Beneish, M. D. (1999). The Detection of Earnings Manipulation. Financial Analysts Journal, 55(5), 24-36. doi:10.2469/faj.v55.n5.2296
Beneish, M. D., Lee, C. M. C., and Nichols, D. C. (2013). Earnings Manipulation and Expected Returns. Financial Analysts Journal, 69.2, 57-82.
Ohlson, J. A. (1980). Financial Ratios and the Probabilistic Prediction of Bankruptcy. Journal of Accounting Research, 18(1), 109. doi:10.2307/2490395
For further details see:
Forensic Value Mid-Year Selections: Highest Positive And Negative Scoring Stocks For July 2023