QQQM - Forget The Nasdaq And Buy SPGP Instead
2023-09-20 07:15:00 ET
Summary
- Invesco NASDAQ 100 ETF is a fund that lucked into incredible ten and 15-year returns. Long-term, it's expected to deliver 13% to 14% returns, but is currently 30% overvalued.
- In contrast, growth at a reasonable price, or GARP, is something you can safely buy today at a 19% discount.
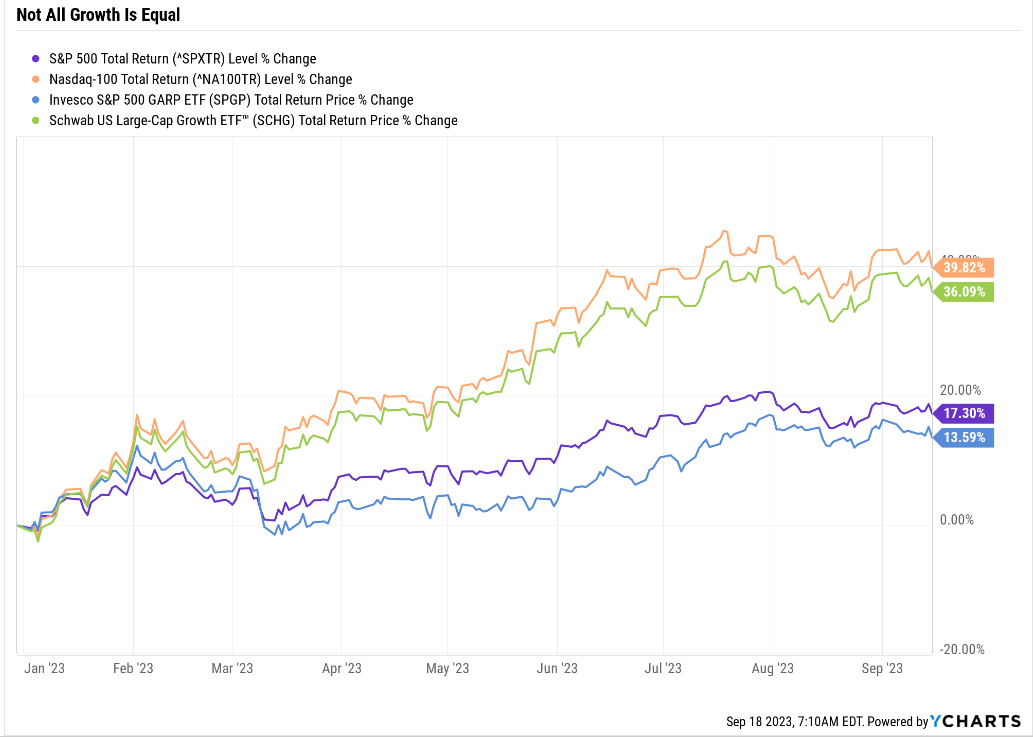
- One particular ETF, combines quality, growth, and value, to create an ETF that has run circles around the S&P during a blazing hot market. It's likely to keep doing that.
- The strategy is what you're investing in, not the individual stocks it owns. This ETF has proven itself and earns a Morningstar 5-star silver rating.
- This is one of my noble nine ETFs, that my family's charity hedge fund trusts, because of wonderful strategy, reasonable expenses, and amazing management teams.
Growth is popular in 2023 after a horrific 2022.
Growth has gone nowhere for two months, but that doesn't necessarily mean this is a consolidation that will be followed by a new leg higher.
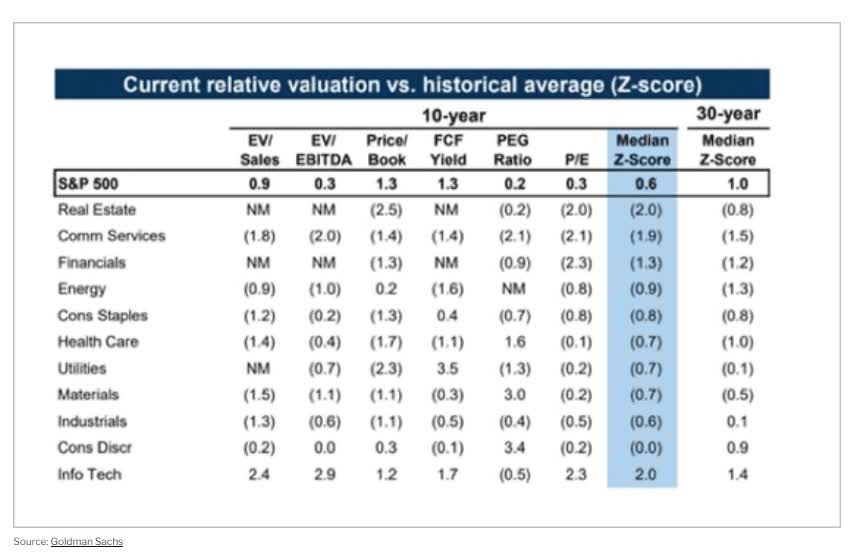
Of all 11 sectors, just one is historically overvalued: tech. And it's not just a little overrated, its two standard deviations overvalued.
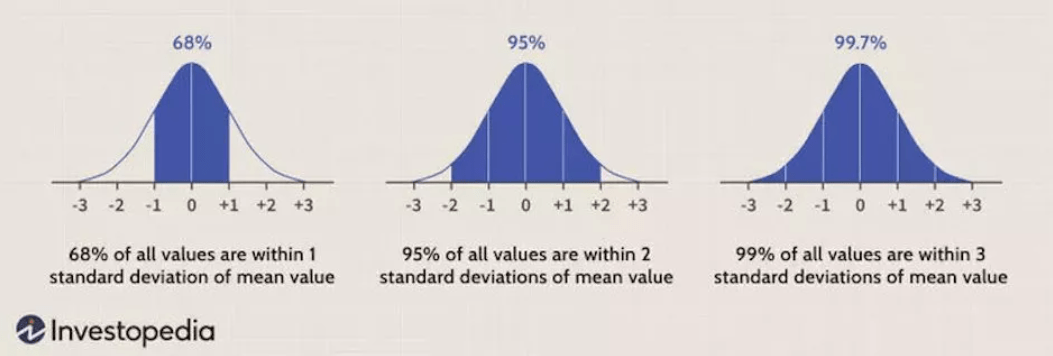
Two standard deviations mean that in the last ten years, tech has only been more expensive 2.5% of the time.
In contrast, everything else is cheaper. REITs are now two standard deviations undervalued, the mirror image of tech.
Mathematically speaking, if you were a pure robot, you would sell tech, or even short it, and go long REITs.
But I understand that we're human, not robots. Charts, statistics, and tables just can't replace a "good story" and a "beautiful chart."
There are growth investors out there who can't trust math instead of momentum and what's working so well this year.
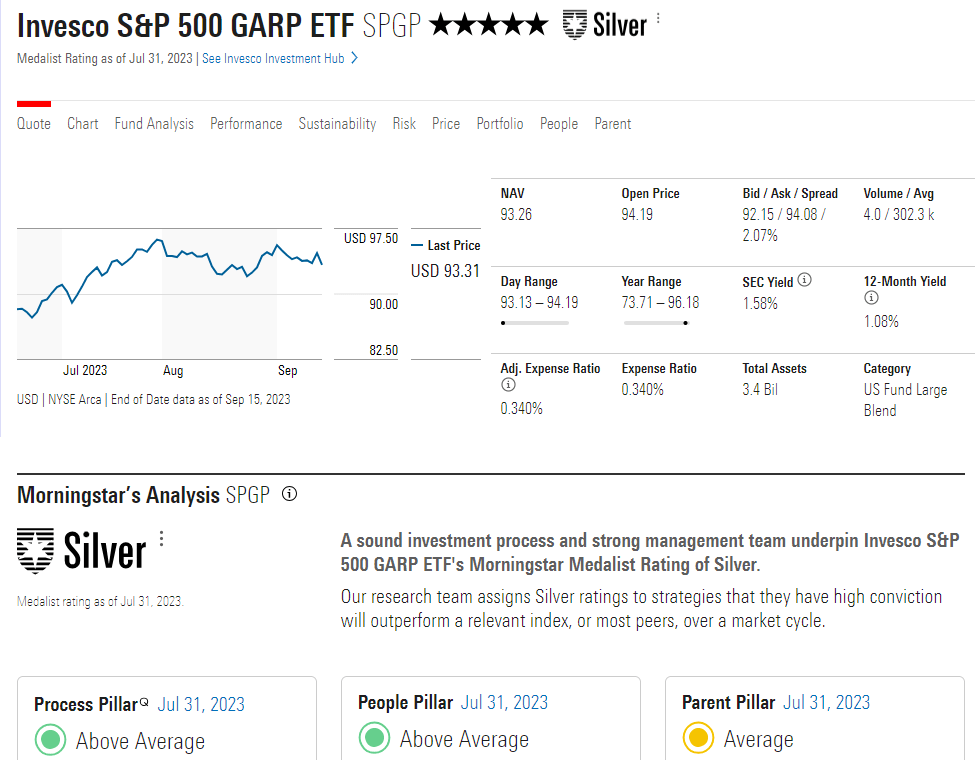
It is for those people, specifically the 3 members, who requested an update on the Invesco S&P 500 GARP ETF ( SPGP ).
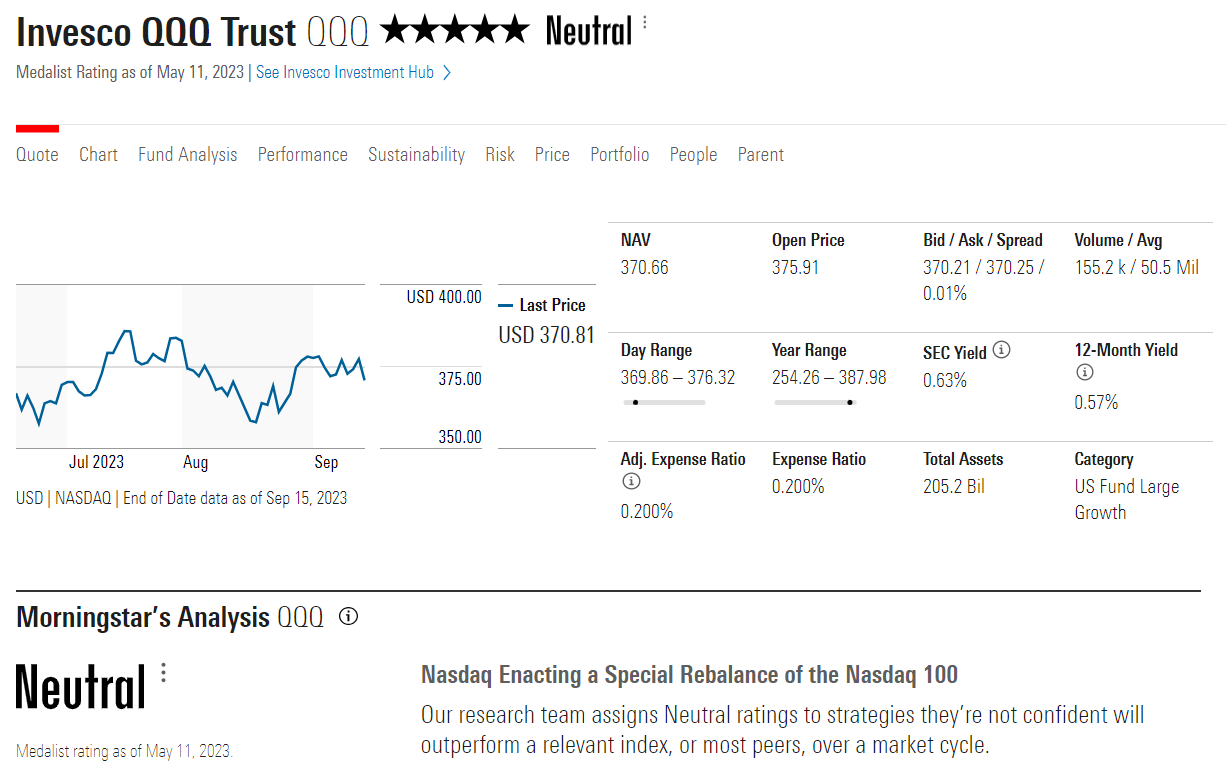
Let me combine that with 2 member requests to explain why I don't personally plan to buy the Invesco NASDAQ 100 ETF ( QQQM ).
So, let's look at SPGP and why it's the far superior choice for growth investors seeking growth at a reasonable price or GARP.
The Fundamental Problem With The Nasdaq 100 ETF
The Nasdaq 100 has delivered 13.5% annual returns for 36 years, the best index returns in history.
In the last 15 years, it's delivered 16% annual returns, and in the previous ten years, a Buffett-like 19% yearly returns.
Among over 800 growth ETFs, Invesco QQQ Trust ETF (QQQ) has been in the top 1%, and its tax efficiency is about 2X that of the S&P 500.
- just 0.32% of those annual returns go to Uncle Sam each year.
So that's why Morningstar rates this a 5-star ETF, meaning historical returns (3 years) in the top 10% of peers.
But why does Morningstar rate QQQ neutral? Because its analysts don't think there is anything about how QQQ operates to make it likely to beat most growth ETFs in the coming years.
Are Morningstar analysts high? Have you seen those 5, 10, and even 15-year returns? 16% to 19% annual returns! From a tax-efficient ETF that charges a 0.2% expense ratio. That's one 10th of the 2% that most hedge funds charge and QQQ is running circles around hedge funds!
But here's why I agree with Morningstar.
The Nasdaq 100 isn't designed for excellence; it's designed for one thing. Owning the 100 largest Nasdaq-listed companies. That's it.
It's not designed to be a growth ETF. It will never own Mastercard (MA) or UnitedHealth ( UNH ), or Lowe's ( LOW ).
And while the last 10 and 15 years saw the dominance of big tech, and thus Invesco QQQ Trust ETF became one of the most concentrated and high flyers ETFs on earth.
QQQ is designed to be a concentrated portfolio of Nasdaq-listed companies. There are no quality, valuation, or growth screens.
QQQ's dominance in the last 15 years was pure luck, luck that the biggest tech names that were most dominant chose to list on the Nasdaq instead of the New York Stock Exchange.
And lucky that big tech has remained the growth driver of the global economy for so long.
Morningstar
Consumer Cyclical is AMZN and TSLA, and communication is GOOG, META, and NFLX.
All told, true big tech exposure is close to 80%.
But who cares?! Have you seen those returns?! People buying the QQQ or QQQM (the 0.15% expense ratio version) have been minting money, and nothing else matters.
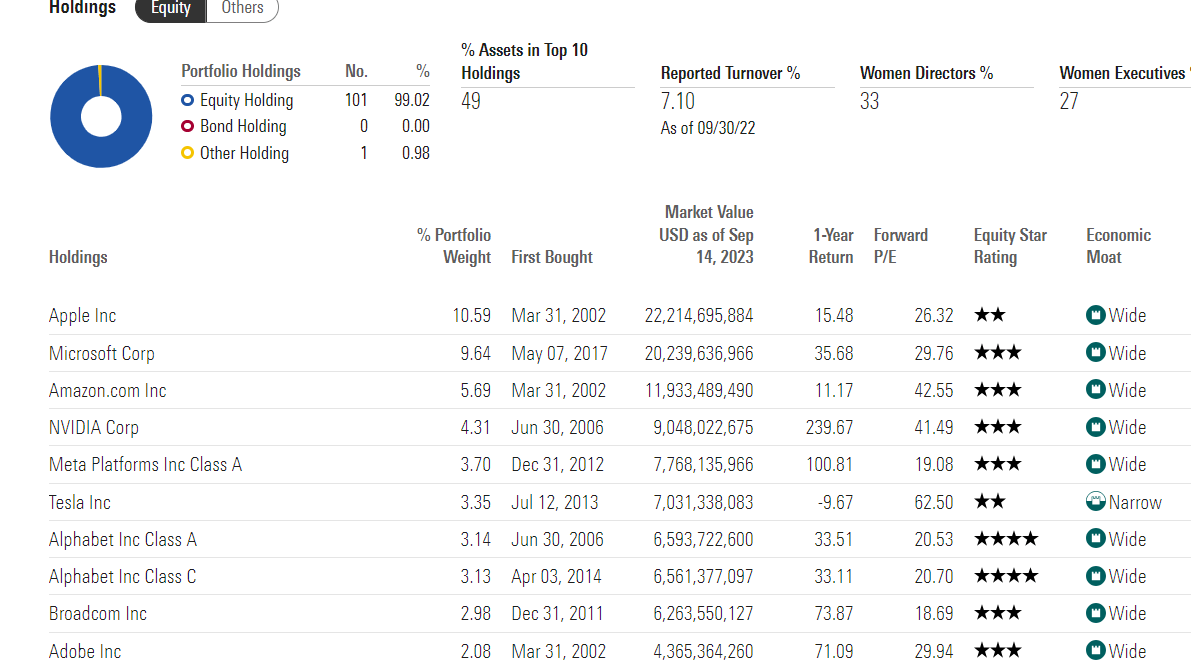
Let me ask you this? Do you like Apple? Not the products, but the stock? The company? If you're like most growth investors, you LOVE Apple.
But Apple isn't a growth stock anymore. Yet, it's the biggest holding in the QQQ. 11% of Nasdaq 100 is now sitting in a 9% growing company.
I love Apple, too, but I think most growth investors will agree single-digit growth means you better be a good dividend stock if you're worth buying.
Apple is yielding 0.6%, similar to Mastercard, which is growing 2X faster and is not owned by QQQ, and it never will be.
- MA = NYSE.
This is what Morningstar is talking about with its neutral rating. QQQ isn't a growth ETF, not by design.
Imagine if Apple for some reason sees its growth slow to 5% but the market cap remains huge. Then QQQ could keep owning Apple forever, even though 5% growth is pretty weak.
Growth ETFs (like SCHG) will screen out Apple if its growth gets too low. QQQ will own Apple forever as long as its market cap is high.
The Current Biggest Problem With The Nasdaq 100 ETF
You might be thinking this is all hypothetical. Apple is always going to be a winner, and QQQ at 80% big tech is the greatest ETF ever invented, and you can just own QQQM (save 0.05% in expenses) and call it a retirement plan.
Morningstar
QQQ is trading at 26X forward earnings. So what? The index average is 29X, and maybe QQQ is cheap.
Actually the 20-year average forward P/E on the QQQ is 20X.
- QQQ is 30% historically overvalued.
Now the good news is that Morningstar analysts think that the QQQ as its currently built, will deliver 12.4% long-term returns and 13.3% long-term total returns.
That would be consistent with its 36-year historical returns. Great! Just buy QQQM and call it a retirement plan!
Not so fast.
Since its inception, QQQ has delivered just 9% annual returns, not 13.5%. Why the big difference?
Because QQQ launched in 1999, at the tail end of the tech bubble.
Historical Returns Since 1999
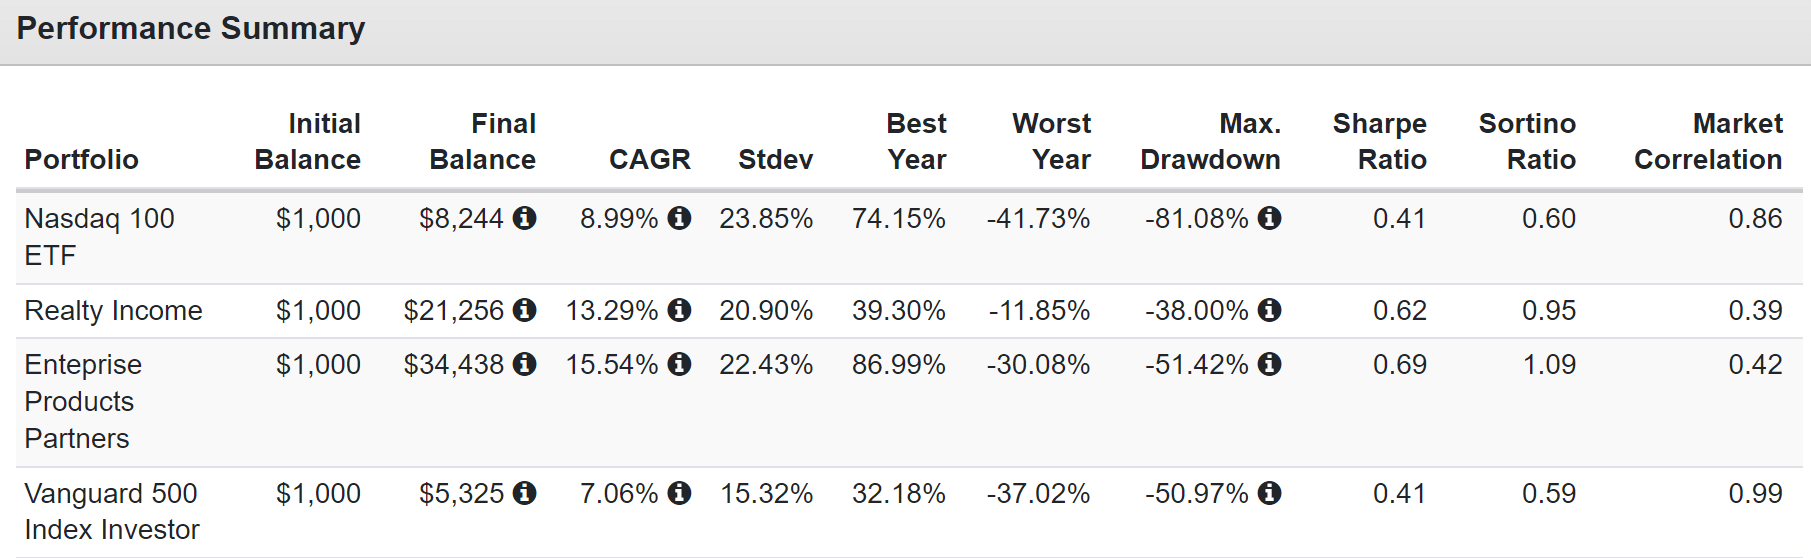
The S&P became 50% historically overvalued during the tech bubble, and the Nasdaq even more.
That's why the S&P fell 50% in the tech crash while the Nasdaq fell a staggering 81%.
Some beloved tech stars like Amazon fell 93%.
In contrast, value stocks like Realty Income and Enterprise Products Partners were 50% undervalued and trading at 11% and 12% yields, respectively.
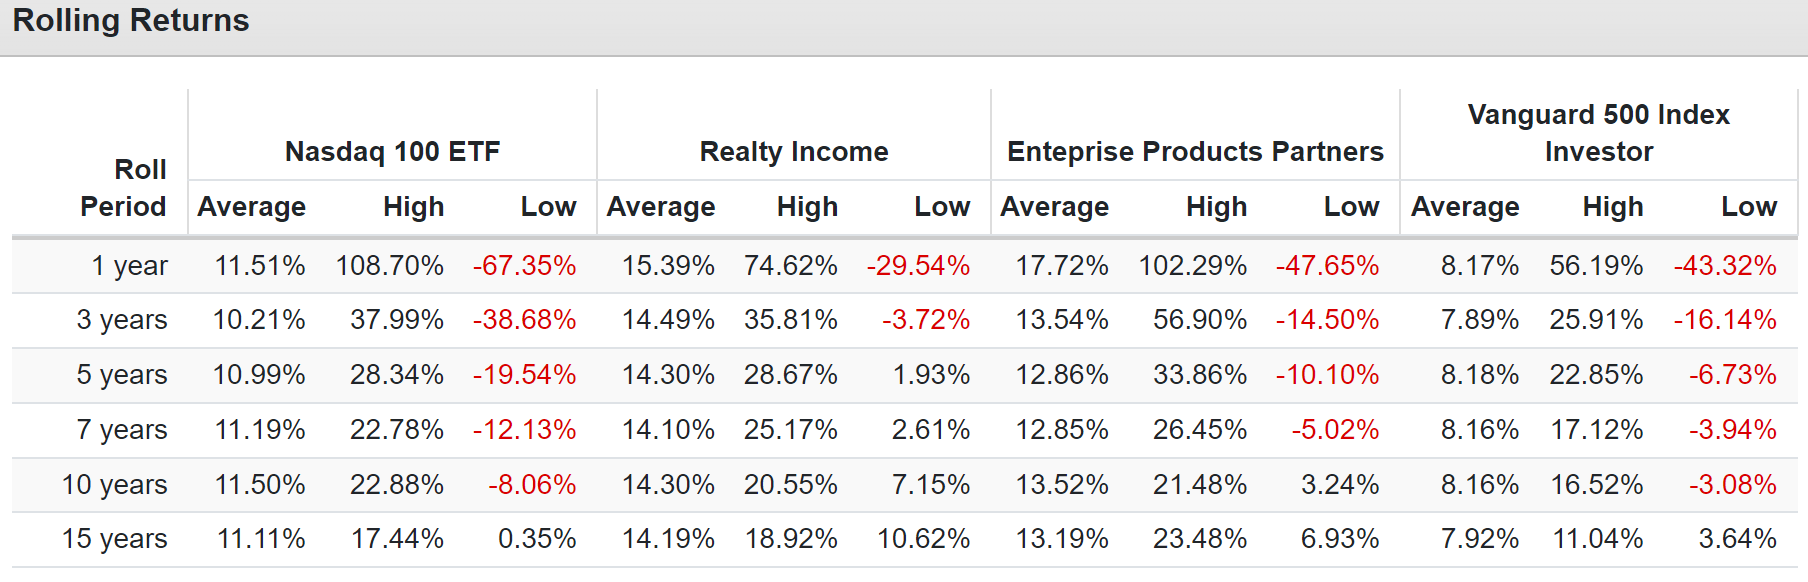
Thanks to the tech crash and the Great Recession crash, the average 12-month return for QQQ is 11.5%. It's still much better than the S&P 500's 8.2% but nothing like the 15% to 18% that O or EPD were cranking out.
Don't get me wrong, I'm not saying that O or EPD can keep delivering 15% to 18% annual returns from here because they can't.
Don't expect 17% annual returns for the next 15 years.
- Nasdaq's P/E would have to climb to 50X
- a 150% historical premium
- 3X the S&P's tech bubble record high overvaluation.
Just be aware that this was the best 15-year rolling return in QQQ history, and that means reversion is likely to return in much weaker future returns.
And given that QQQ is 30% overvalued, the short-term return could suck.
How Long A 30% Premium Is Going To Hurt You If You Buy QQQ Today
| Time Frame (Years) |
| Annual Valuation Drag (30%) |
| Annual Valuation Drag (50%) |
| 5 |
| -5.1% |
| -7.8% |
| 10 |
| -2.6% |
| -4.0% |
| 15 |
| -1.7% |
| -2.7% |
| 20 |
| -1.3% |
| -2.0% |
| 25 |
| -1.0% |
| -1.6% |
| 30 |
| -0.9% |
| -1.3% |
(Source: Money Chimp.)
If you buy the QQQ's today, unless in the future, for some reason that wasn't true in the last 20 years, it keeps trading at 26X earnings forever, you will see your returns eroded even for the next 30 years.
Why SPGP Is A Growth ETF You Can Safely Buy Today
SPGP is what I call a Super GARP or growth at a reasonable price ETF. It combines both quality and value and growth screens to create a portfolio that has historically been in the top 10% of growth ETF peers.
Morningstar is confident it will continue to outperform thanks to a solid management team running a time-tested and sound investing strategy.
So what exactly is this Super GARP strategy?
The Index is composed of approximately 75 securities in the S&P 500® Index that have been identified as having the highest “growth scores” and “quality and value composite scores." - Invesco.
I like how the ETF is passively tracking a soundly designed but rules based index.
So how is the GARP index built? What are the screening qualifications for quality, value, and growth?
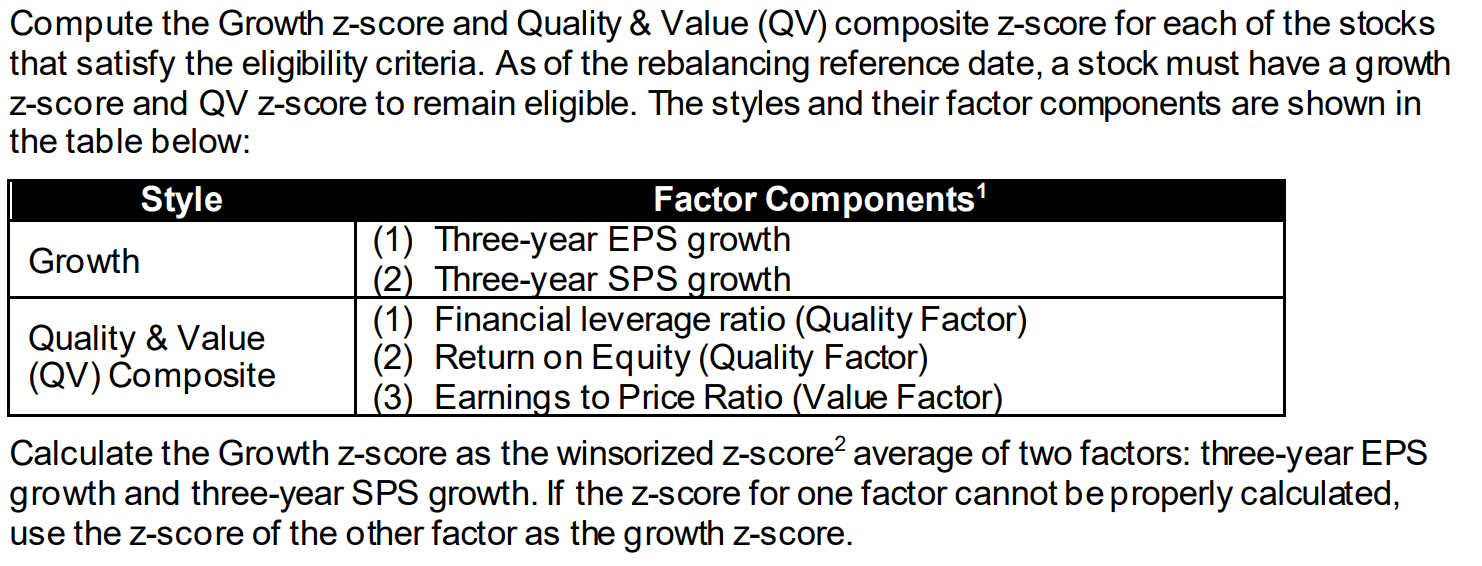
3 year EPS growth is a reasonable way to judge growth. It will prevent stocks like IBM who have seen growth go negative for over half a decade make it into the index. But it won't kick out a company who has a bad year or two.
I'm not a fan of share price returns over 3 years, as that's a momentum factor not necessarily a sign of growth or quality.
Debt/EBITDA is an important balance sheet safety factor though I would imagine credit ratings would be a more holistic approach to balance sheet safety.
Return on equity is a popular measure of profitability and quality through FCF margins would have been better.
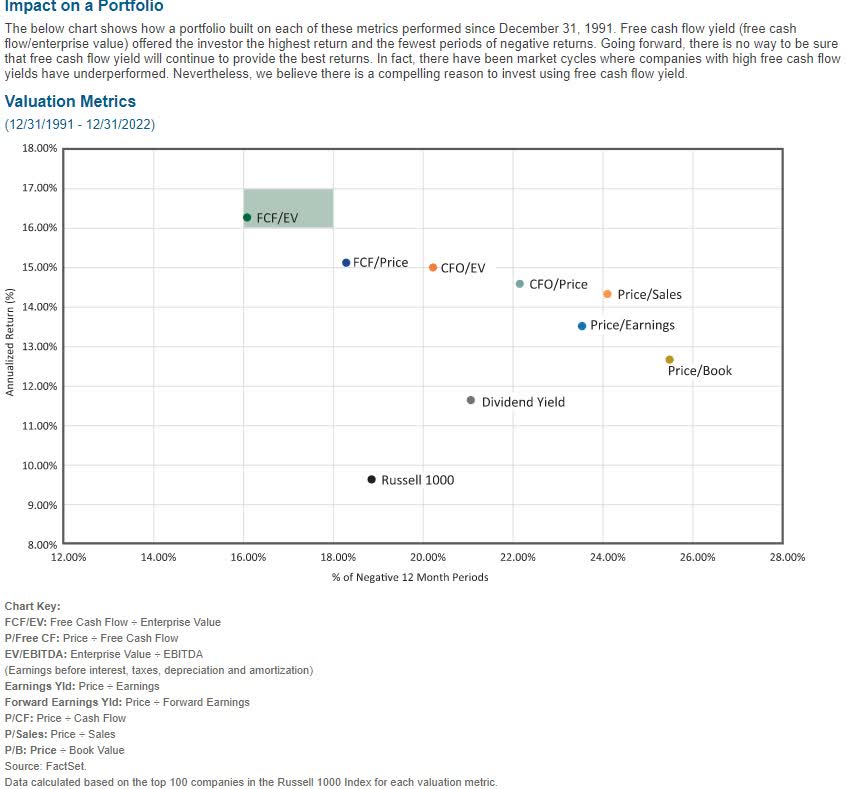
The PE ratio is a fine value metric, though FCF/EV is the best historical value ratio to use.
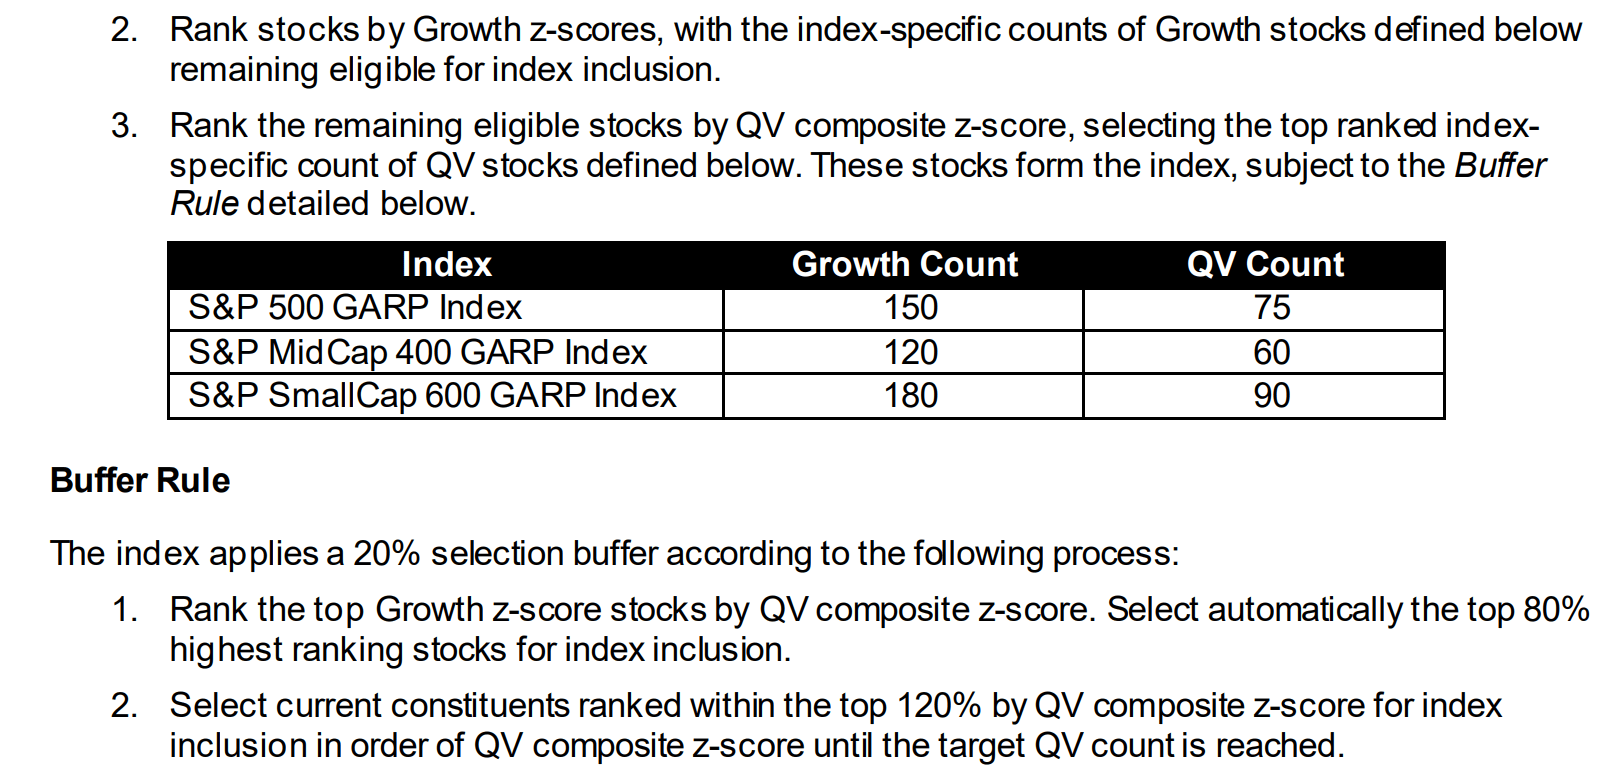
S&P has a multi-step process in which it uses the standard deviations of growth rates to order 150 of the best growth stocks in the S&P and then cuts those in half selecting the top 75 by quality.
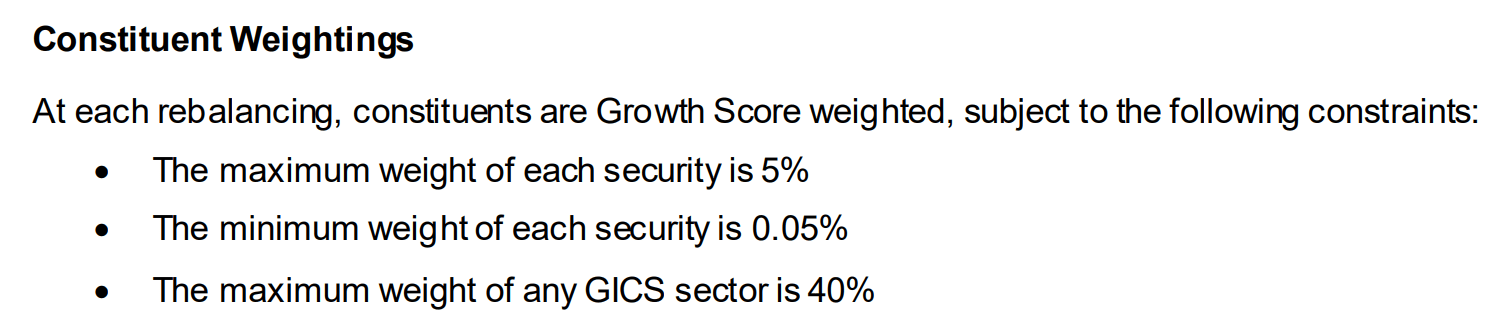
A 5% max risk cap is used and no sector can get above 40%.
With 75 stocks in the portfolio this seems like a pretty reasonable safety limit.
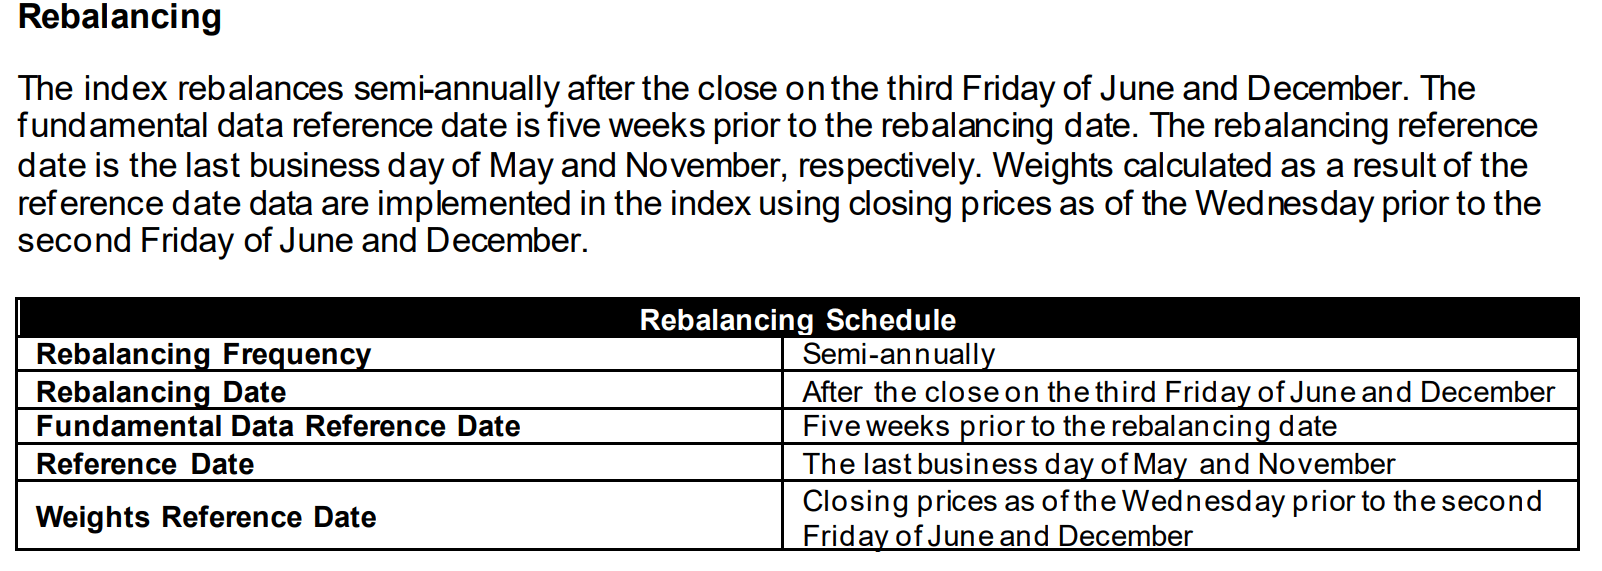
Some strategy ETFs like OMFL or COWZ or VFLO will rebalance every quarter but SPGP rebalances every 6 months, which should help a bit with tax efficiency.
SPGP switched benchmarks in June 2019 so the 3 year timeframe is the longest we have for how its current strategy is doing.
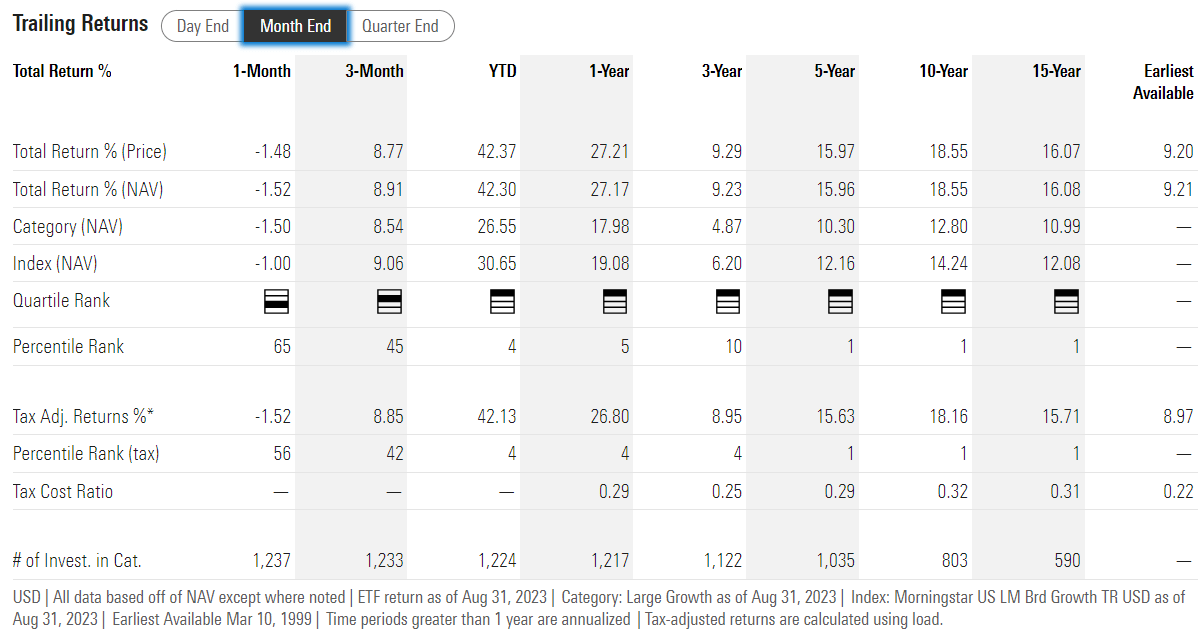
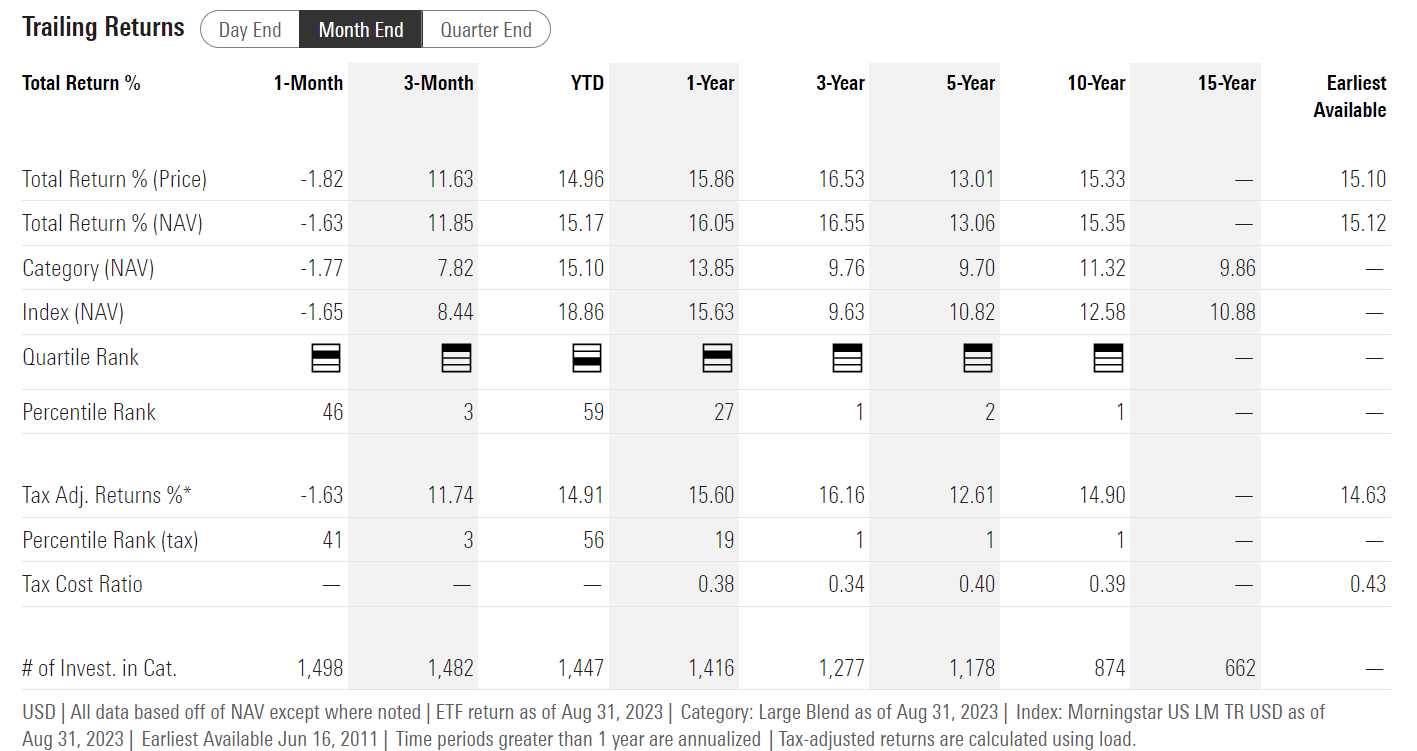
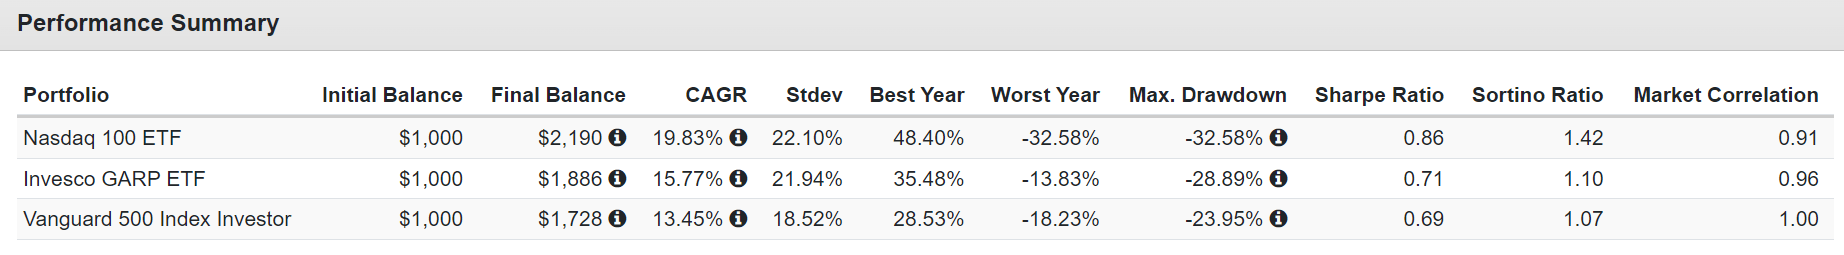
Over the last 3 years SPGP has delivered a 17% annual return, matching the Nasdaq.
Its tax efficiency is nearly identical separated by 0.1% per year.
If you want to give credit to management for their skill, you could look at the 5 and 10 year and even 12 year returns which are an impressive 13%, 15%, and 15% annually.
We're talking Nasdaq like returns and consistently in the top 1% of peers on a tax-adjusted return basis.
In fact, in the last 3 years SPGP was competing with 1,276 other growth ETFs and it managed to get into the top 12.
OK, so what? Lots of growth ETFs were red hot for the last decade or 15 years. That might be true, but how many own companies like this?
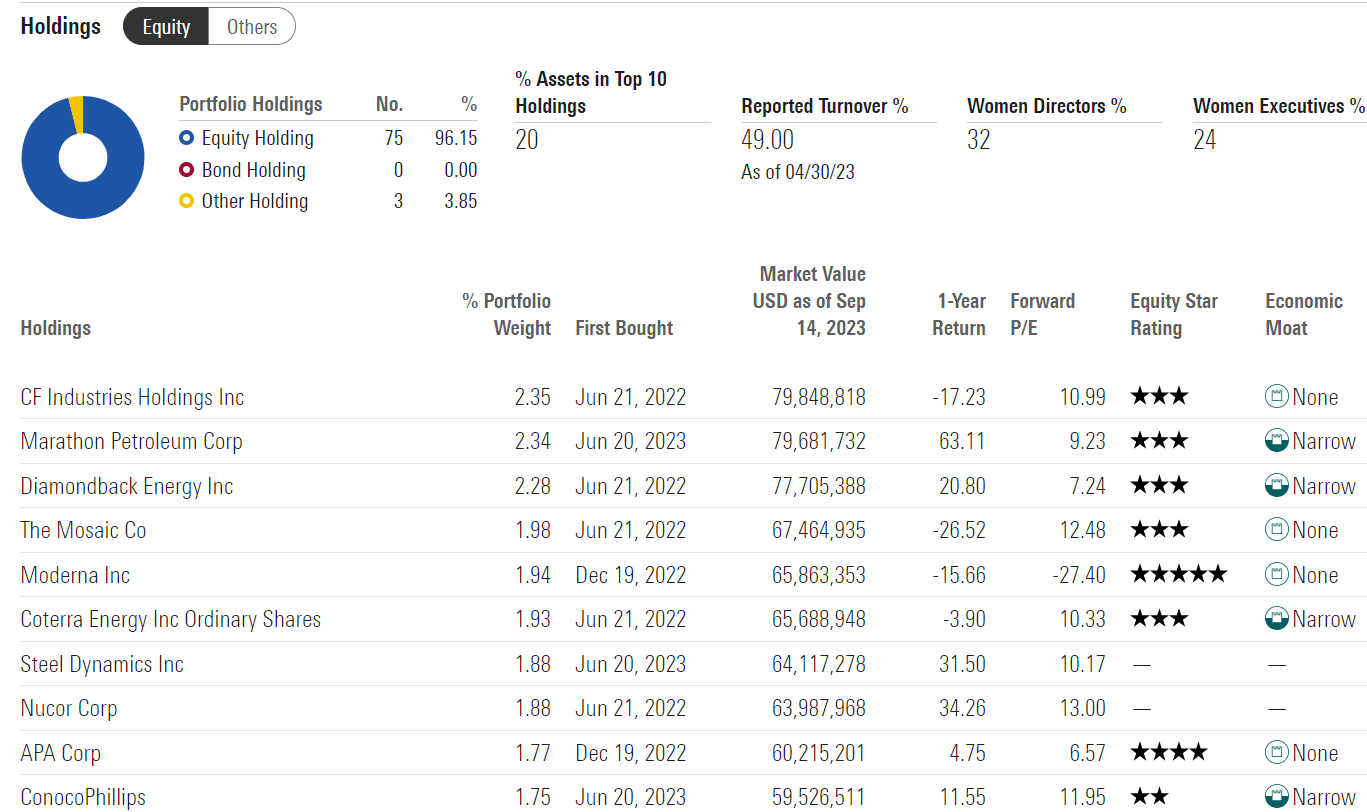
The top 10 of the Nasdaq are largely the same as the S&P.
SPGP's portfolio looks nothing like the S&P or Nasdaq or almost any other growth ETF.
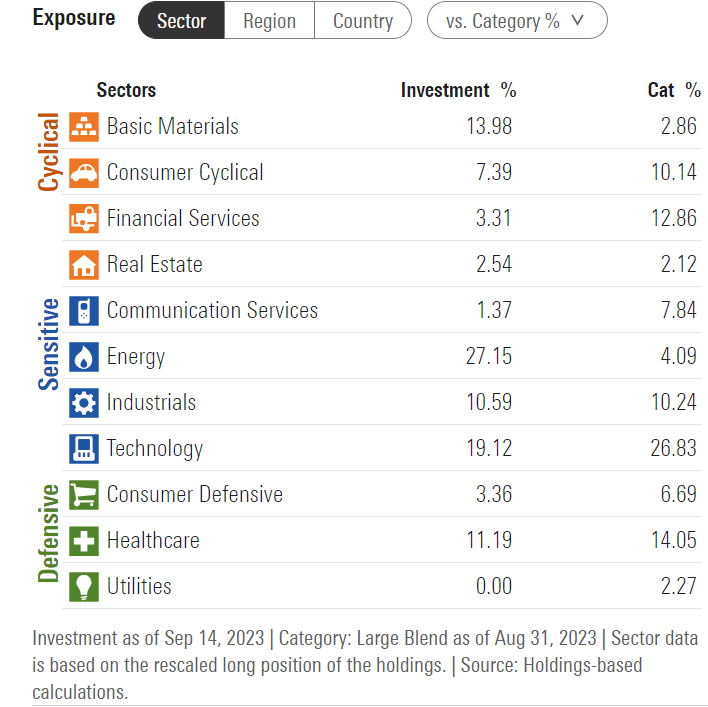
SPGP is about 20% tech and 27% energy so you can see how it's not scared to get cyclical.
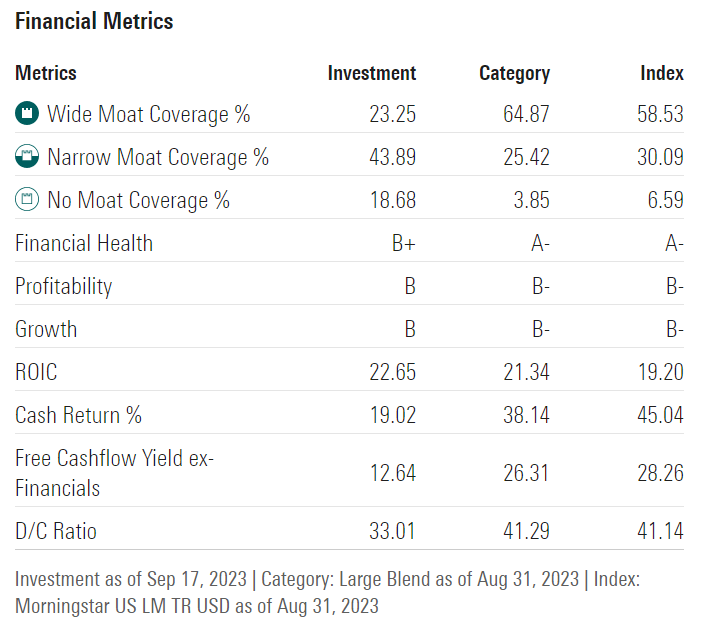
SPGP isn't sacrificing quality for growth or value, as you can see by some very nice moatiness (for a cyclical ETF no less), strong financial health, and safe payout ratios of 33% and a very nice return on invested capital of 23%.
Which Would You Rather Buy?
| ETF |
| Forward PE |
| Growth Consensus (Morningstar) |
| PEG Ratio |
| Invesco GARP ETF |
| 13.4 |
| 19.0% |
| 0.71 |
| Nasdaq 100 ETF |
| 26 |
| 13.4% |
| 1.94 |
| S&P 500 |
| 19 |
| 8.5% |
| 2.24 |
(Source: Morningstar.)
SPGP has 1/3rd the PEG ratio of the S&P.
The S&P is 15% historically overvalued, the Nasdaq 100 30%, and SPGP is 19% historically undervalued.
The mirror image of the S&P 500 but with 2.5X faster growth according to Morningstar's analysts.
Historical Returns Since June 21st, 2019 (When SPGP Started Using the GARP Index)
SPGP has delivered 16% annual returns and currently Morningstar thinks the current portfolio could deliver 22% returns in the future.
The last 3 years were some of the best in Nasdaq's history. If you think the Nasdaq has a prayer of delivering 20% long-term returns I have a bridge in Manhattan to sell you;)
The Downside To SPGP And Why It's Not Right For Everyone
SPGP's turnover is 50% as you'd expect from an ETF that rebalances twice a year, through a comprehensive multi-factor approach.
The actual effects on taxes are not very significant but for the most part the Nasdaq will always own the same stuff.
SPGP, OMFL, COWZ, VFLO, and MOAT, are all "strategy" ETFs. They use a rules based approach to stock selection.
SPGP's method for selecting a 75 stock portfolio is complex enough that pretty much every time it rebalances it's a 50% new portfolio.
If you like to know what you own SPGP isn't for you. If you like investing in proven strategies? Then this ETF could be your cup of tea.
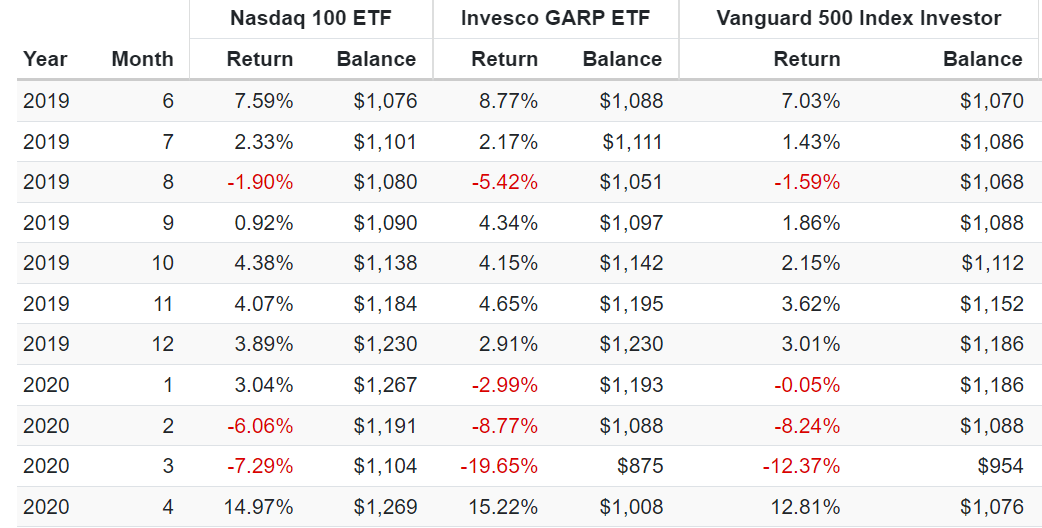
Cyclical stocks can fall off a cliff very quickly when recession strikes. During the Pandemic SPGP fell 20% in March, and that includes a strong last week rally.
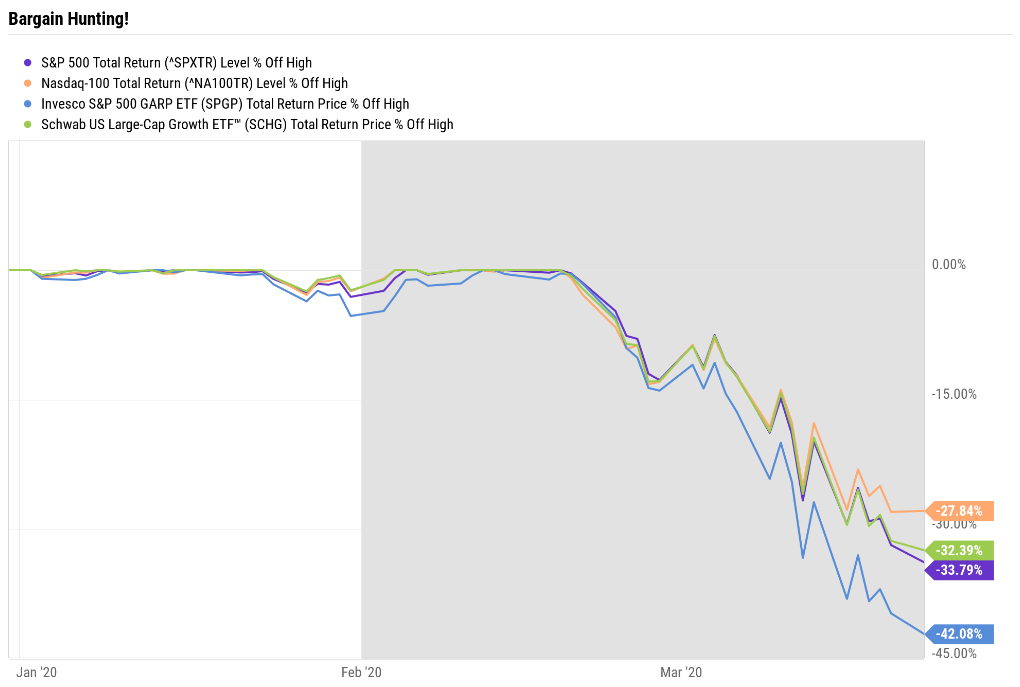
SPGP fell as much as 42% at one point in the Pandemic.
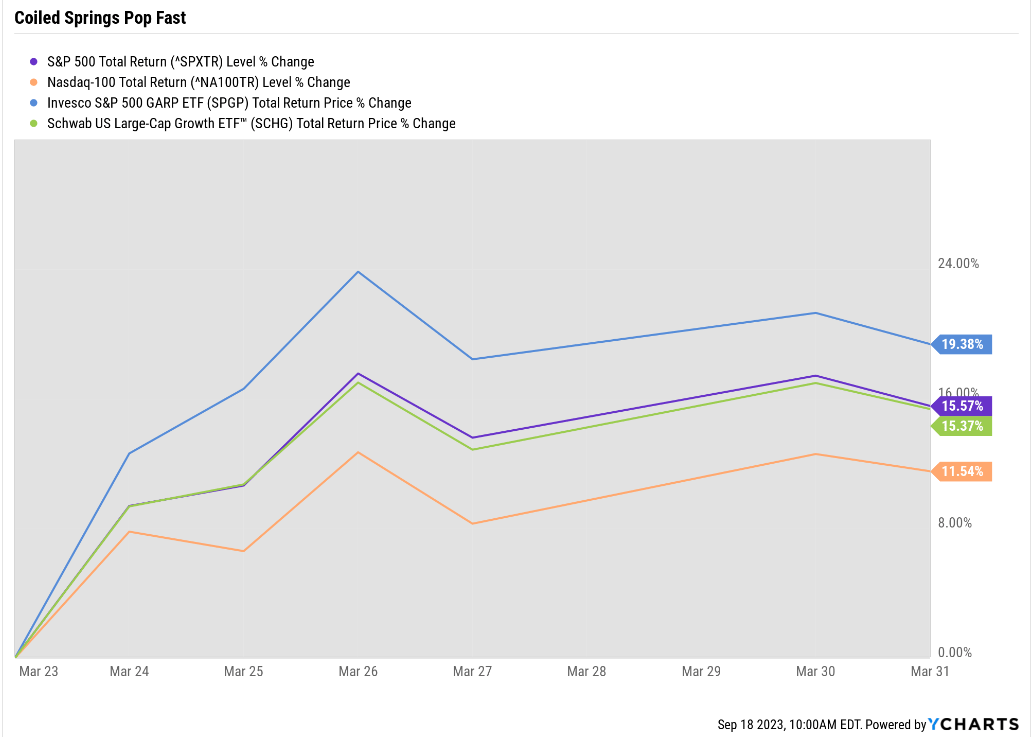
SPGP soared 20% in the final week of March, showing the power of ultra-value cyclicals to really pop after the market bottoms.
Bottom Line: If You Want Great Growth At A Great Price, SPGP Is A Wonderful Choice
ETFs seldom get more than 16% undervalued, historically speaking.
SPGP is currently 26% undervalued, making it a potentially Ultra Value, Buffett-style "fat pitch" opportunity.
Is it a core ETF? Not if you want to always know what you own.
But SPGP is one of the noble nine ETFs that I trust in my family's charity hedge fund.
Why? Because SPGP is a Super GARP ETF that has managed to deliver the goods for 12 years and even when it changed indexes, it just kept right on delivering long-term Nasdaq-Beating returns.
During one of the hottest tech rallies in history that is absolutely incredible.
This is a growth ETF whose strategy is miles above the Nasdaq's simplistic and antiquated approach.
The 100 largest Nasdaq listed companies, with zero care for quality, or growth, or value, is like the Dow Jones Industrial Average.
- 30 companies selected by committee and then share price weighted.
The Dow has done well over time. In fact, it's almost matched the S&P long-term.
But would I recommend anyone buy DIA, the down ETF? No, it's a fundamentally flawed ETF.
SPGP runs circles around Nasdaq in terms of strategy, and I'm confident that over time it will prove that combining growth, value, and quality is the far superior strategy.
For further details see:
Forget The Nasdaq And Buy SPGP Instead