FSM - Fortuna Silver Mines Q2: Turning To West Africa For Growth
2023-08-17 11:33:29 ET
Summary
- Fortuna Silver Mines released its second quarter 2023 results, reporting revenues of $158.41 million and a net income of $3.14 million.
- The company produced 64,348 ounces of gold and 1,262,561 ounces of silver in 2Q23.
- Gold and silver prices have been under pressure in the third quarter due to the Fed's hawkish position on inflation.
- I recommend buying Fortuna Silver Mines shares between $2.82-$2.70, with likely lower support at $2.55.
Part I - Introduction
Fortuna Silver Mines (FSM) released its second-quarter 2023 results on August 9, 2023.
Note: This article is an update of my article published on May 19, 2023. I have followed FSM on Seeking Alpha since Dec. 2021.
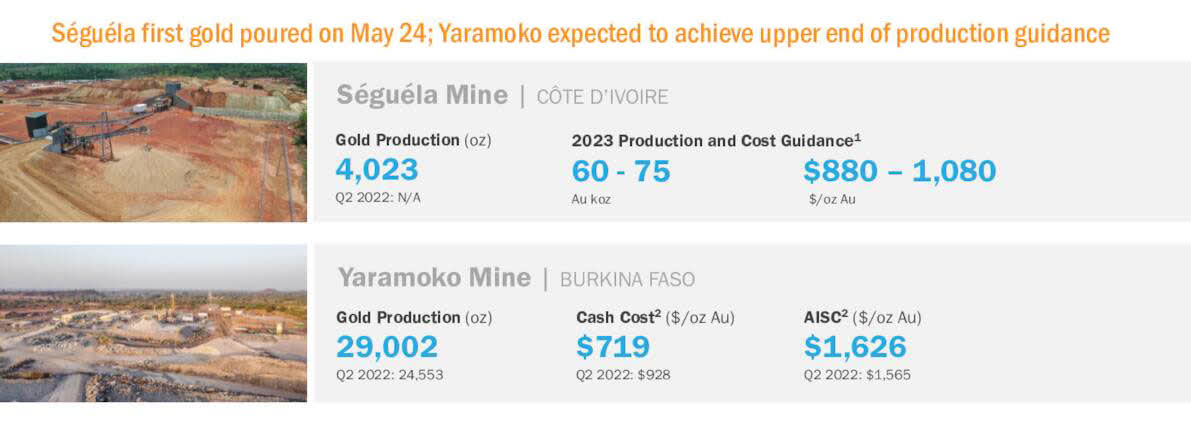
Fortuna Silver Mines owns five production mines, including the Séguéla Mine in Ivory Coast, which started to produce on May 24, 2023, with 4,023 Au Oz in 2Q23. Two mines are now operating in West Africa, soon to be a third one with the Chesser's acquisition.
On May 8, 2023, Fortuna Silver Mines announced the acquisition of Chesser Resources (West Africa) in an all-shares deal:
The acquisition of Chesser will expand the Fortuna Silver Mines Inc. presence in West Africa to include the preliminary economic assessment stage of the Diamba Sud Gold Project in Senegal, West Africa, one of the region's new and emerging gold discoveries. Closing of the sale should be in September 2023.
FSM Operation West Africa (FSM Presentation)
The proven and probable mineral reserves at the Seguela gold mine were estimated to be approximately 12.1 million tonnes, grading 2.8 g/t gold with 1.1 million ounces (Moz) in contained gold as of March 2021. Yearly production is estimated at 120K Au ounces.
CEO Jorge Alberto Ganoza said in the conference call:
Our strategic expansion of the business into West Africa is going to start paying off. We now have two operating mines in the region and starting in Q3, West Africa becomes our largest contributor to free cash flow and our recent agreement to acquire Chesser Resources and the advanced exploration stage the Diamba Sud project in Senegal, which is set to close in September, adds to our exciting regional exploration and growth pipeline.
1 - Second-Quarter 2023 Highlights
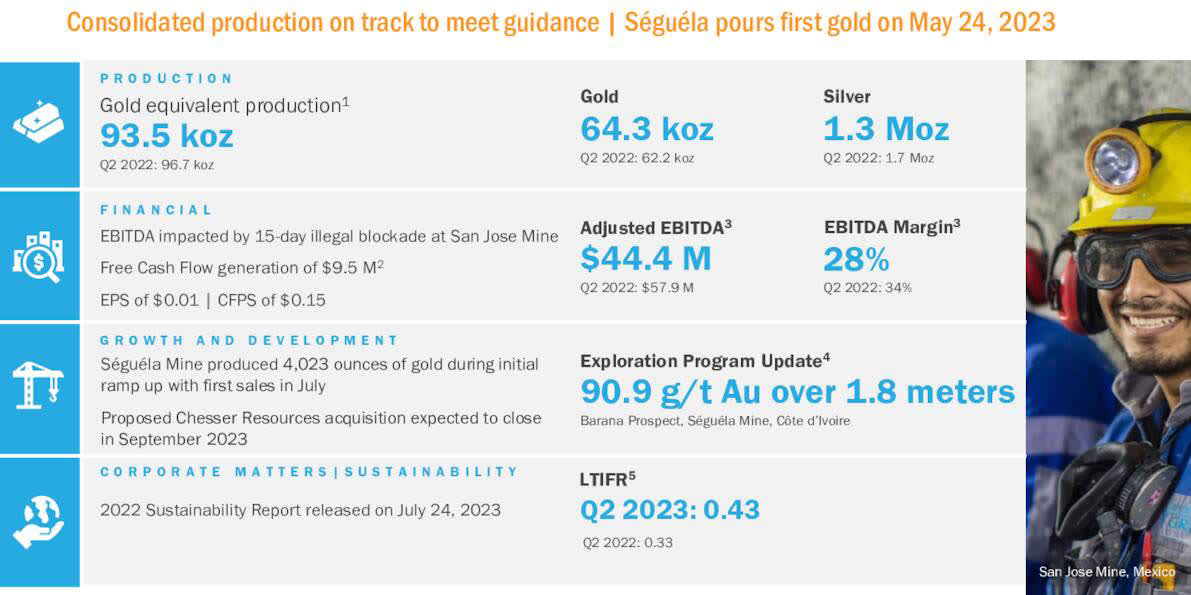
Fortuna Silver Mines' revenues were $158.41 million, with a net income of $3.14 million or $0.01 per diluted share in 2Q23. It compares to a net income of $2.33 million, or $0.01 per diluted share, in the same quarter a year ago.
FSM 2Q23 Highlights (FSM Presentation)
Fortuna produced 64,348 Au ounces and 1,262,561 Ag ounces in 2Q23. This represents 93,454 GEOs compared to 96,712 GEOs in 2Q22.
CEO Jorge Alberto Ganoza said in the conference call:
The highlights of the quarter is our first gold pour at the newly use Séguéla Mine for sure. This took place on May 24th as we released. Séguéla was delivered on budget and slightly ahead of schedule.
Séguéla is a flagship asset for the company having high margin gold ounces for over a decade of mining to our portfolio.
2 - Gold and Silver Prices under pressure in 3Q23
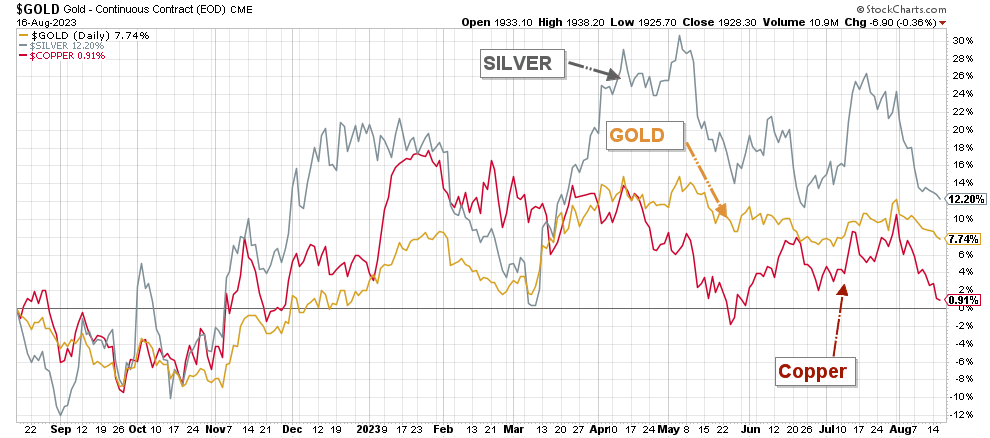
Due to the Fed's hawkish position against rampant inflation, gold and silver prices dropped significantly in 2022.
However, the situation drastically changed in early 2023, with inflation slowly decreasing and the Fed searching for a new strategy. Unfortunately, the recent CPI numbers started to rise slightly in July due to higher oil prices, and the FED indicated further rate increases in 2023, weakening gold, which is now struggling to stay above $1,900 per ounce.
This trend will reverse in 2024 when the FED turns dovish and declares an indefinite pause.
FSM 1-Year Chart Gold, Silver, Copper (Fun Trading StockCharts)
3 - Stock Performance
Fortuna Silver Mines Inc. has retraced significantly since April 2023 and is now up 6% on a one-year basis. The recent selloff in gold and silver seems to be affecting the gold and silver miners exceptionally hard in the past few weeks.
Fortuna Silver Mines: Financials and Production in 2Q23 - The Raw Numbers
| FSM |
| 2Q22 |
| 3Q22 |
| 4Q22 |
| 1Q23 |
| 2Q23 |
| Total Revenues in $ Million |
| 167.9 |
| 166.57 |
| 164.72 |
| 175.65 |
| 158.41 |
| Net income in $ Million |
| 2.3 |
| -3.8 |
| -152.77 |
| 10.88 |
| 3.14 |
| EBITDA $ Million |
| 61.9 |
| 50.9 |
| -126.5 |
| 66.68 |
| 47.88 |
| EPS diluted in $/share |
| 0.01 |
| -0.01 |
| -0.52 |
| 0.04 |
| 0.01 |
| Cash from operating activities in $ Million |
| 47.4 |
| 64.7 |
| 49.6 |
| 41.76 |
| 44.23 |
| Capital Expenditure in $ Million |
| 54.0 |
| 58.9 |
| 73.3 |
| 61.55 |
| 67.48 |
| Free Cash Flow in $ Million |
| -6.6 |
| 5.7 |
| -23.7 |
| -19.79 |
| -23.26 |
| Total cash $ Million |
| 116.4 |
| 91.0 |
| 80.6 |
| 84.73 |
| 93.42 |
| Total debt in $ Million |
| 218.6 |
| 204.2 |
| 219.2 |
| 244.88 |
| 285.87 |
| Shares outstanding (diluted) in Million |
| 295.2 |
| 291.4 |
| 290.2 |
| 292.4 |
| 293.11 |
| Silver and Gold Production |
| 2Q22 |
| 3Q22 |
| 4Q22 |
| 1Q23 |
| 2Q23 |
| Silver Production in M Oz |
| 1,652,895 |
| 1,837.506 |
| 1,746,746 |
| 1,586,378 |
| 1,262,561 |
| Gold production in K Oz |
| 62,171 |
| 66,344 |
| 64,112 |
| 60,092 |
| 64,348 |
| GEOs Production in K Oz |
| 96,712 |
| 101,840 |
| 100,229 |
| 94,410 |
| 93,454 |
| Gold price realized $/Oz |
| 1,869 |
| 1,718 |
| 1,802 |
| 1,893 |
| 1,975 |
| Silver price realized $/Oz |
| 22.62 |
| 19.16 |
| 21,75 |
| 22.52 |
| 24.10 |
| Zinc M lbs |
| 10,886 |
| 11,885 |
| 12,575 |
| 13,051 |
| 10,207 |
| Lead M lbs |
| 7,637 |
| 9,085 |
| 8,735 |
| 9,509 |
| 14,037 |
Source: Company materials.
Part II - 2Q23 Gold and Silver Production Details
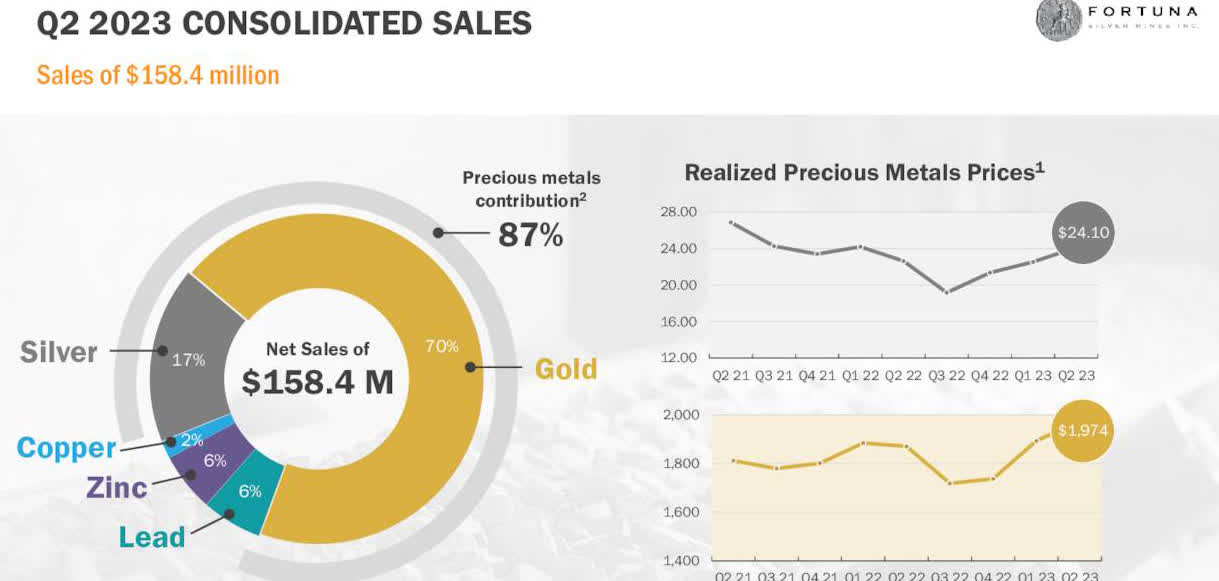
FSM Consolidated Sales 2Q23 (FSM Presentation)
1 - 2Q23 Gold and Silver Production
For 2Q23, Fortuna Silver Mines produced 1,262,561 ounces of silver and 64,348 ounces of gold . It translated to 93,454 GEOs , down 3.4% YoY.
FSM Quarterly GEO Production History (Fun Trading)
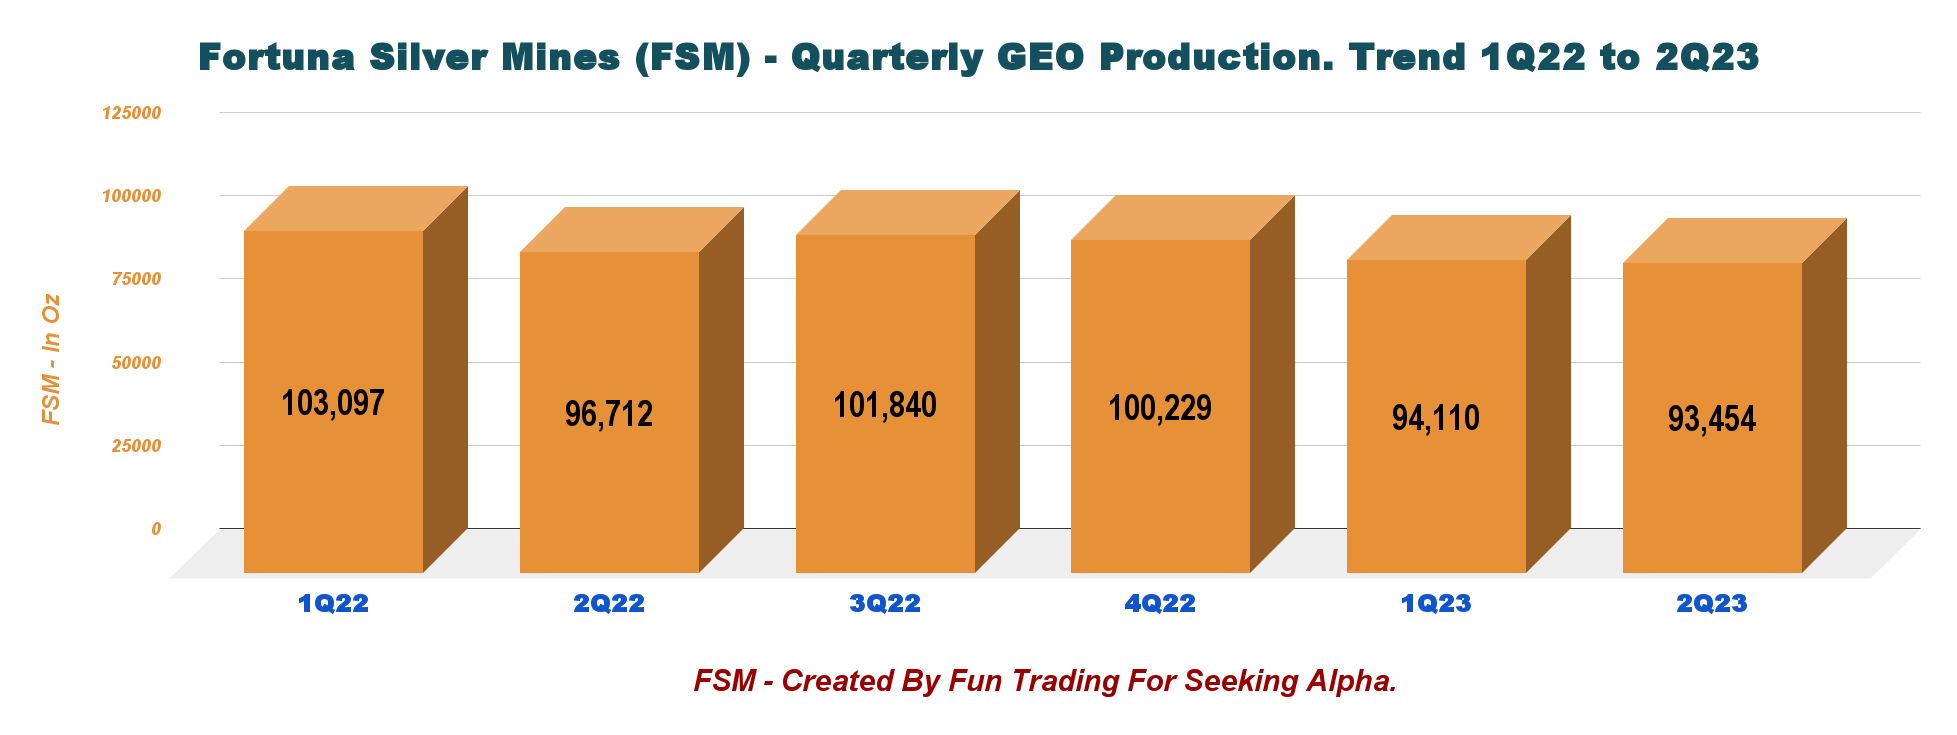
GEOs include gold, silver, lead, and zinc and are calculated using the following metal prices: $1,975/oz Au , $24.10/oz Ag , $0.96/t Pb , and $1.23/t Zn or Gold/Silver ratio of 1:81.96 , Gold/Lead = 1:0.93 , Gold/Zinc = 1:0.73 .
FSM Quarterly Gold and Silver Production History (Fun Trading)
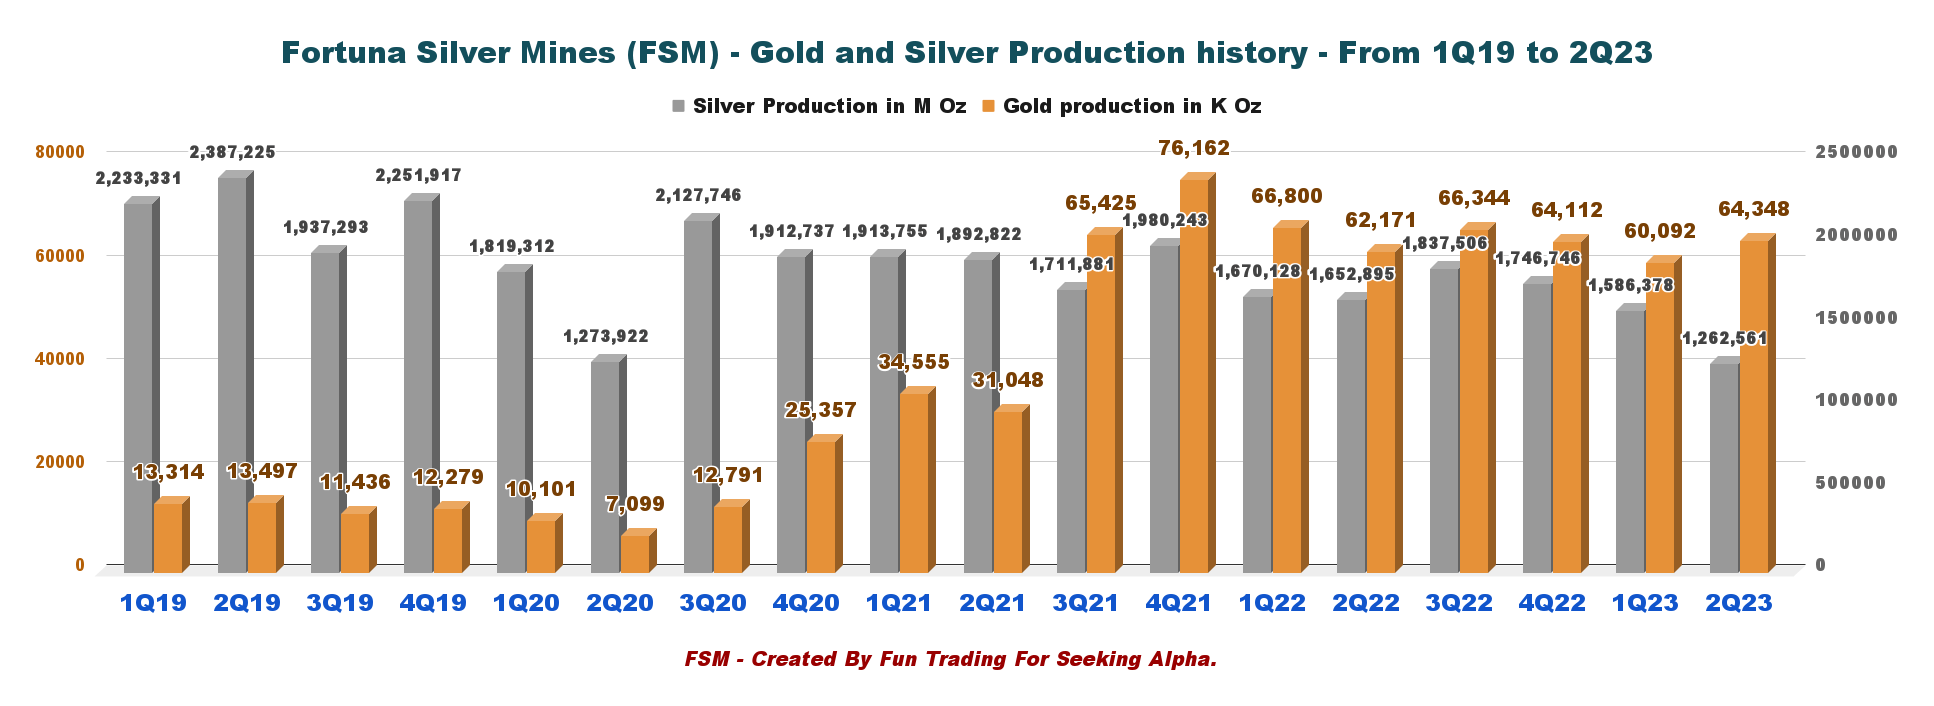
The higher year-over-year gold production is mainly due to the start of production at the Séguéla Mine , which offset lower gold and silver production from the San Jose Mine, impacted by a 15-day illegal union worker blockade.
In the second quarter, Séguéla Mine 383,100 tonnes of ore at an average grade of 2.35 grams per tonne and 877,143 tonnes of waste for a strip ratio of 2.3. Ore process was 19,605 tonnes, up 1.56 grams per tonne with 4,023 ounces being pour. (conference call)
Fortuna Silver Mines reiterates its 2023 annual production guidance range of 6.3 to 6.9 Moz of silver and 282K to 320K ounces of gold or between 412K and 463K gold equivalent ounces, including lead and zinc by-products.
FSM 2023 Guidance (FSM Presentation)
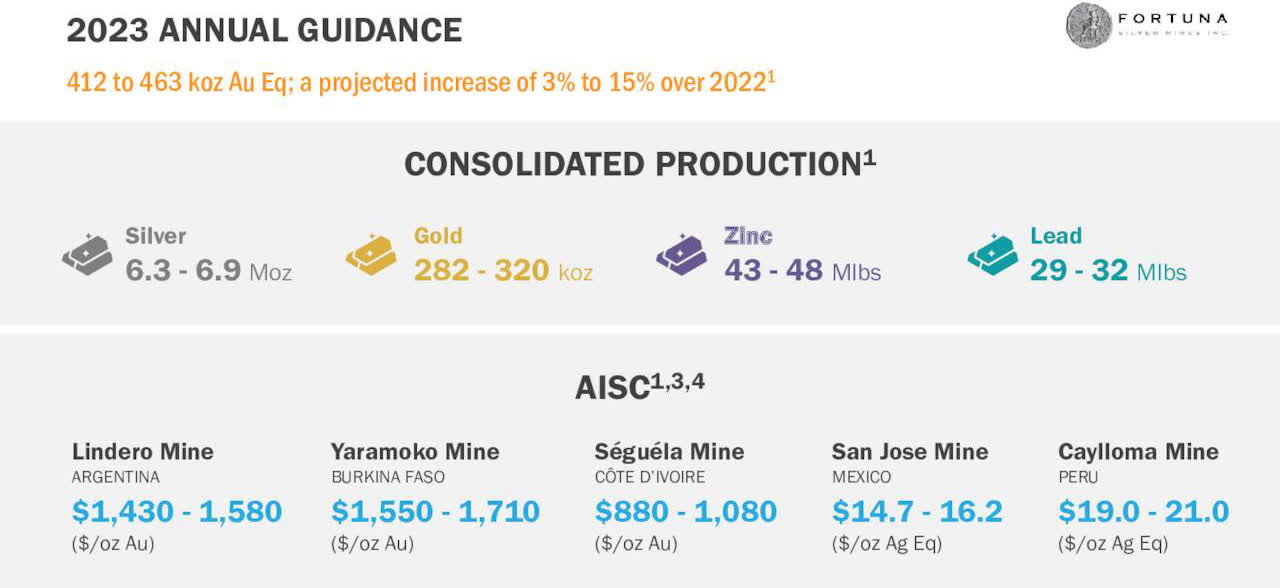
2 - Gold and Silver Prices History
The gold price was $1,975 per ounce , and the silver price was $24.10 per ounce .
FSM Quarterly Gold and Silver Prices History (Fun Trading)
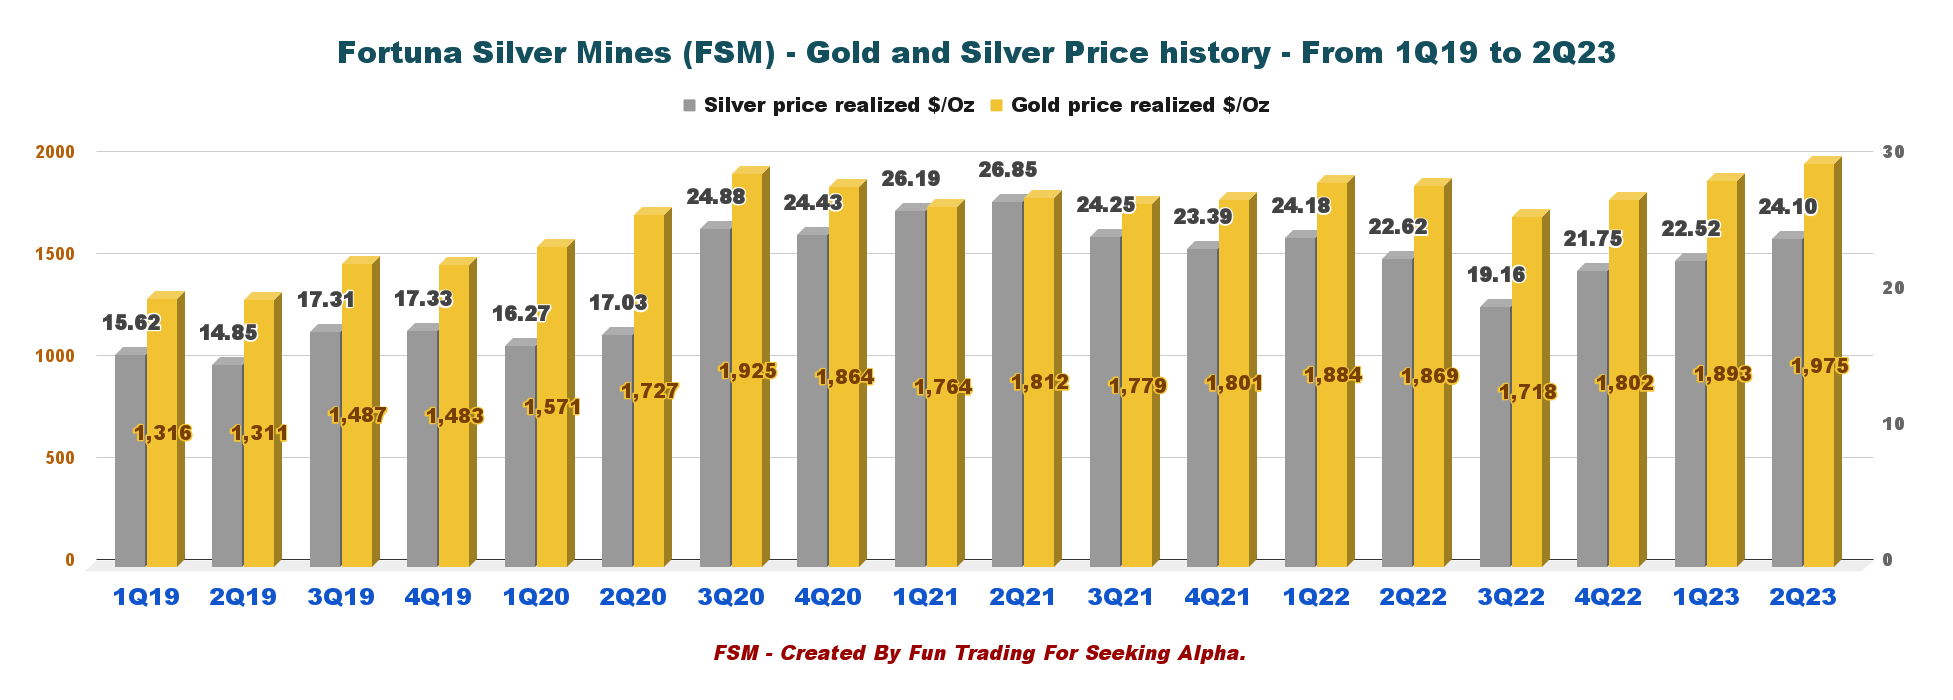
Our consolidated all-in sustaining cost is expected to have peaked in Q2 at $1,799 and to come down during Q3 and Q4 as the operational issues at San Jose and Yaramoko, were successfully resolved in the second quarter. Waste stripping at Lindero comes down, in the second half of the year as I previously mentioned. And more importantly, we start benefiting from the Séguéla Mine sales in the third quarter. (conference call)
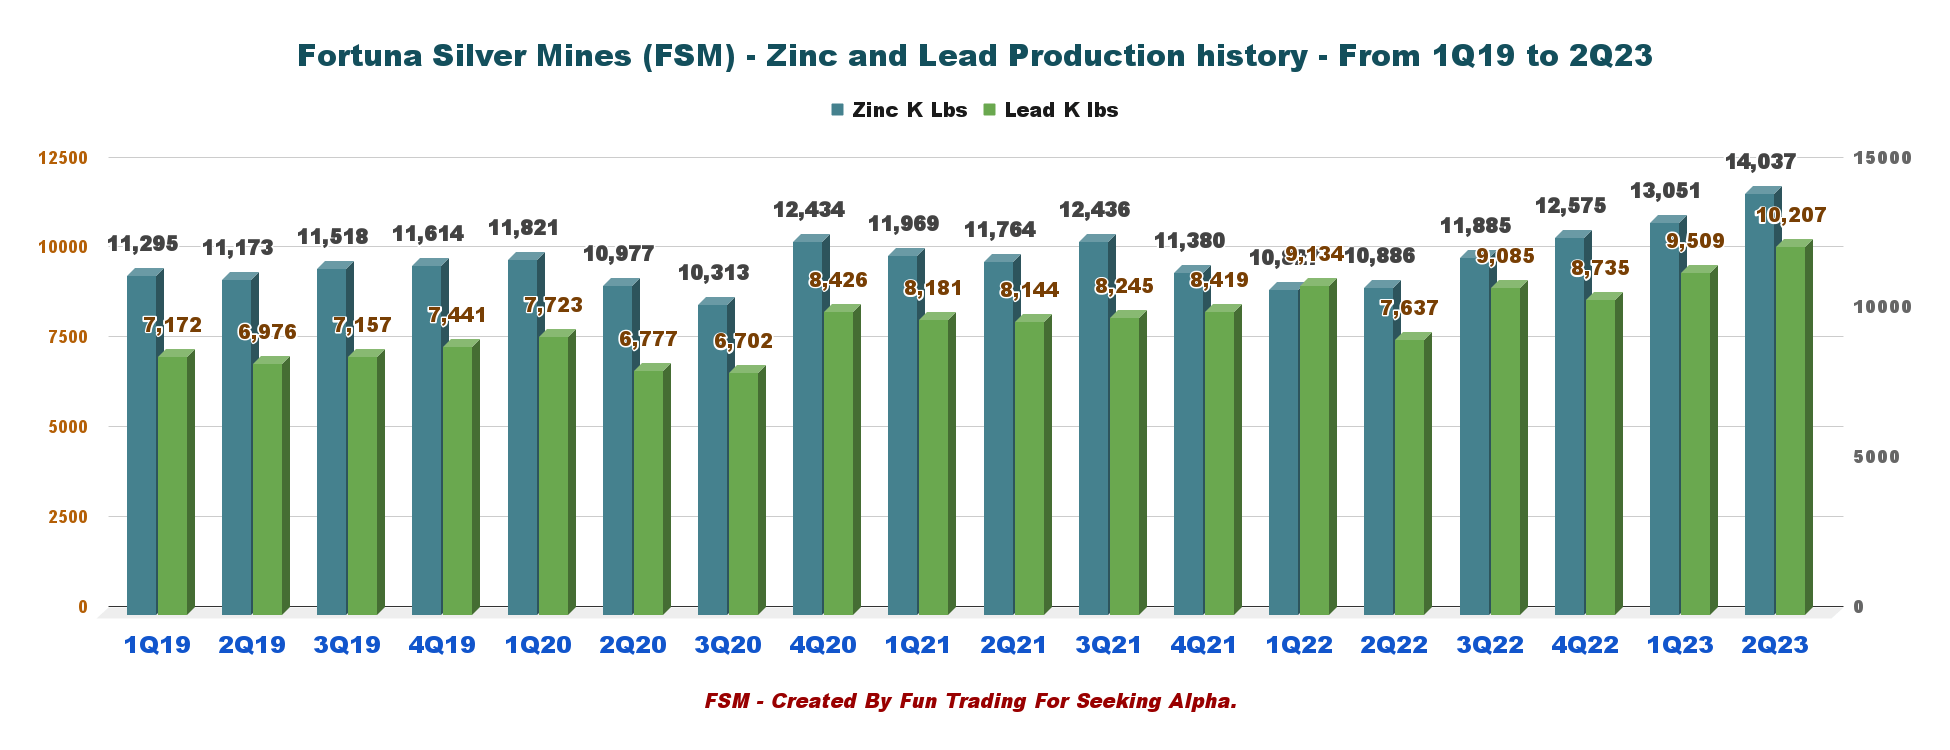
3 - Zinc and Lead Production History (Caylloma Mine)
Production in 2Q23 for lead was 10.207 Mlbs and 14.037 Mlbs for zinc.
FSM Quarterly Lead and Zinc Production History (Fun Trading)
4 - Details Per Mine and Metal Produced
| Production per mine |
| Gold Oz |
| Silver Oz |
| Lead KLbs |
| Zinc KLbs |
| Lindero Mine, Argentina |
| 25,456 |
| 0 |
| 0 |
| 0 |
| Yaramoko Complex Burkina Faso |
| 29,002 |
| 0 |
| 0 |
| 0 |
| San Jose Mine, Mexico |
| 5,778 |
| 957,265 |
| 0 |
| 0 |
| Séguéla Mine Côte d'Ivoire |
| 4,023 |
| 0 |
| 0 |
| 0 |
| Caylloma Mine Peru |
| 89 |
| 305,296 |
| 10,207.403 |
| 14,036.832 |
| Total |
| 64,348 |
| 1,262,561 |
| 10,207.403 |
| 14,036.832 |
Part III - Balance Sheet Commentary
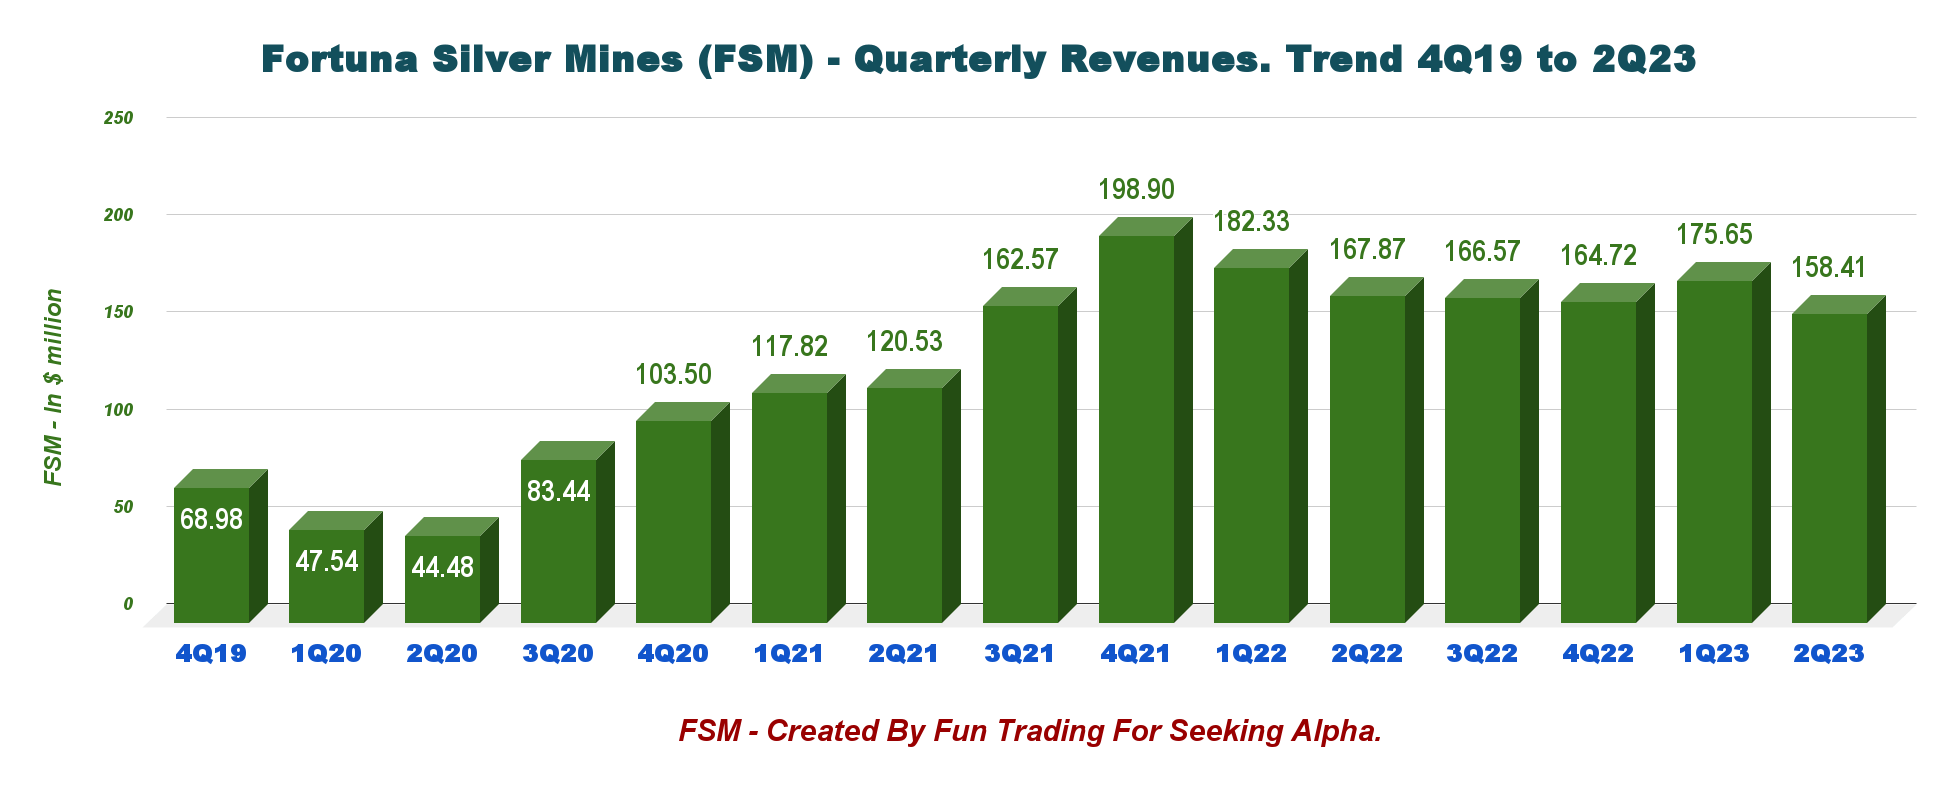
1 - Fortuna Silver Mines' Revenues were $158.41 Million in 2Q23
FSM Quarterly Revenue History (Fun Trading)
The net income was $3.14 million or $0.01 per share, compared with an income of $2.33 million or $0.01 per share reported in 2Q22.
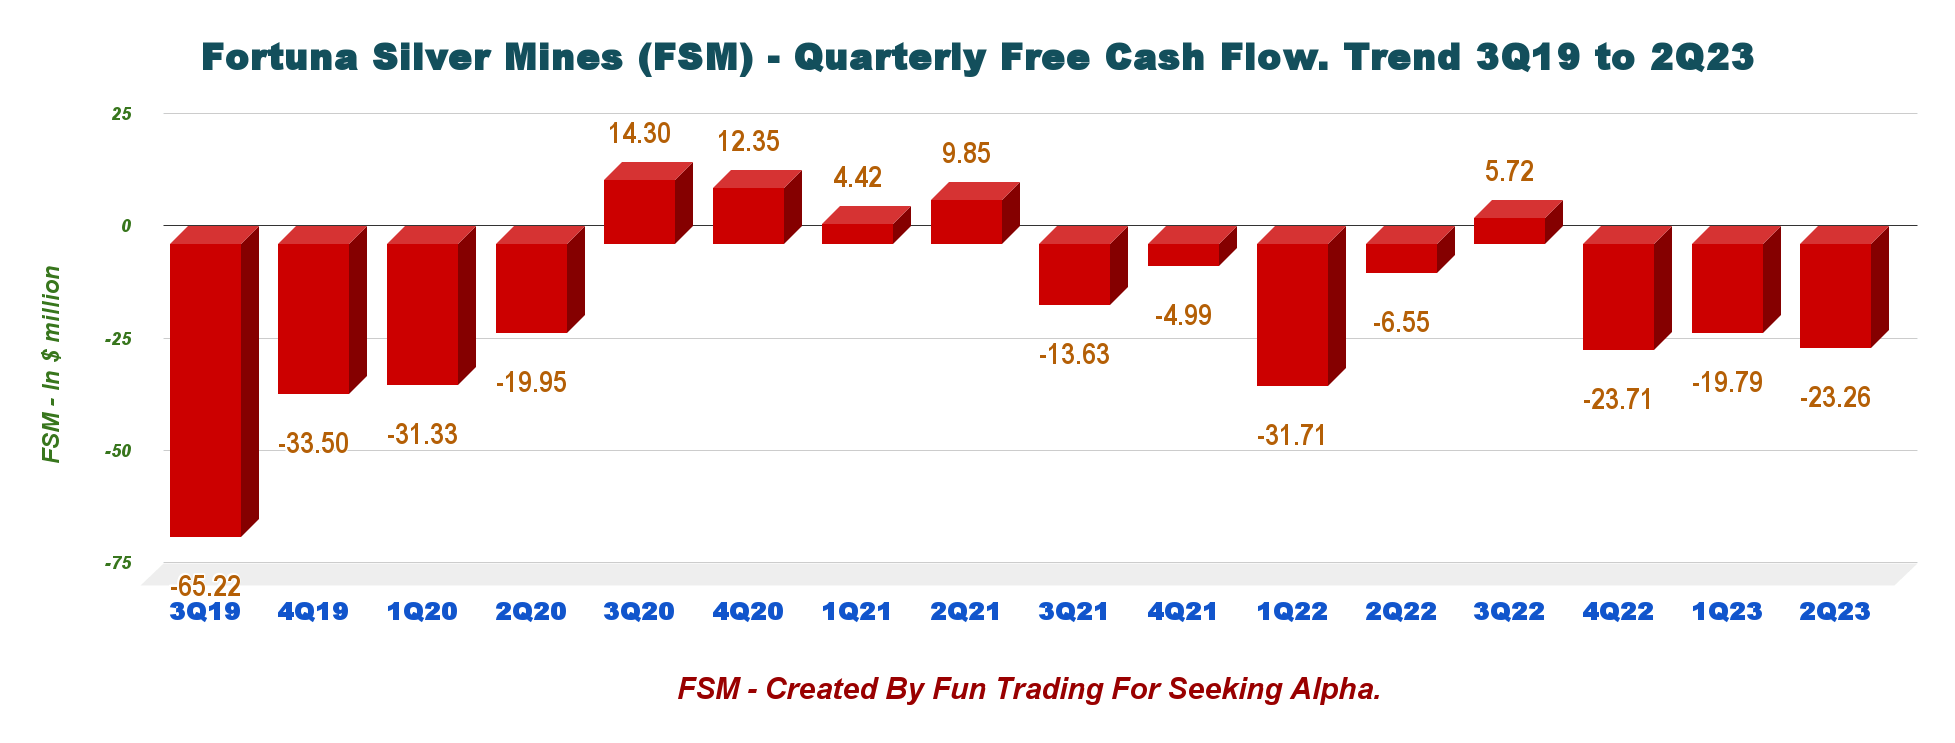
2 - Fortuna Silver Reported a 2Q23 Free Cash Loss of $23.26 Million
FSM Quarterly Free Cash Flow History (Fun Trading)
FSM's trailing 12-month free cash flow was negative $61.04 million, with a negative of $23.26 million in 2Q23.
Note: On May 2, 2022, the company initiated a share repurchase program to purchase up to 5% of its issued and outstanding common shares, expiring May 1, 2023, but renewed recently.
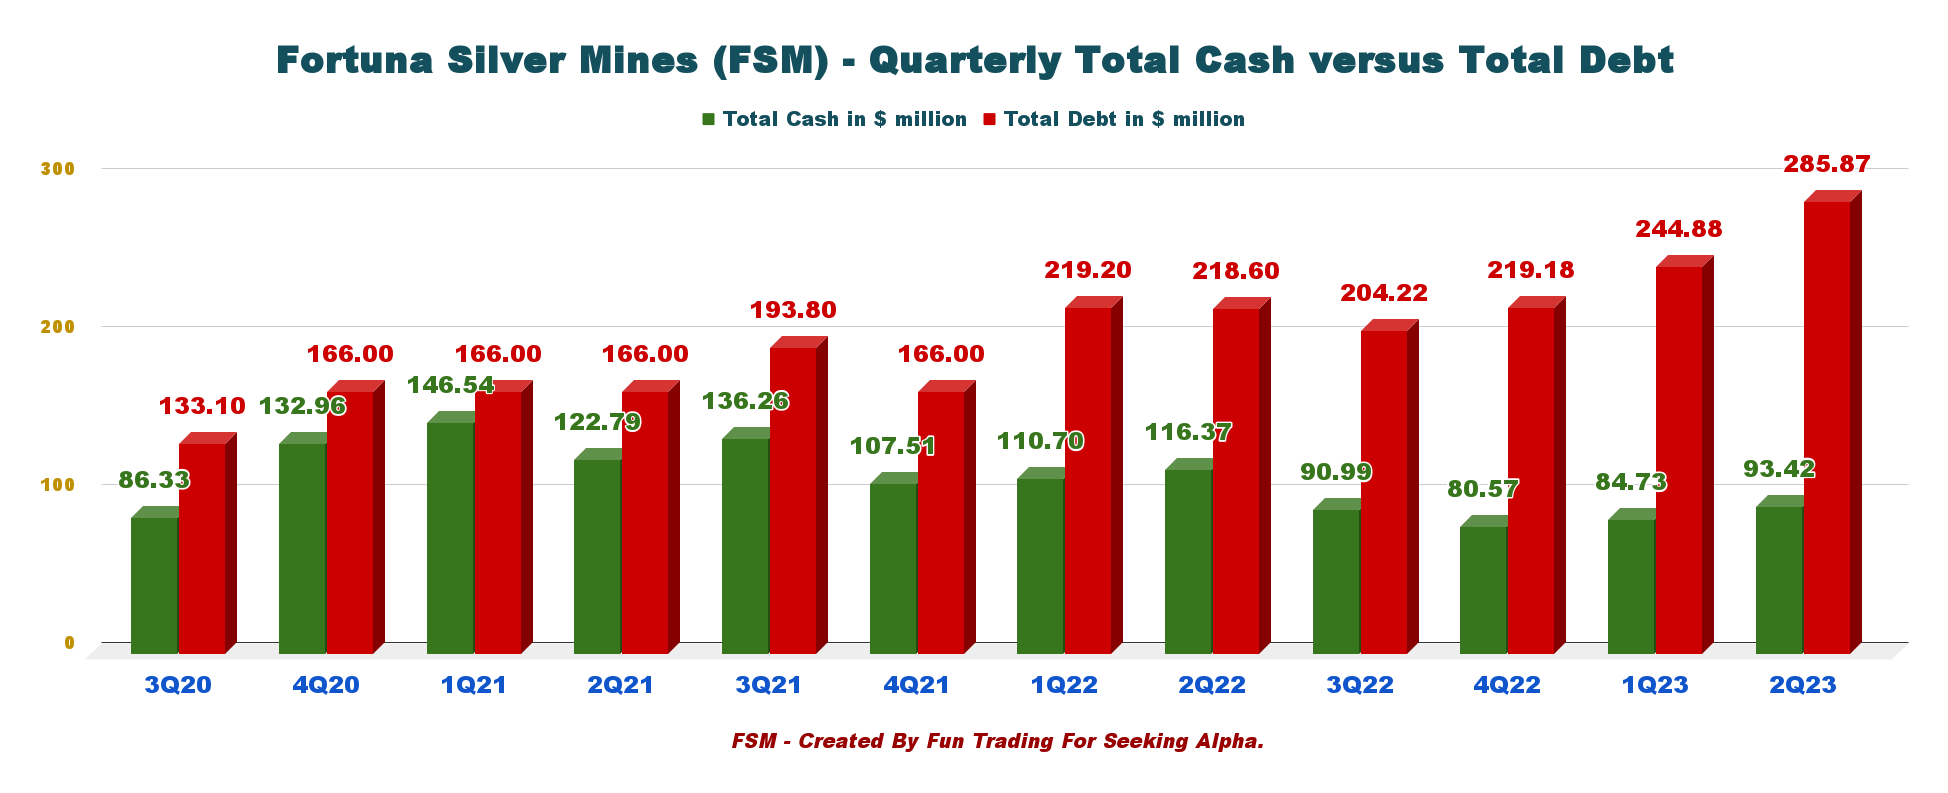
3 - Fortuna's Net Debt was $192.45 Million on June 30, 2023
FSM Quarterly Cash versus Debt History (Fun Trading)
As of June 30, 2023, the company had cash equivalents of $93.42 million and total debt of $285.87 million .
The total liquidity available to the Company as of June 30, 2023, was $97.9 million.
Total net debt, including the outstanding convertible debenture, is $198 million, resulting in a leverage ratio of total net debt to adjusted EBITDA of 0.9%.
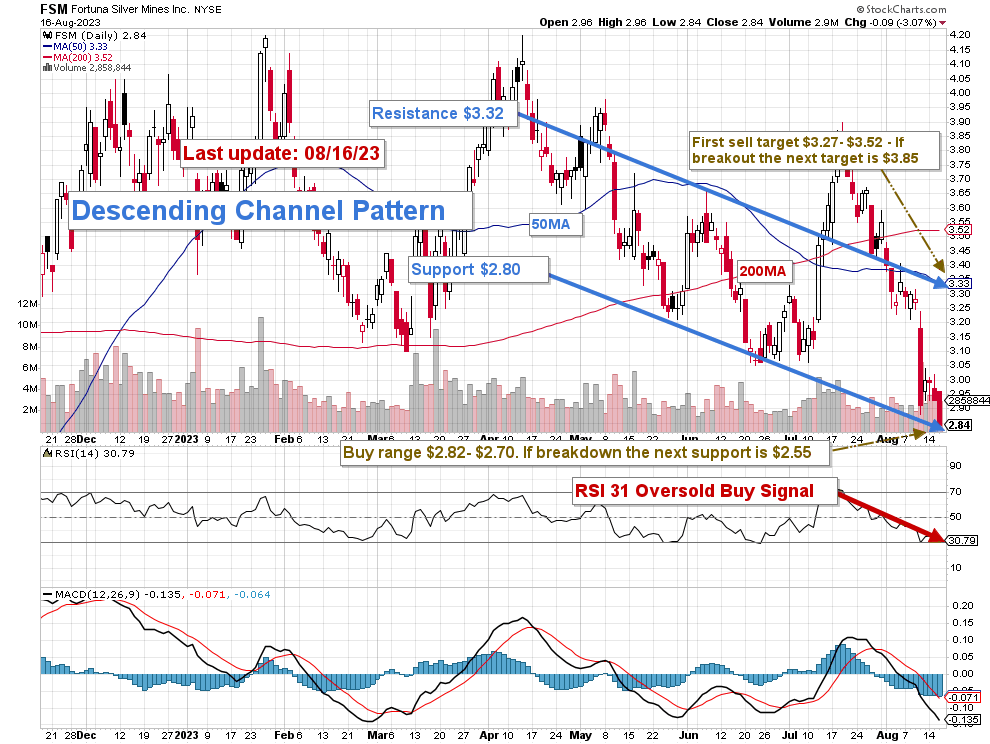
Part IV - Technical Analysis (Short Term) and Commentary
FSM TA Chart Short-Term (Fun Trading StockCharts) FSM forms a descending channel pattern with resistance at $3.32 and support at $2.80. RSI is now 31, indicating that FSM is oversold with a buy signal. Descending channel patterns are short-term bearish in that a stock moves lower within a descending channel, but they often form within longer-term uptrends as continuation patterns. Higher prices usually follow the descending channel pattern but only after an upside penetration of the upper trend line. I regularly promote the general strategy in my marketplace to keep a core long-term position and use about 40% to trade short-term LIFO. It allows you to wait for a higher final price target for your core position between $5 and $6, a possible target in 2023.
For the short-term trading, I suggest selling Fortuna Silver Mines Inc. stock partially between $3.27 and $3.52 with possible upper resistance at $3.85 and waiting for a retracement between $2.82-$2.70, with likely lower support at $2.55.
Watch the gold and silver prices like a hawk.
Warning: The TA chart must be updated frequently to be relevant. It is what I am doing in my stock tracker. The chart above has a possible validity of about a week. Remember, the TA chart is a tool only to help you adopt the right strategy. It is not a way to foresee the future. No one and nothing can.
For further details see:
Fortuna Silver Mines Q2: Turning To West Africa For Growth