FVI:CC - Fortuna Silver Mines: The Latin America Mines Underperformed This Quarter
2023-07-17 05:48:28 ET
Summary
- For 2Q23, Fortuna Silver Mines produced 1,262,561 ounces of silver and 64,348 ounces of gold. It translates to 93,454 GEOs, down 3.4% YoY.
- The higher year-over-year gold production is mainly due to the start of production at the Séguéla Mine.
- I recommend buying FSM between $3.15 and $3.00, with likely lower support at $2.75. For more frequent traders, I encourage buying at the mid-resistance/support at $3.39 (50MA).
Introduction
Fortuna Silver Mines ( FSM ) released its second-quarter 2023 production results on July 12, 2022 .
Note: This article updates my May 19, 2022 article.
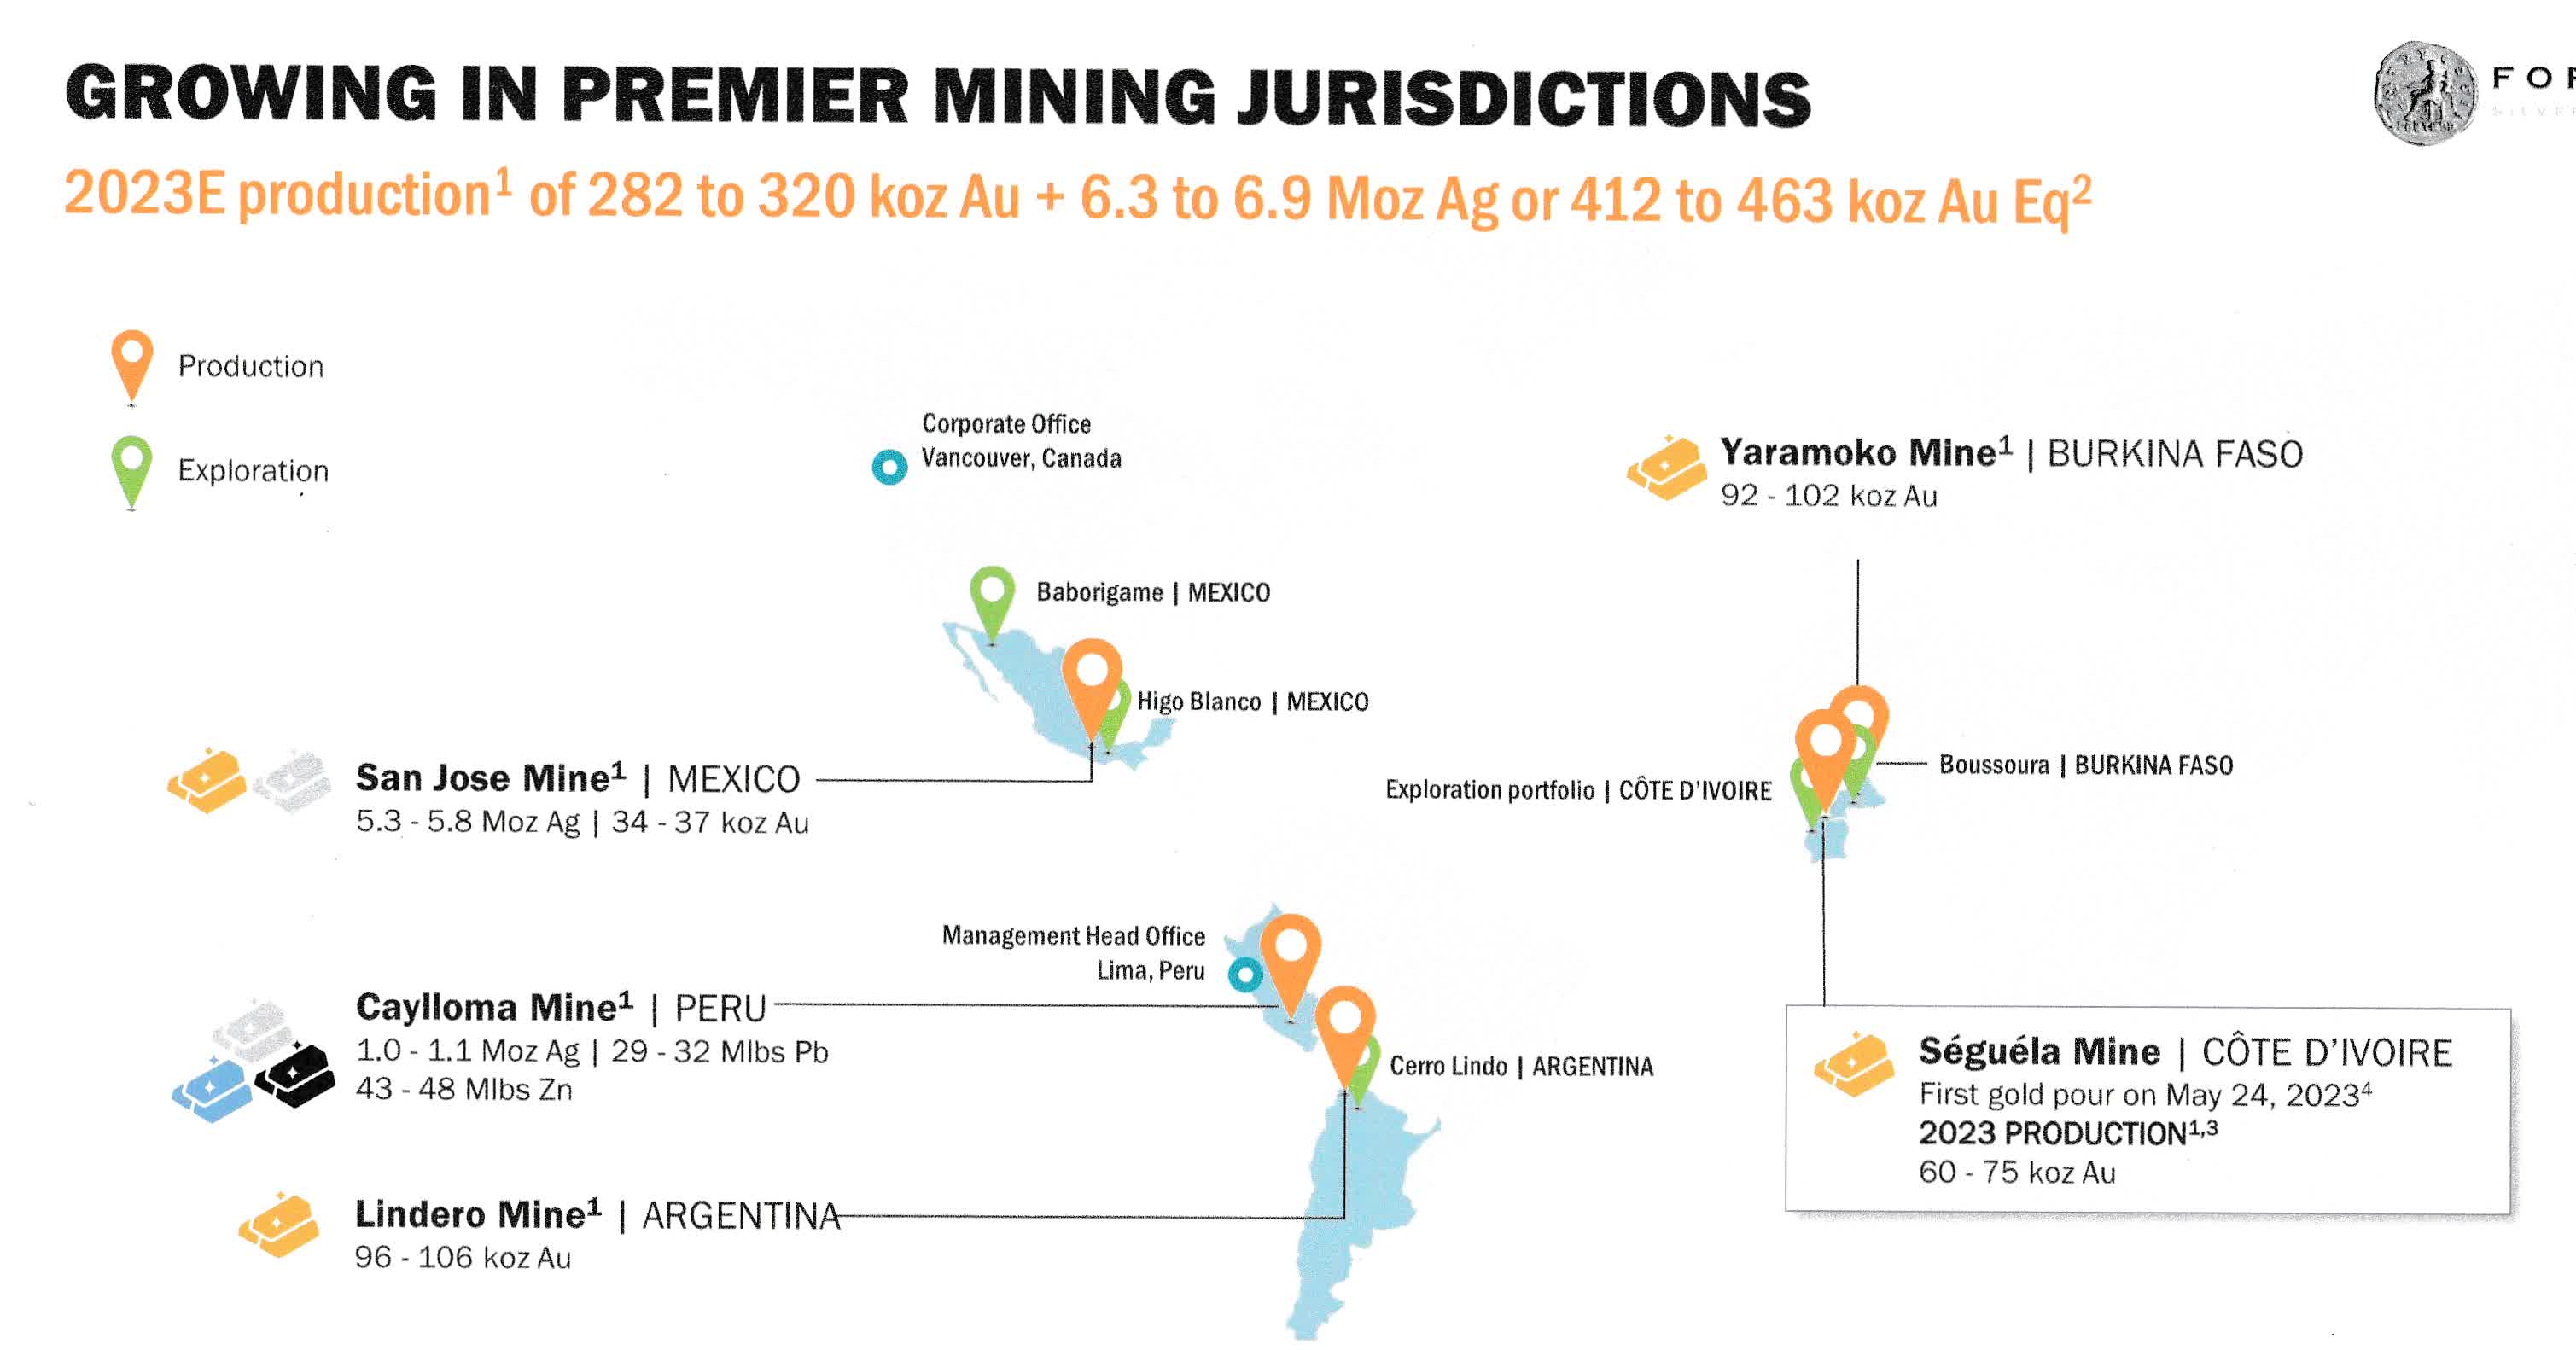
Fortuna Silver Mines owns five production mines, including the Séguéla Mine in Ivory Coast, which started to produce on May 24, 2023 .
FSM Map Presentation (FSM Presentation)
Second Quarter Gold and Silver Production Commentary
1 - 2Q23 Gold and Silver Production
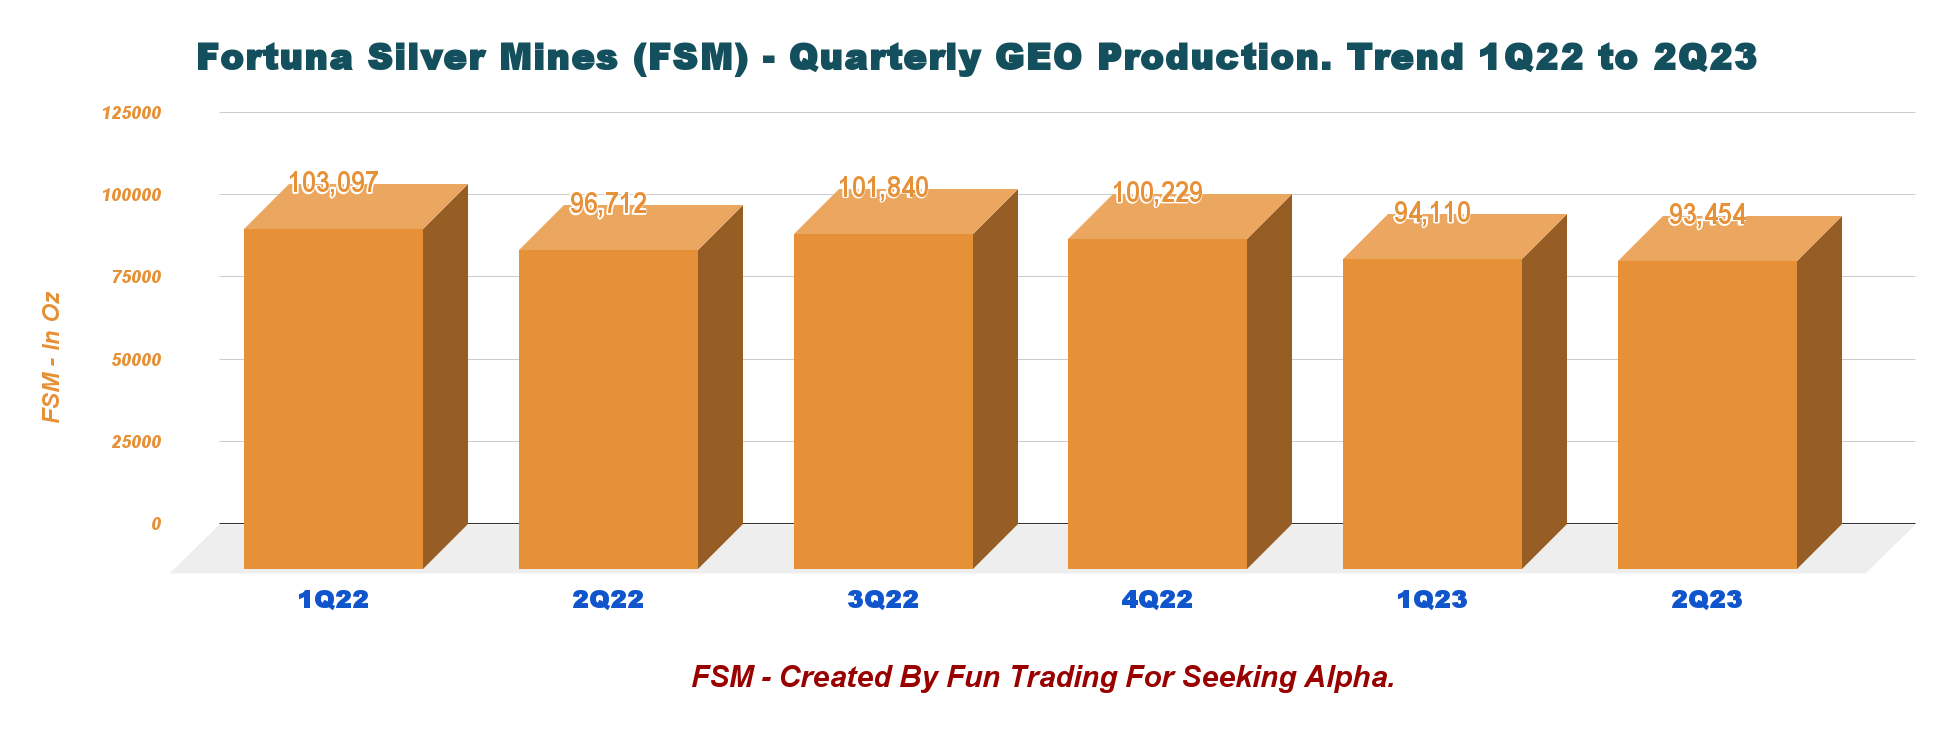
For 2Q23, Fortuna Silver Mines produced 1,262,561 ounces of silver and 64,348 ounces of gold .
FSM GEO Production History (Fun Trading)
It translates to 93,454 GEOs , down 3.4% YoY.
FSM Quarterly GEO Production history (Fun Trading)
GEOs include gold, silver, lead, and zinc and are calculated using the following metal prices: $1,975/oz Au , $24.10/oz Ag , $0.96/t Pb , and $1.23/t Zn or Gold/Silver ratio of 1:81.96 , Gold/Lead = 1:0.93 , Gold/Zinc = 1:0.73 .
FSM Quarterly Gold and Silver Production History (Fun Trading)
The higher year-over-year gold production is mainly due to the start of production at the Séguéla Mine , which offset lower gold and silver production from the San Jose Mine, impacted by a 15-day illegal union worker blockade.
Fortuna Silver Mines reiterates its 2023 annual production guidance range of 6.3 to 6.9 Moz of silver and 282K to 320K ounces of gold or between 412,000 and 463,000 gold equivalent ounces, including lead and zinc by-products
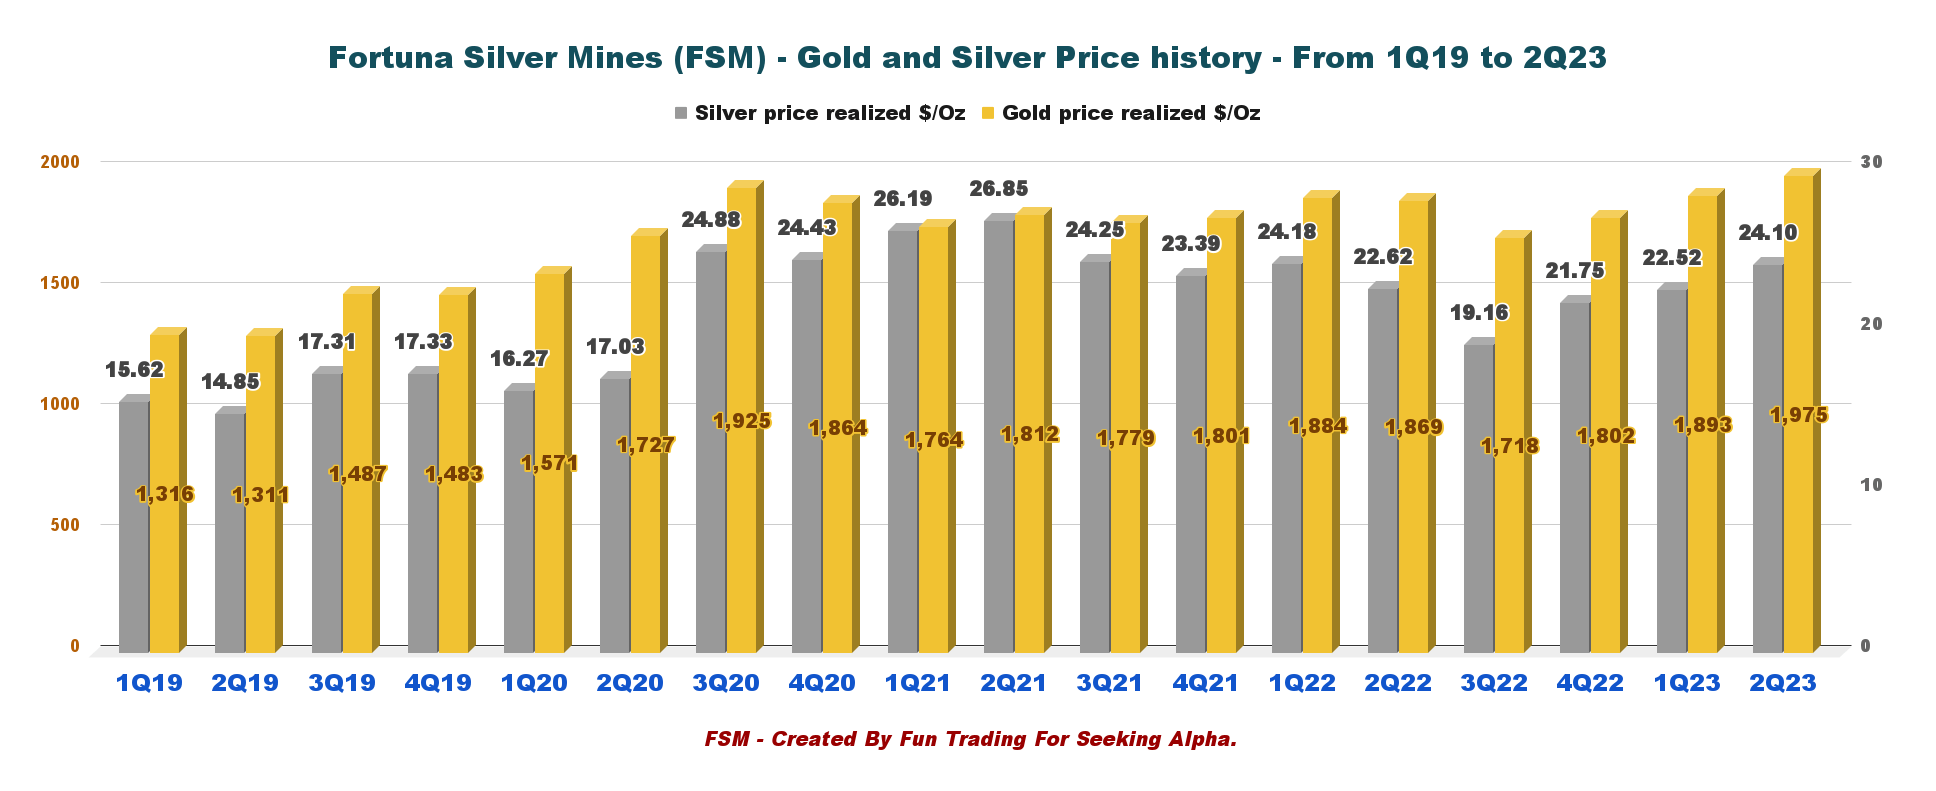
2 - Gold and Silver Prices History
The gold price was $1,975 per ounce , and the silver price was $24.10 per ounce .
FSM Quarterly Gold and Silver Price History (Fun Trading)
Silver is now outperforming gold. However, gold and silver prices did quite well recently, with gold up over 15% and Silver up over 38% , as we can see below:
FSM 1-Year Chart Gold, Silver, Copper (Fun Trading StockCharts)
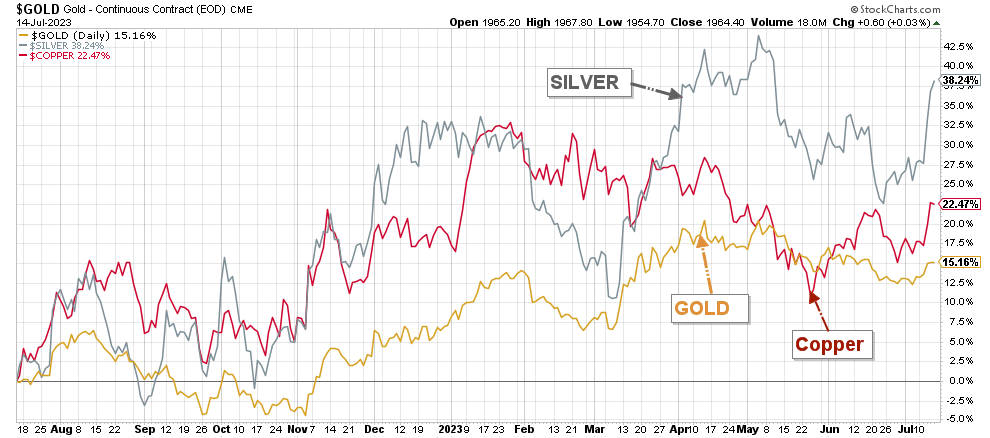
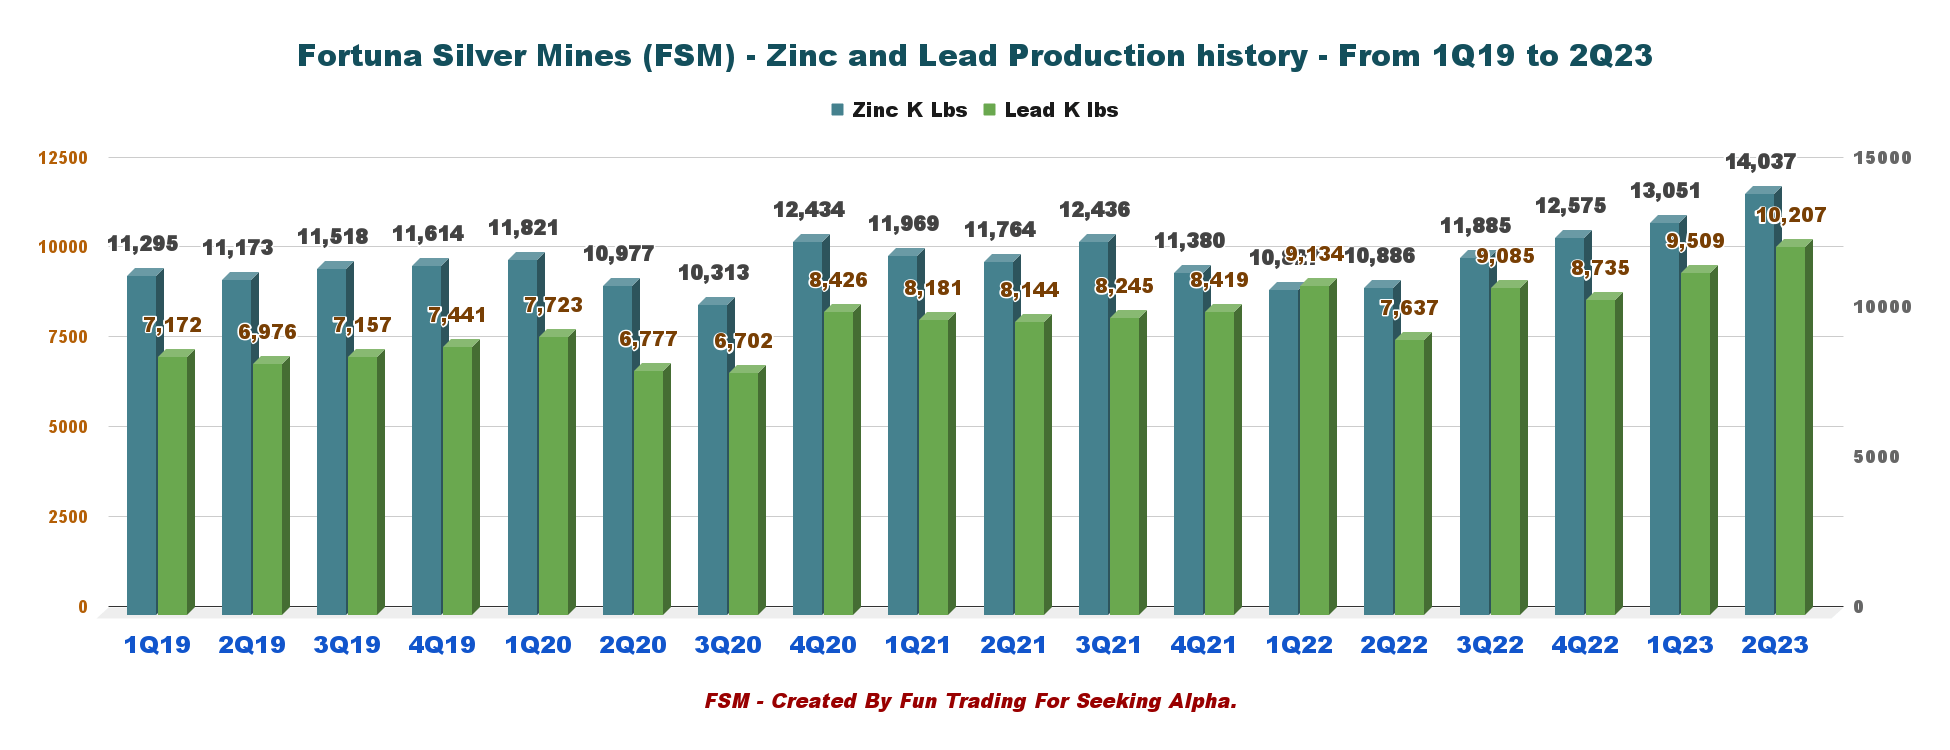
3 - Zinc and Lead Production History (Caylloma Mine)
Production in 2Q23 for lead was 10.207 Mlbs and 14.037 Mlbs for zinc.
FSM Quarterly Production Lead and Zinc History (Fun Trading)
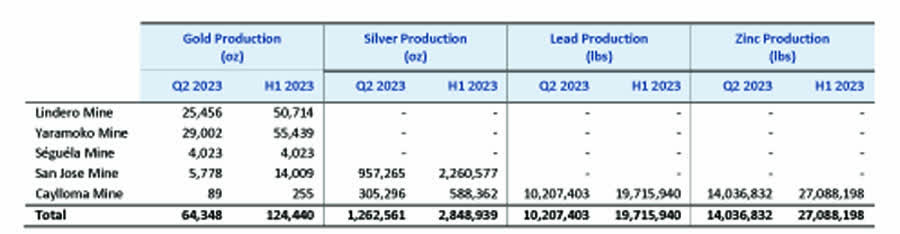
4 - Details Per Mine and Metal Produced
| Production per mine |
| Gold Oz |
| Silver Oz |
| Lead KLbs |
| Zinc KLbs |
| Lindero Mine, Argentina |
| 25,456 |
| 0 |
| 0 |
| 0 |
| Yaramoko Complex Burkina Faso |
| 29,002 |
| 0 |
| 0 |
| 0 |
| San Jose Mine Mexico |
| 5,778 |
| 957,265 |
| 0 |
| 0 |
| Séguéla Mine Côte d'Ivoire |
| 4,023 |
| 0 |
| 0 |
| 0 |
| Caylloma Mine Peru |
| 89 |
| 305,296 |
| 10,207.403 |
| 14,036.832 |
| Total |
| 64,348 |
| 1,262,561 |
| 10,207.403 |
| 14,036.832 |
5 - Commentary
Fortuna Silver Mines delivered decent gold and silver production in 2Q23. However, the 15-day full shutdown of operations in San Jose Mine and Lindero's lower head grade of mineralized material placed on the leach pad hurts the bottom line, even if the Séguéla Mine delivered its first gold this quarter.
- San Jose Mine produced 0.96 million ounces of silver at an average head grade of 168 g/t Ag and 5,778 ounces of gold at an average head grade of 1.02 g/t Au . Production was down over 30% compared to the second quarter of 2022. The processing plant milled 194,887 tonnes at an average of 2,633 TPD. The decrease in production is due to the 15-day full shutdown of operations due to the illegal blockade by the workers' union.
- Lindero's Gold production in the quarter was 25,456 ounces , comprised of 24,599 ounces of doré, an estimated 731 ounces of gold in fine carbon, and 126 ounces in copper concentrate. Gold production for the second quarter of 2023 is 12% lower compared to the second quarter of 2022, mainly due to the lower head grade of mineralized material placed on the leach pad aligned with the Mineral Reserves and mining sequence.
- Caylloma produced 305,296 ounces of silver at an average head grade of 84 g/t Ag in the second quarter of 2023, a 14% increase from the comparable period in 2022. Production has benefitted from higher grade stopes at the lower levels of the Animas vein. Zinc and lead production was 14.0 and 10.2 million pounds at an average head grade of 5.18 % and 3.72% . The base metals production increased significantly compared to the same period in 2Q22.
- The Yaramoko Mine: In the second quarter of 2023, the Yaramoko Mine produced 29,002 ounces of gold at an average head grade of 6.51 g/t Au or an 18%-20% increase from 2Q22. Production benefited from higher grades mined and an increase in milled tonnes. Better than expected grades were sourced from the deposit extension beyond the current resource boundary on the western side of the 55 Zone.
- The Séguéla Mine poured its first gold on May 24 and produced 4,023 Au ounces during the initial ramp-up weeks of the second quarter, with first sales planned for July. 109,605 tonnes of ore were processed at an average grade of 1.56 g/t Au .
Technical Analysis (Short-Term) and Commentary
FSM TA Chart Short-Term (Fun Trading StockCharts)
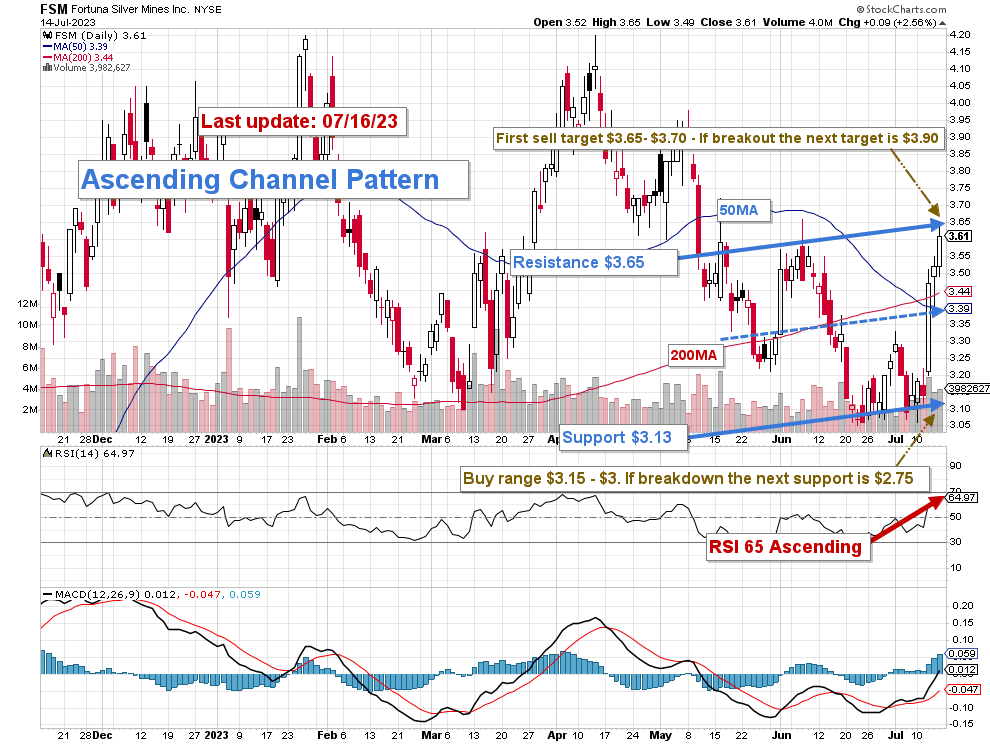
FSM forms an ascending channel pattern, with resistance at $3.65 and support at $3.13. However, the RSI is 65, close to overbought, and may indicate a solid resistance between $3.70 and $3.90.
Ascending channel patterns or rising channels are short-term bullish in that a stock moves higher within an ascending channel, but these patterns often form within longer-term downtrends as continuation patterns. The ascending channel pattern is often followed by lower prices.
I regularly recommend keeping a core long-term position and using about 40% to trade FSM short-term LIFO. I promote this simple but working-fine strategy in my marketplace, "The Gold And Oil Corner." it allows you to wait for a higher final price target for your core-long position, which I see between $4 and $5 .
I suggest selling partially between $3.65 and $3.70 , with possible upper resistance at $3.90 , and waiting for a retracement between $3.15 and $3.00 , with likely lower support at $2.75 .
The buying range target above is now less likely but still possible, with the consumer price index rising 0.2% in June and up 3% from a year ago , the lowest level since March 2021. Gold and Silver are turning more bullish and should support FSM.
Thus, I recommend using the mid-resistance/support at $3.39 (50MA) for more frequent traders to start buying back again.
Thus, watch the gold and silver prices like a hawk.
Warning: The TA chart must be updated frequently to be relevant. It is what I am doing in my stock tracker. The chart above has a possible validity of about a week. Remember, the TA chart is a tool only to help you adopt the right strategy. It is not a way to foresee the future. No one and nothing can.
For further details see:
Fortuna Silver Mines: The Latin America Mines Underperformed This Quarter