FSM - Fortuna Silver Mines: The Séguéla Project In Ivory Coast Is Nearly Completed
2023-03-20 06:03:22 ET
Summary
- Fortuna Silver Mines's revenues were $164.72 million, with a net loss of $152.77 million or $0.52 per diluted share in 4Q22.
- Fortuna Silver Mines's revenues were $164.72 million, with a net loss of $152.77 million or $0.52 per diluted share in 4Q22.
- I recommend buying FSM stock between $3.25-$3.12, with likely lower support at $2.85.
Part I - Introduction
Fortuna Silver Mines Inc. ( FSM ) released its fourth-quarter and full-year 2022 results on March 15, 2023.
Note: This article is an update of my article published on January 23, 2023. In this preceding article, I discussed the fourth quarter production that will be used again here and updated with the most recent developments.
I have followed FSM on Seeking Alpha since Dec. 2021.
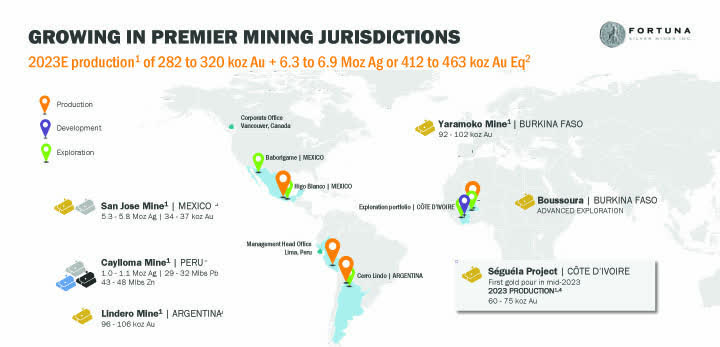
The company has four producing mines and owns the Séguéla Project in Ivory Coast, which is almost completed, with the first gold pour in mid-2023. Also, the company published a presentation in which it expects a 2023 Production of 282K to 320K Au Oz to 412K to 463K GEOs. All those details will be discussed in this article.
FSM Assets presentation (FSM Presentation)
1 - Fourth-quarter and full-year 2022 Highlights
Fortuna Silver Mines's revenues were $164.72 million, with a net loss of $152.77 million or $0.52 per diluted share in 4Q22. It compares to a net income of $15.75 million or $0.04 per diluted share in the same quarter a year ago.
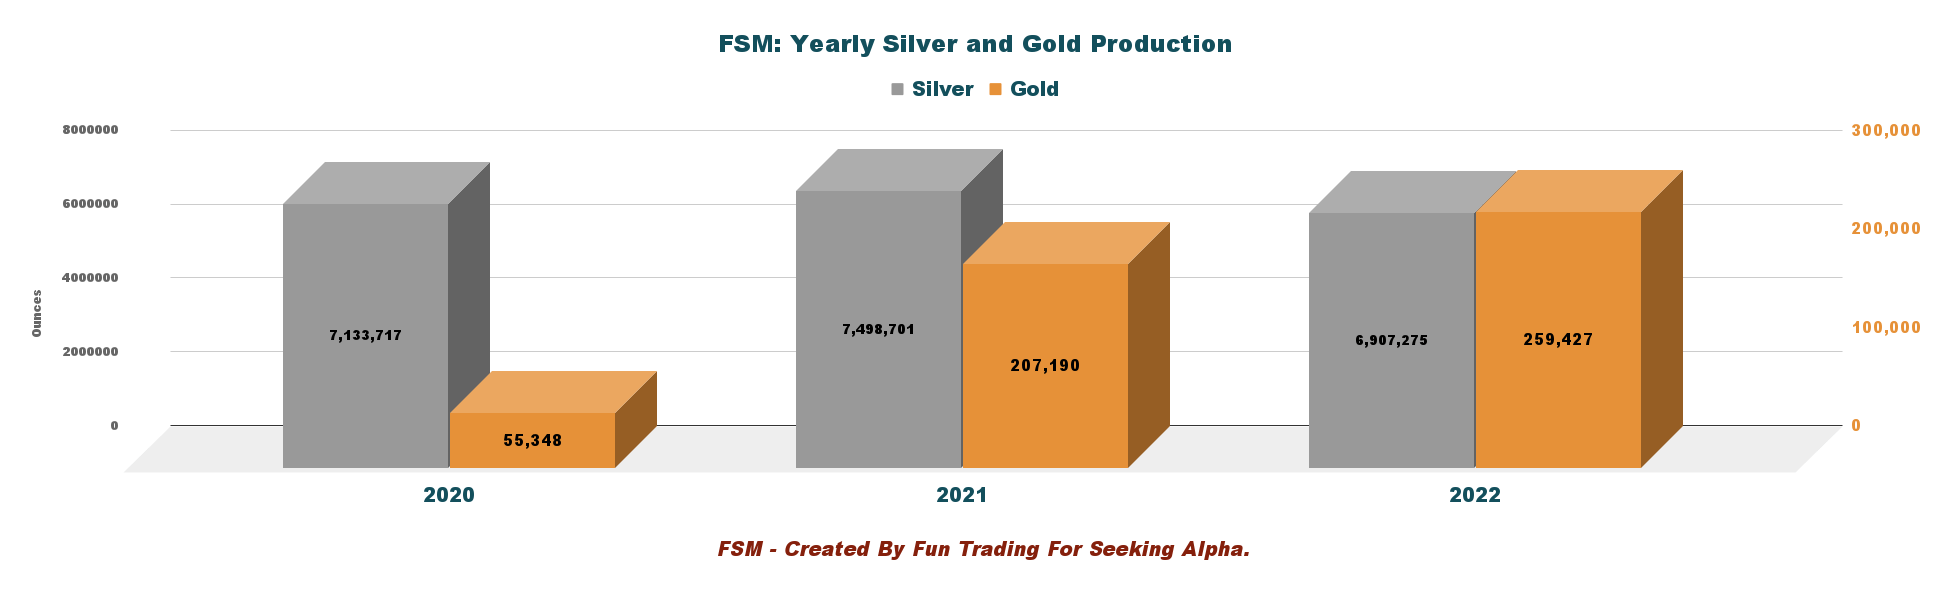
Fortuna produced 259,427 Au ounces and 6,907,275 Ag ounces in 2022, well within the range provided in the 2022 guidance.
FSM Yearly production history (Fun Trading)
CEO Jorge Alberto Ganoza said in the conference call:
Despite persistent inflationary pressures throughout 2022, all of our mines performed within the AISC range provided in our annual guidance. The only exception was the Lindero Mine, which recorded AISC of $1,142 per ounce of gold, marginally above guidance.
Fortuna Silver Mines's revenues were $164.72 million, with a net loss of $152.77 million or $0.52 per diluted share in 4Q22.
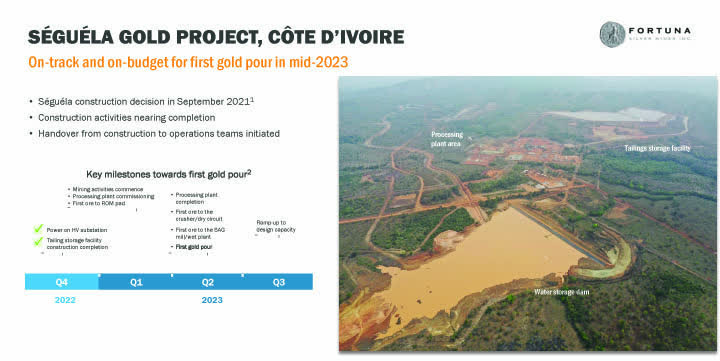
Fortuna has accrued approximately $160 million of the $173 million total CapEx and has already committed about 93% of the total CapEx. Production for 2023 is expected to be between 60K to 75K Au ounces (yearly production is estimated at 120K Au ounces). The first gold is expected in 2Q23.
FSM Seguela Project Presentation (FSM Presentation)
The proven and probable mineral reserves at the Seguela gold mine were estimated to be approximately 12.1 million tonnes grading 2.8 g/t gold with 1.1 million ounces (Moz) in contained gold as of March 2021. Yearly production is estimated at 120K Au ounces.
2 - Gold and Silver prices are turning bullish
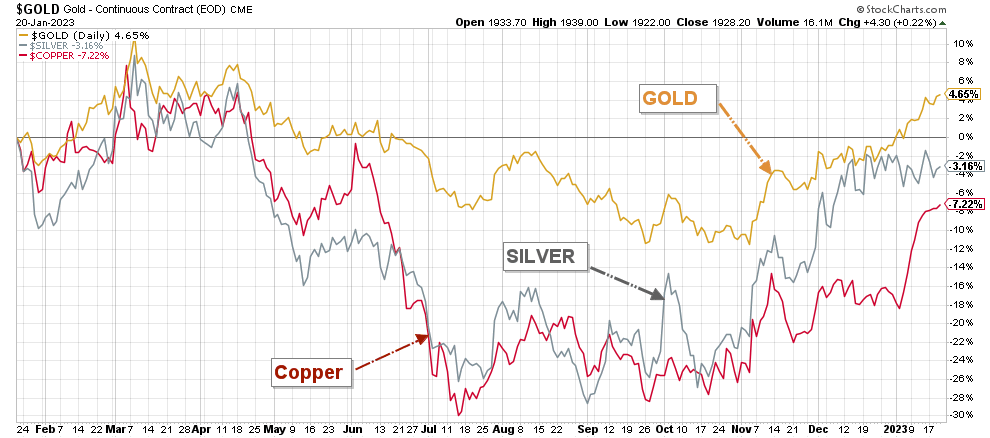
Due to the FED's hawkish position against rampant inflation, gold and silver prices dropped significantly in the third quarter. However, the situation has drastically changed in the past few weeks, with inflation going slowly down and a nascent bank crisis that threatened the world financial order, as we can see below:
FSM Gold, silver, copper 1-Year chart (Fun Trading StockCharts)
3 - Stock Performance
Fortuna Silver Mines has recovered significantly since October 2022 and is now down only 17% on a one-year basis. It is a little disappointing after the recent jump in the gold price, which closed at 1,989 per ounce last Friday.
Fortuna Silver Mines: Financials and Production in 4Q22 - The Raw Numbers
| FSM |
| 4Q21 |
| 1Q22 |
| 2Q22 |
| 3Q22 |
| 4Q22 |
| Total Revenues in $ Million |
| 198.9 |
| 182.3 |
| 167.9 |
| 166.57 |
| 164.72 |
| Net income in $ Million |
| 15.8 |
| 26.1 |
| 2.3 |
| -3.8 |
| -152.77 |
| EBITDA $ Million |
| 79.5 |
| 75.0 |
| 61.9 |
| 50.9 |
| -126.5 |
| EPS diluted in $/share |
| 0.04 |
| 0.09 |
| 0.01 |
| -0.01 |
| -0.52 |
| Cash from operating activities in $ Million |
| 57.1 |
| 33.2 |
| 47.4 |
| 64.7 |
| 49.6 |
| Capital Expenditure in $ Million |
| 62.06 |
| 65.0 |
| 54.0 |
| 58.9 |
| 73.3 |
| Free Cash Flow in $ Million |
| -5.0 |
| -31.8 |
| -6.6 |
| 5.7 |
| -23.7 |
| Total cash $ Million |
| 107.5 |
| 110.7 |
| 116.4 |
| 91.0 |
| 80.6 |
| Total debt in $ Million |
| 157.5 |
| 198.0 |
| 218.6 |
| 204.2 |
| 219.2 |
| Shares outstanding (diluted) in Million |
| 329.3 |
| 294.6 |
| 295.2 |
| 291.4 |
| 290.2 |
| Silver and Gold Production |
| 4Q21 |
| 1Q22 |
| 2Q22 |
| 3Q22 |
| 4Q22 |
| Silver Production in M Oz |
| 1,980,243 |
| 1,670,128 |
| 1,652,895 |
| 1,837.506 |
| 1,746,746 |
| Gold production in K Oz |
| 76,162 |
| 66.800 |
| 62,171 |
| 66,344 |
| 64,112 |
| Gold price realized $/Oz |
| 1,801 |
| 1,884 |
| 1,869 |
| 1,718 |
| 1,802 |
| Silver price realized $/Oz |
| 23.39 |
| 24.18 |
| 22.62 |
| 19.16 |
| 21,75 |
| Zinc M lbs |
| 11,380 |
| 10,827 |
| 10,886 |
| 11,885 |
| 12,575 |
| Lead M lbs |
| 8,419 |
| 9,134 |
| 7,637 |
| 9,085 |
| 8,735 |
Source: Company material
Part II - Gold and Silver Production Details
Fortuna produced 259,427 Au ounces and 6,907,275 Ag ounces in 2022. Gold production was up 25.2% YoY, but silver production was down 7.9%. Production in gold equivalent for 2022 was 401,878 GEOs.
Silver production was slightly above guidance, and gold production was nearly at the mid-point of 2022 guidance. Good job.
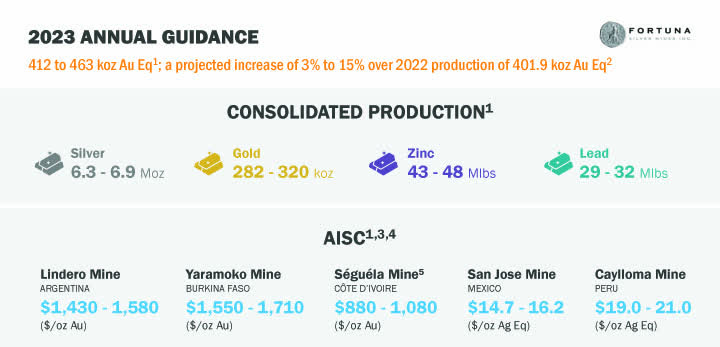
The company indicated its 2023 preliminary consolidated production guidance:
- Gold production of between 282K and 320K ounces; a projected increase of between 9% and 23% over 2022
- Silver production of between 6.3M and 6.9M ounces; a projected decrease of up to 9% over 2022
- Gold equivalent production is between 412K and 463K ounces, a projected increase of 3% to 15% over 2022.
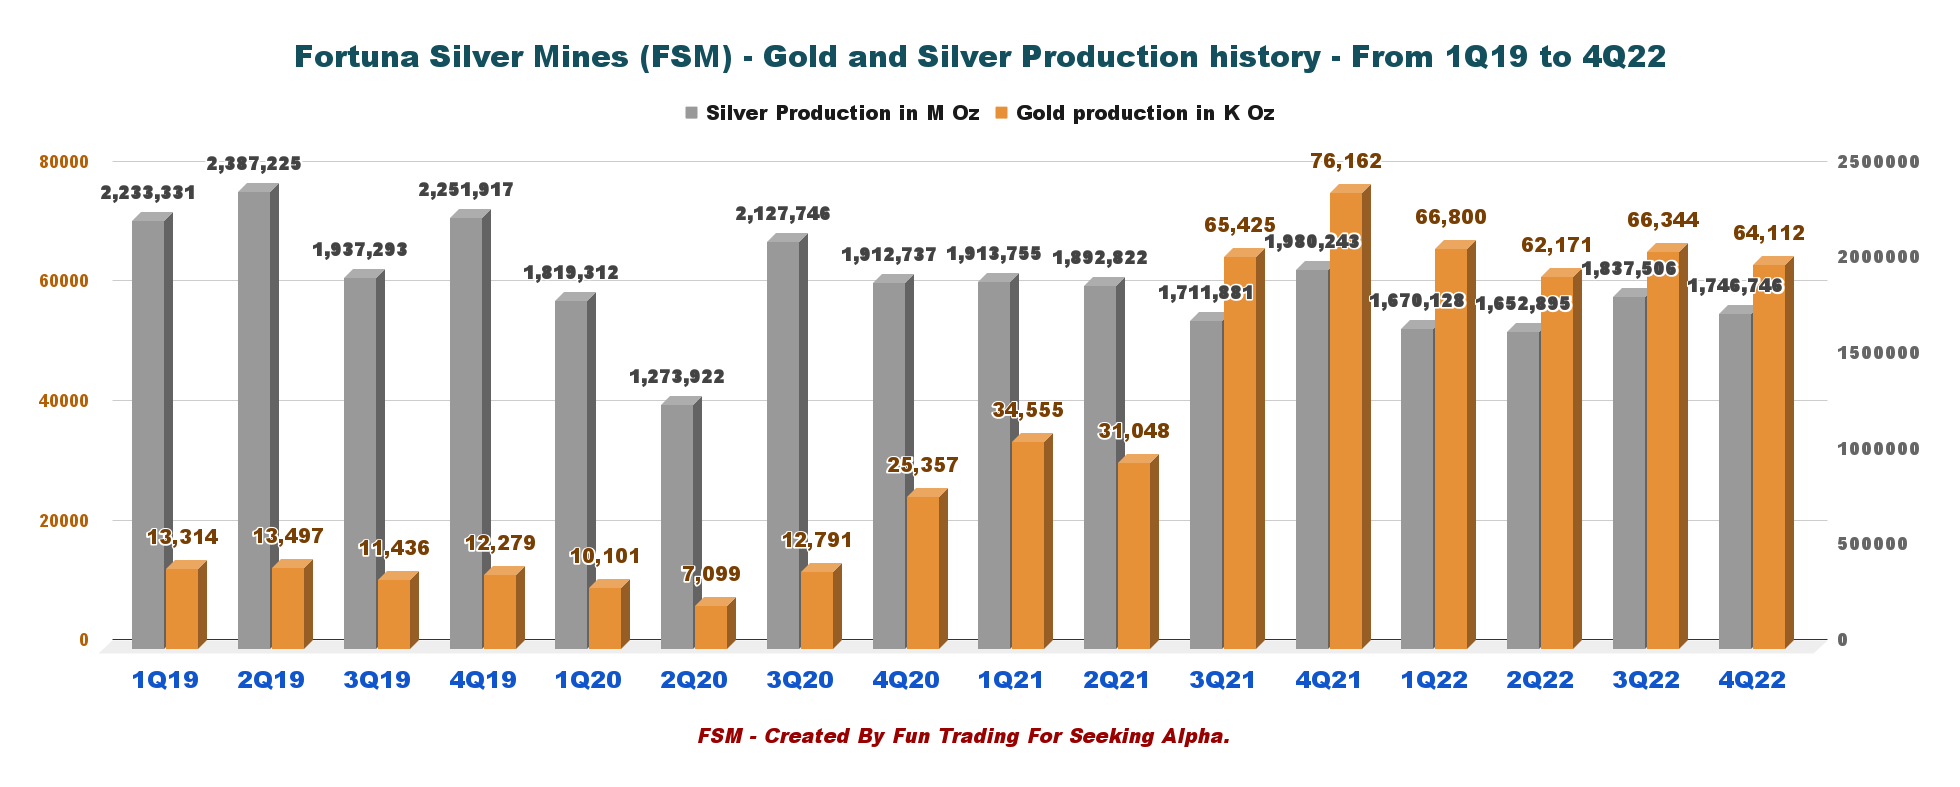
For 4Q22, Fortuna Silver Mines produced 1,746,746 ounces of silver and 64,112 ounces of gold. It translates to 100,229 GEOs using a ratio Au/Ag of 1:82.89.
FSM Quarterly Gold and silver production history (Fun Trading)
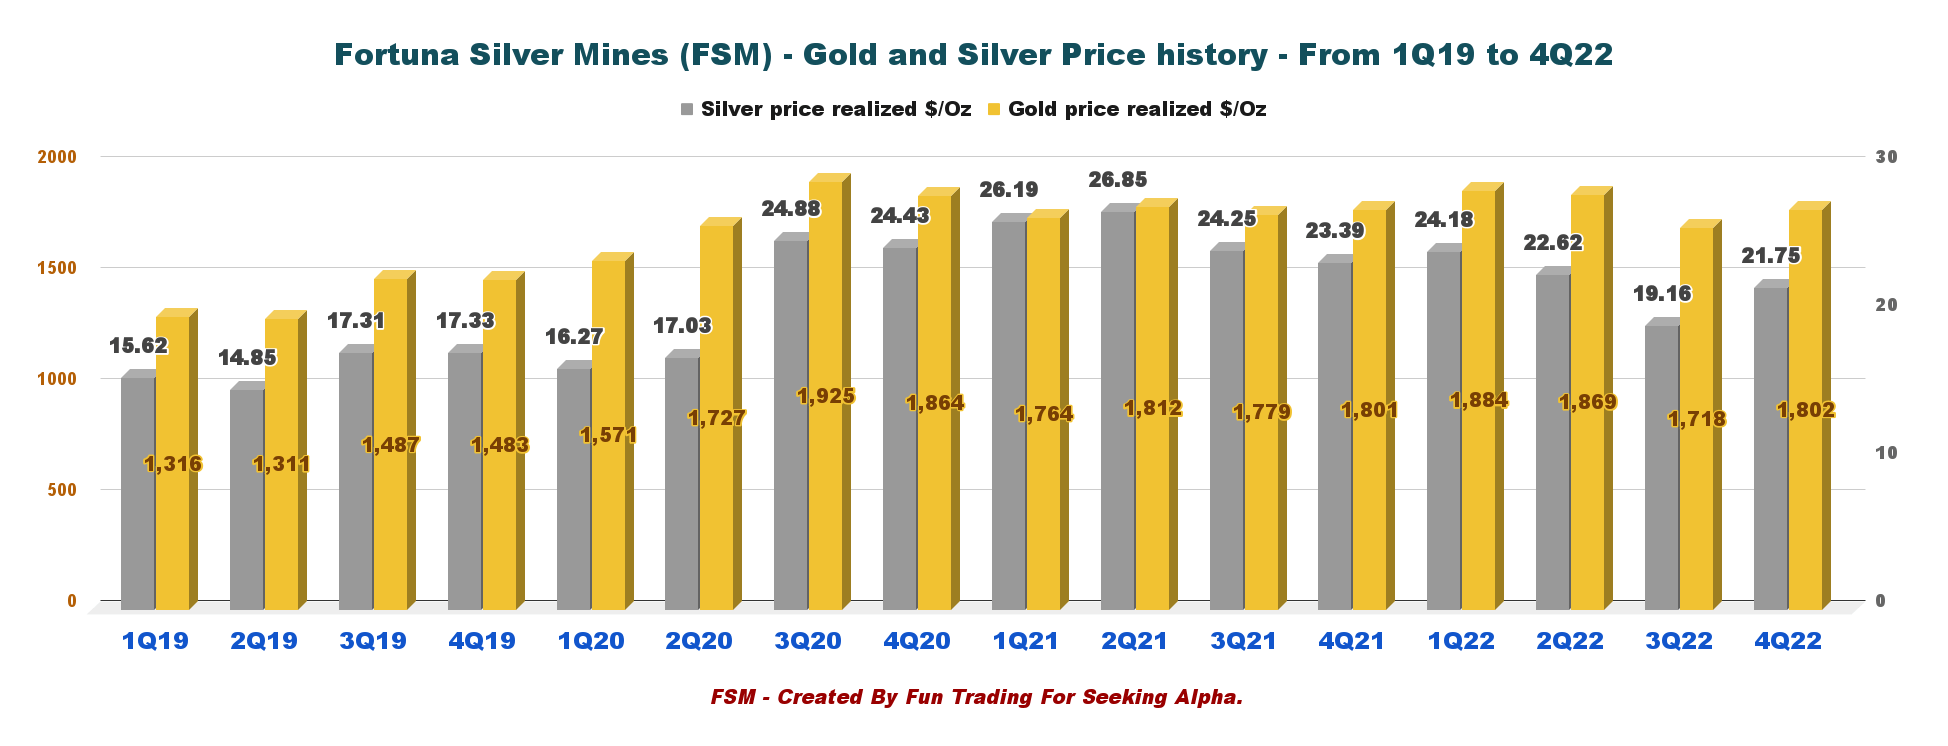
1 - Gold and Silver Prices History
The gold price was $1,802 per ounce, and the silver price was $21.75 per ounce.
FSM Quarterly Gold and Silver prices history (Fun Trading)
Silver is still underperforming gold, but gold and silver prices did quite well recently, with gold closing at nearly $2,000 per ounce on Friday.
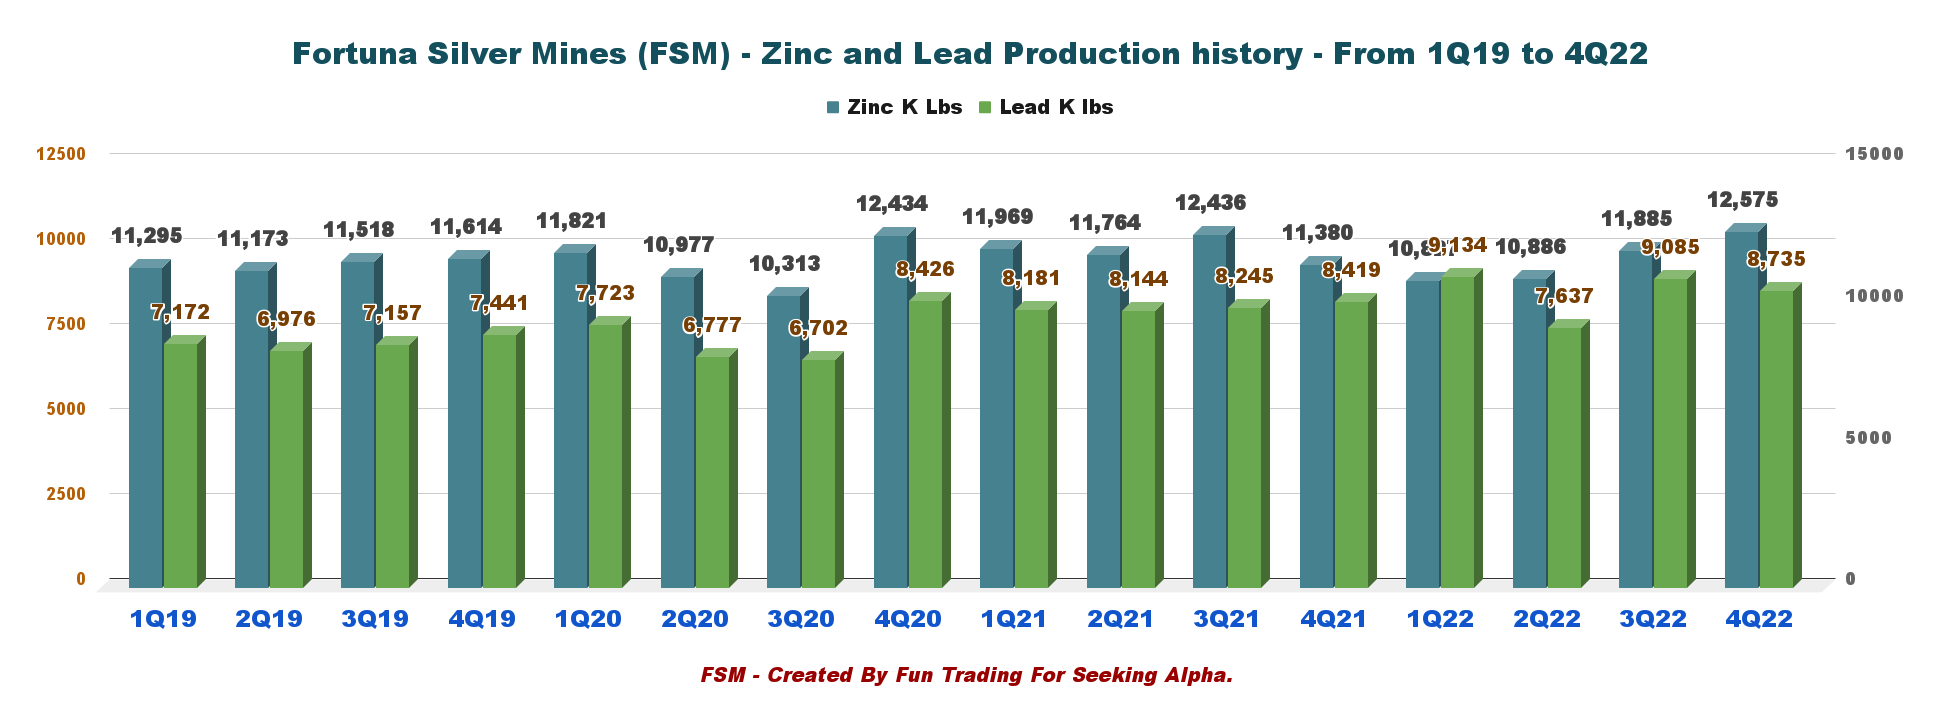
2 - Zinc and Lead Production History (Caylloma Mine)
Production in 4Q22 for the lead was 8.735 Mlbs and 12.575 Mlbs for zinc; for the full-year 2022, production was 34.588 Mlbs of lead and 45.176 Mlbs of zinc.
FSM Quarterly Lead and Zinc production history (Fun Trading)
3 - Details Per Mine and Metal Produced
| Production per mine |
| Gold Oz |
| Silver Oz |
| Lead KLbs |
| Zinc KLbs |
| Lindero Mine, Argentina |
| 29,301 |
| 0 |
| 0 |
| 0 |
| Yaramoko Complex Burkina Faso |
| 26,190 |
| 0 |
| 0 |
| 0 |
| San Jose Mine Mexico |
| 8,499 |
| 1,473,627 |
| 0 |
| 0 |
| Caylloma Mine Peru |
| 122 |
| 273,119 |
| 8,736 |
| 12,575 |
| Total |
| 64,112 |
| 1,746,746 |
| 8,736 |
| 12,575 |
4 - Commentary
Fortuna Silver Mines delivered another gold and silver production in 4Q22.
- San Jose Mine produced 1.474 million ounces of silver and 8,499 ounces of gold, a 14% decrease for both metals compared to the equivalent period in 2021. The drop is mainly due to lower head grades, albeit in line with management's expectations based on the mining sequence and Mineral Reserve estimate.
- Lindero's gold production in 4Q22 was 29,301 Au ounces, down 19% compared to the fourth quarter of 2021. Lower gold production is attributed to an 8% decrease in tonnes and a 23% decrease in gold grade for ore placed on the pad compared to 4Q21.
- Caylloma produced 273,119 ounces of silver, a 4% increase year-over-year, primarily due to higher grades mined during the period. The mine also produced 122 ounces of gold.
- The Yaramoko Mine produced 26,190 ounces of gold in 4Q22, with an average head grade of 6.45 g/t Au, in line with the mining sequence and Mineral Reserve estimate, and an 8% decrease year-over-year. The decline in production YoY was due to lower head grades. However, grades for the full year were in line with planned estimates.
5 - 2023 Guidance and AISC
FSM 2023 Guidance presentation (FSM Presentation)
Part III - Balance Sheet Commentary
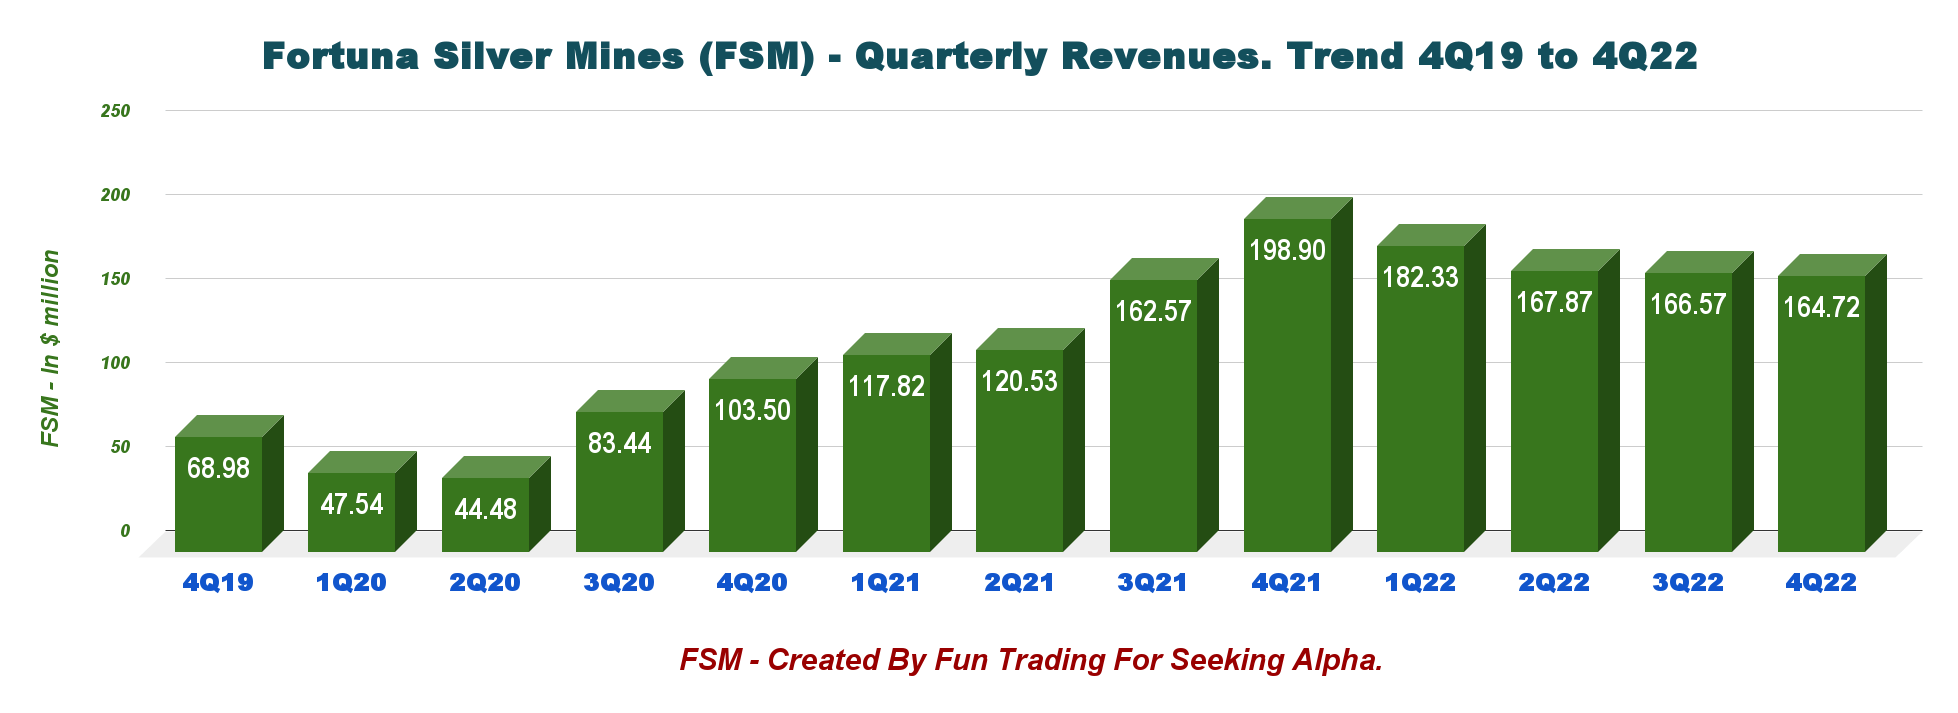
1 - Fortuna Silver Mines' Revenues were $164.72 million in 4Q22
FSM Quarterly Revenues history (Fun Trading)
Adjusted EBITDA was $55.8 million in 4Q22, totaling $245.5 million for the full year 2022.
The net loss was $152.77 million or $0.52 per share, compared with an income of $15.75 million or $0.04 per share reported in 4Q21.
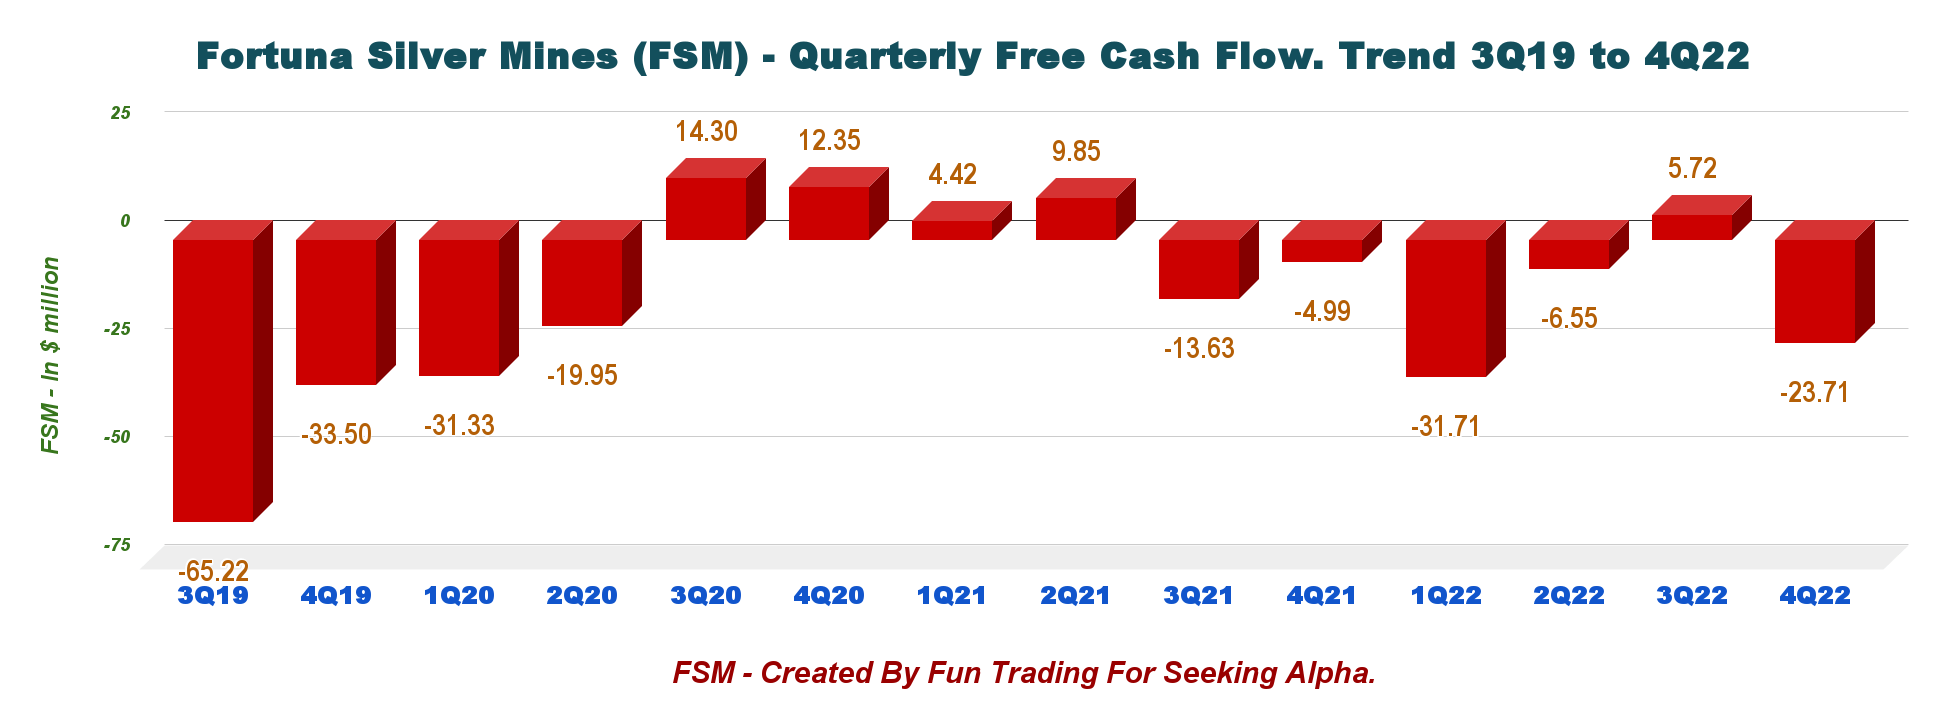
2 - Fortuna Silver reported a 4Q22 Free Cash loss of $23.71 million
FSM Quarterly Free cash flow history (Fun Trading)
FSM's trailing 12-month free cash flow was a loss of $56.29 million, with a loss of $23.71 million in 4Q22.
Note: On May 2, 2022, the company initiated a share repurchase program to purchase up to 5% of its issued and outstanding common shares, expiring May 1, 2023. The share buybacks completed during 2022 were $5.9 million.
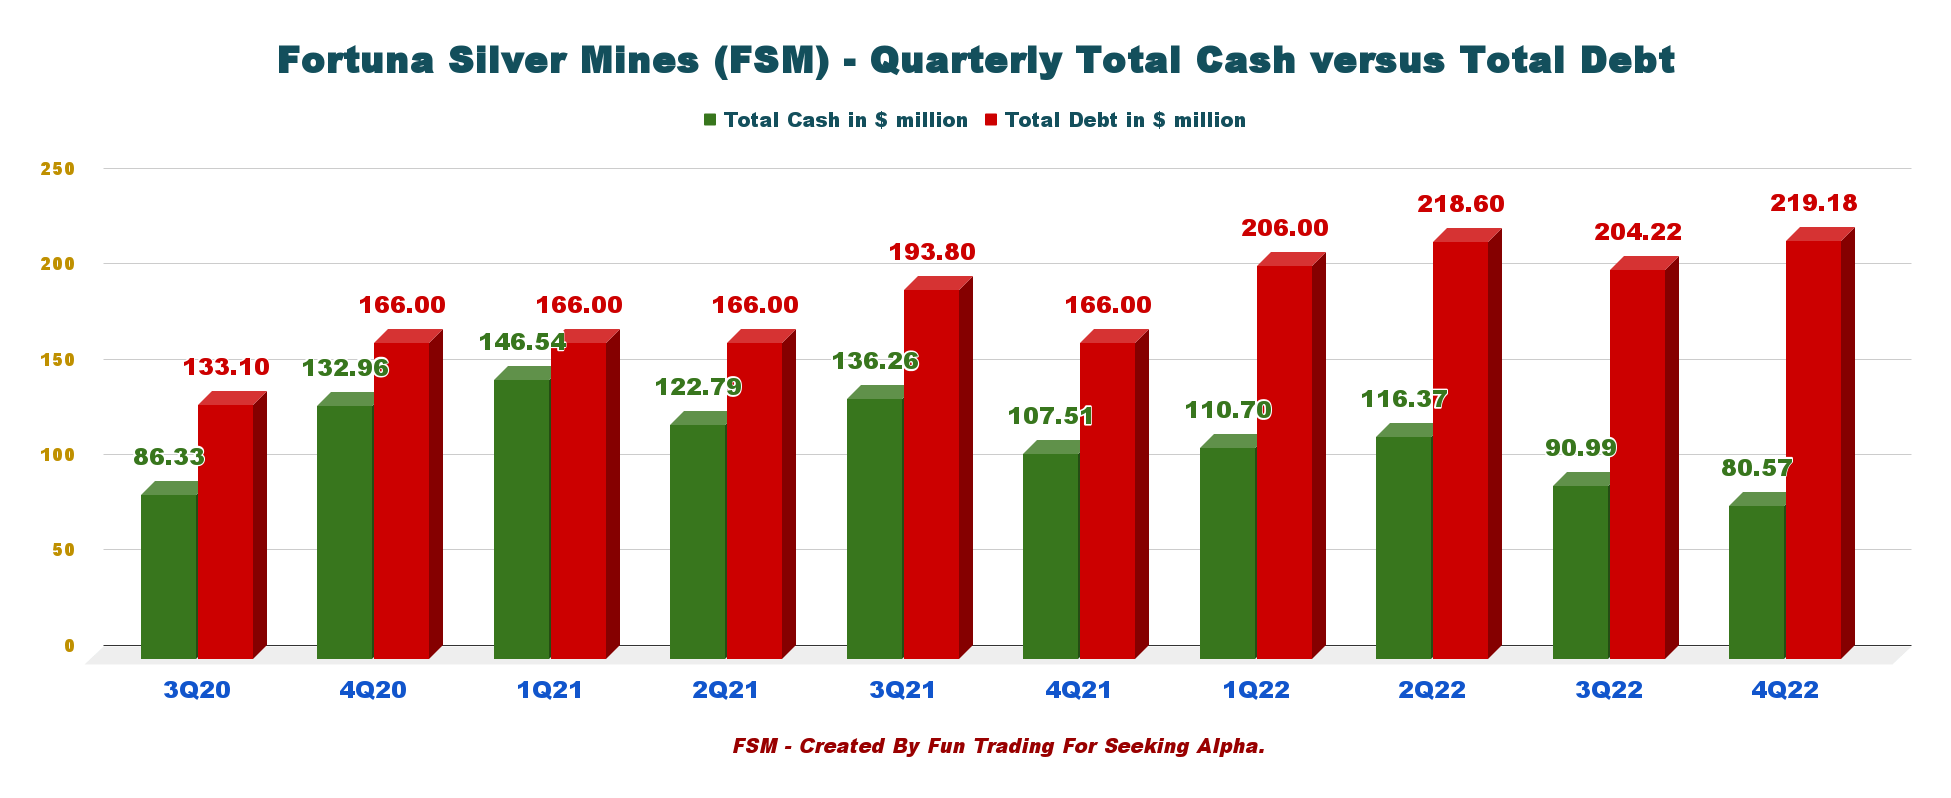
3 - Fortuna's total debt was $219.18 million on December 31, 2022
FSM Quarterly Cash versus Debt history (Fun Trading)
As of December 31, 2022, the company had cash equivalents of $80.57 million and total debt of $219.18 million.
Total liquidity available to the Company as of December 31, 2022, was $150.57 million, comprised of $80.57 million of cash and cash equivalents and $70.0 million undrawn on the Company's revolving $250.0 million credit facility.
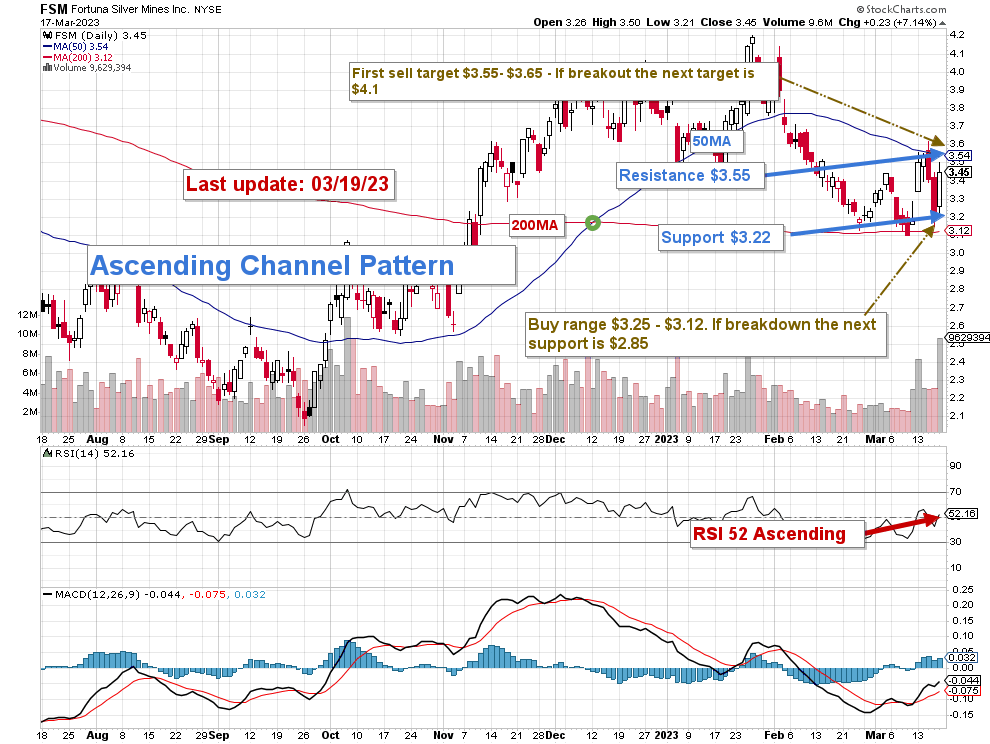
Part IV - Technical Analysis (Short Term) and Commentary
FSM TA Chart short-term (Fun Trading StockCharts) FSM forms an ascending channel pattern with resistance at $3.55 and support at $3.22. As I said in the preceding article, ascending channel patterns are generally short-term bullish and move higher within an ascending channel. Still, these patterns often form within longer-term downtrends as continuation patterns. However, it is hard to overlook the bullish recent gold trend created by the new bank crisis that threatens to spread worldwide. In this situation, FSM may also turn bullish because high tide lifts all boats.
I regularly promote the general strategy in my marketplace to keep a core long-term position and use about 40% to trade short-term LIFO. It allows you to wait for a higher final price target for your core position between $5 and $6, a possible target in 2023.
For the short-term trading, I suggest selling partially between $3.55 and $3.65 with possible upper resistance at $4.1 and waiting for a retracement between $3.25-$3.12, with likely lower support at $2.85.
Watch the gold and silver prices like a hawk.
Warning: The TA chart must be updated frequently to be relevant. It is what I am doing in my stock tracker. The chart above has a possible validity of about a week. Remember, the TA chart is a tool only to help you adopt the right strategy. It is not a way to foresee the future. No one and nothing can.
For further details see:
Fortuna Silver Mines: The Séguéla Project In Ivory Coast Is Nearly Completed