FSM - Fortuna Silver Mines: The Seguela Mine Is A Go
2023-05-19 13:12:54 ET
Summary
- Fortuna Silver Mines Inc.'s revenues were $175.65 million, with a net income of $11.86 million or $0.04 per diluted share in 1Q23.
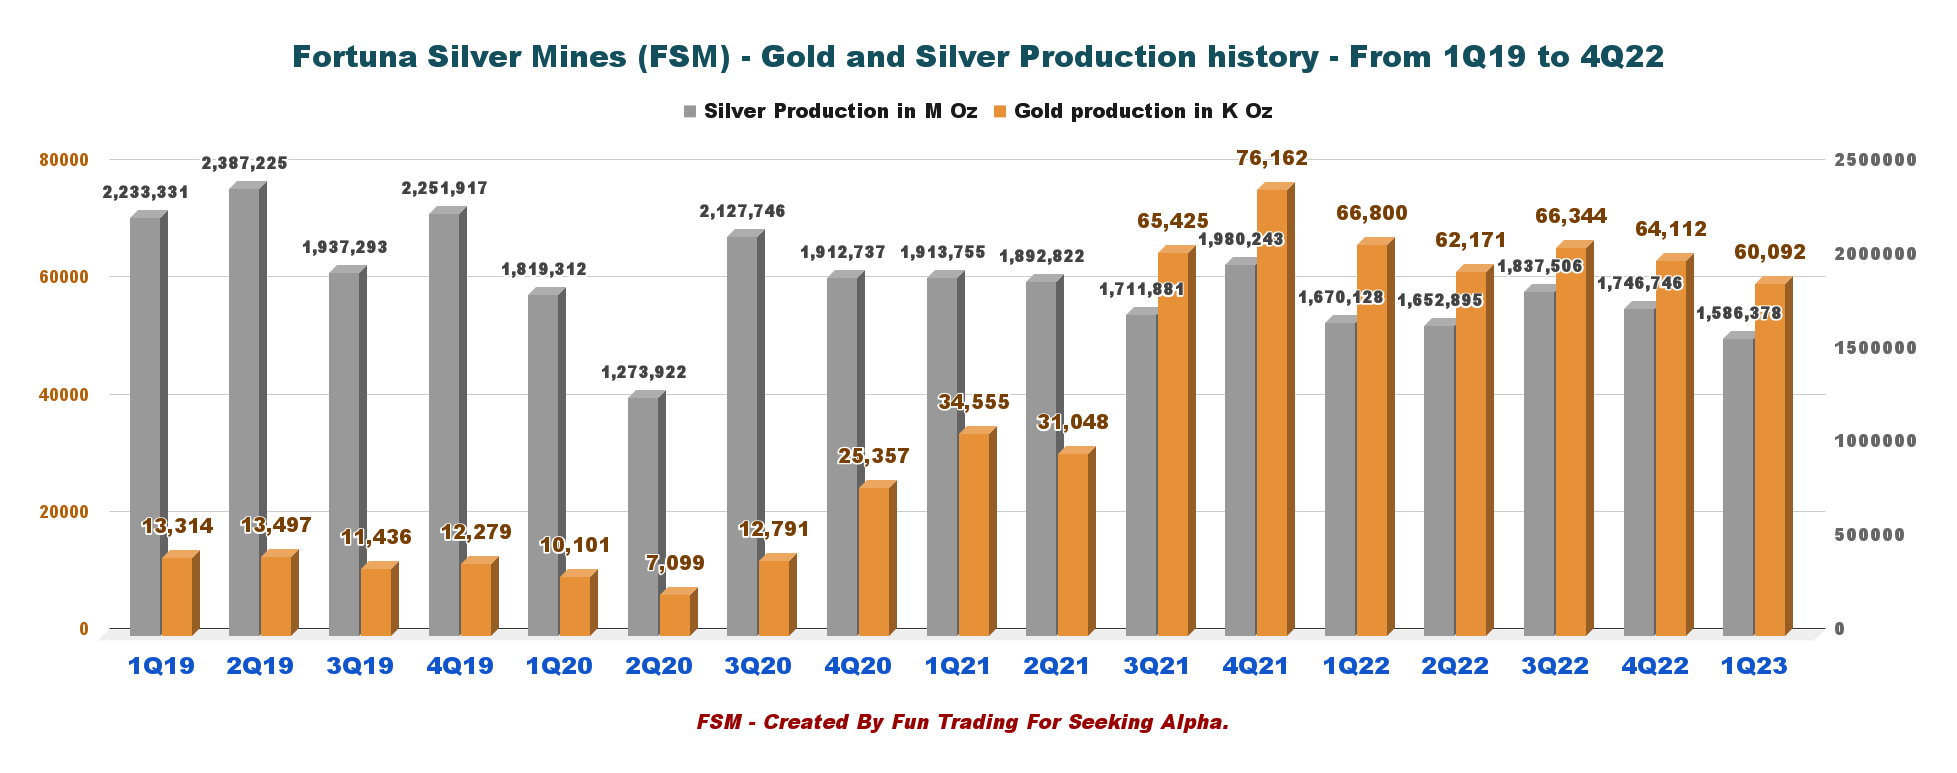
- Fortuna produced 60,092 Au ounces and 1,586,378 Ag ounces in 1Q23. This represents 94,110 GEOs compared to 103,097 GEOs in 1Q22.
- I recommend buying Fortuna Silver Mines Inc. stock between $3.35-$3.2, with likely lower support at $3.
Part I - Introduction
Fortuna Silver Mines Inc. (FSM) released its first-quarter 2023 results on May 15, 2023.
Note: This article is an update of my article published on March 20, 2023. I have followed FSM on Seeking Alpha since Dec. 2021.
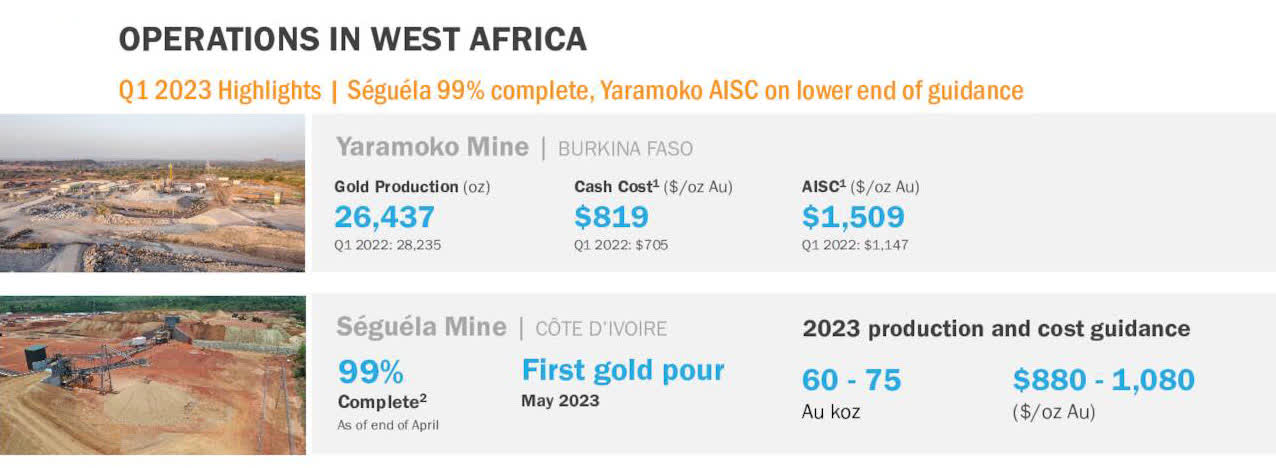
The company owns four producing mines and owns the Séguéla Project in Ivory Coast, which is 99%, with the first gold pour this month.
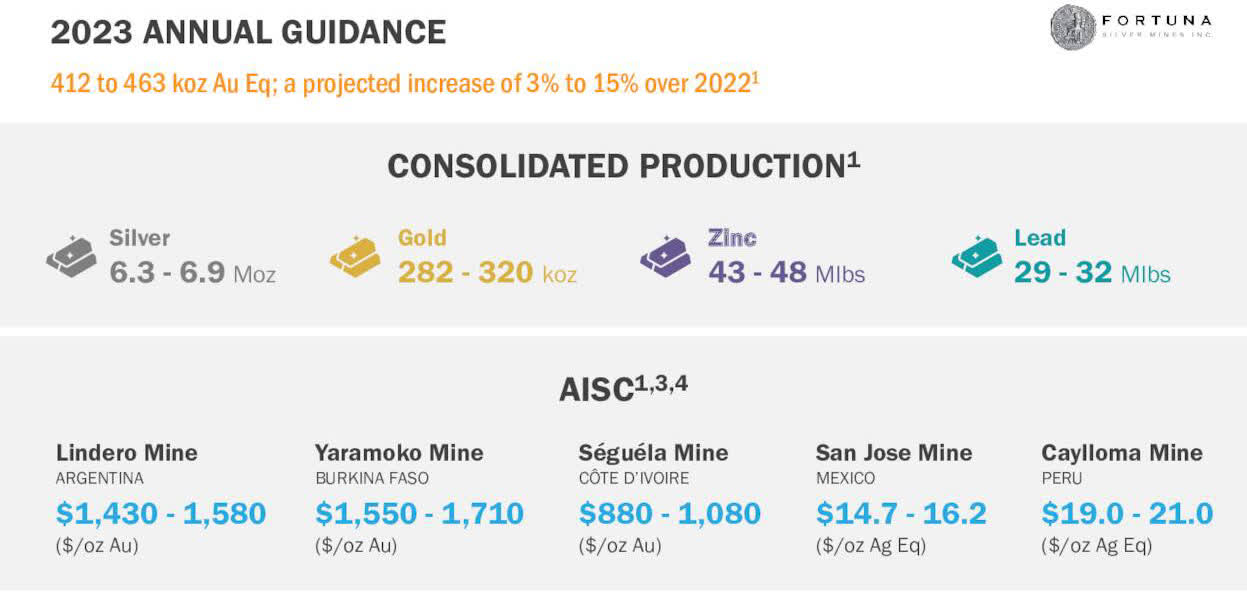
Also, the company published a presentation in which it expects a 2023 Production of 60K to 75K Au Oz .
FSM West Africa Operations with Seguela Mine (FSM Presentation)
The proven and probable mineral reserves at the Seguela gold mine were estimated to be approximately 12.1 million tonnes grading 2.8 g/t gold with 1.1 million ounces (Moz) in contained gold as of March 2021. Yearly production is estimated at 120K Au ounces.
1 - First-Quarter 2023 Highlights
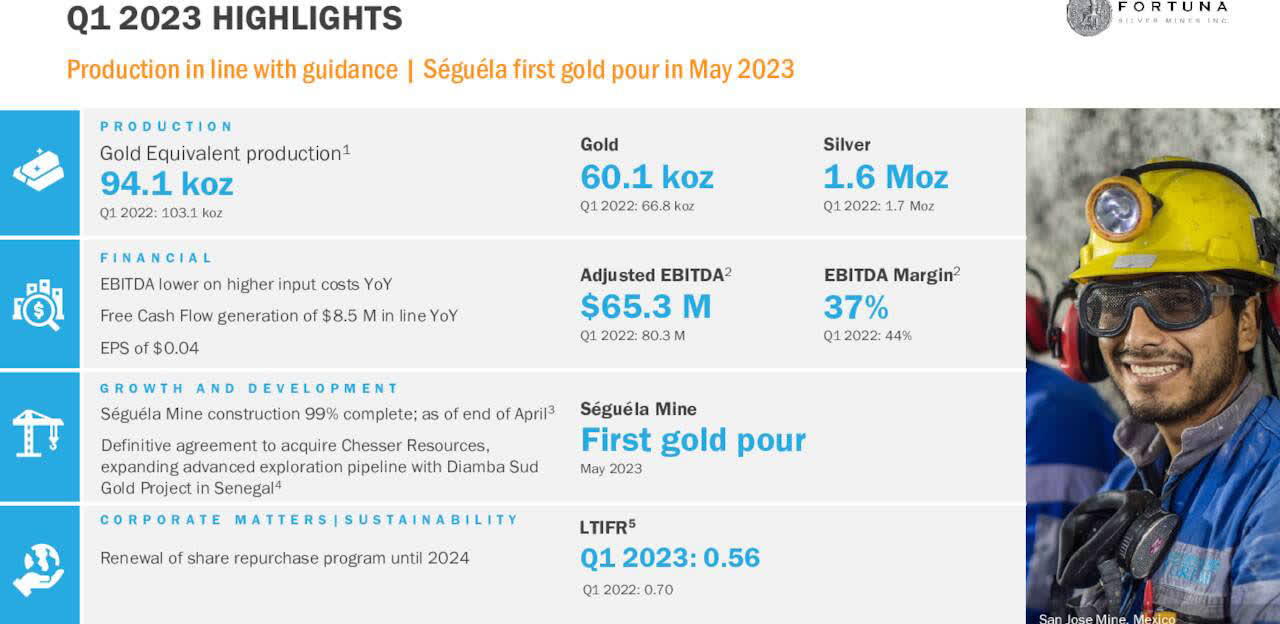
Fortuna Silver Mines' revenues were $175.65 million, with a net income of $11.86 million or $0.04 per diluted share in 1Q23. It compares to a net income of $26.07 million, or $0.09 per diluted share in the same quarter a year ago.
FSM 1Q23 Highlights (FSM Presentation)
Fortuna produced 60,092 Au ounces and 1,586,378 Ag ounces in 1Q23. This represents 94,110 GEOs compared to 103,097 GEOs in 1Q22.
CEO Jorge Alberto Ganoza said in the conference call:
Subsequent to the end of the quarter, we have had a few relevant events of importance that I want to mention. During April at the San Jose mine in Mexico, we had to contend with a 15-day stoppage derived from a union claim demanding increase in profit sharing beyond what's stipulated by law this dispute has been resolved and operations resumed.
Fortuna Silver Mines' revenues were $175.65 million, with a net income of $11.86 million or $0.04 per diluted share in 1Q23. One significant achievement is the Seguela gold mine is now producing.
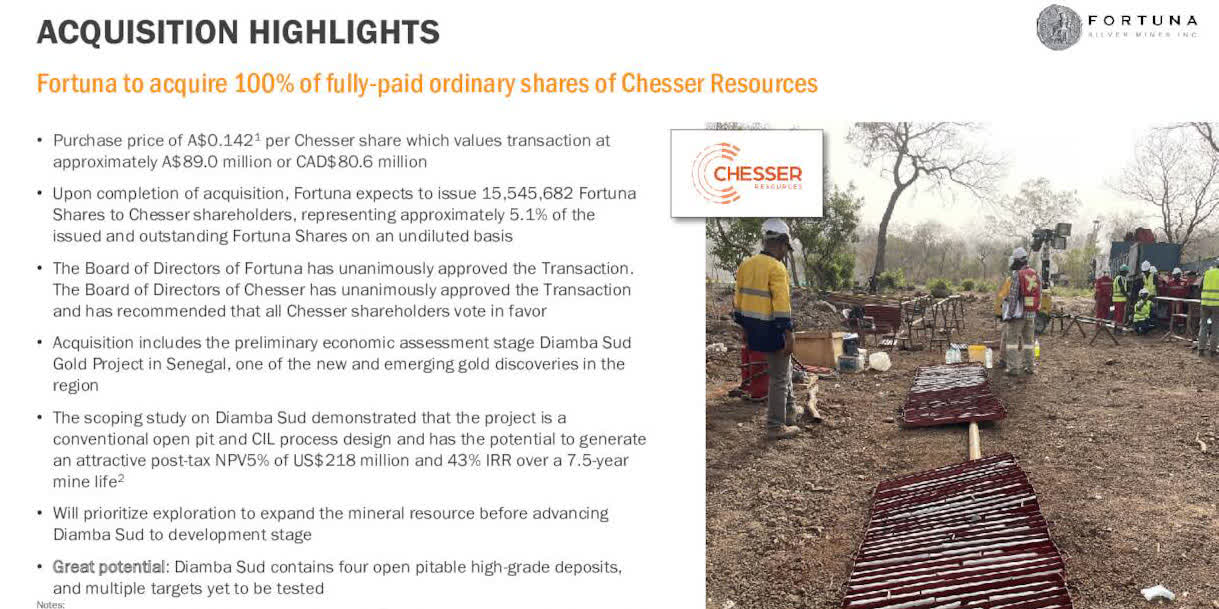
On May 8, 2023, Fortuna Silver Mines acquired Chesser Resources (West Africa) in an all-shares deal (emphasis added):
The transaction as contemplated by the Agreement (the "Transaction") will be implemented by way of a scheme of arrangement pursuant to Part 5.1 of the Australian Corporations Act 2001 (Cth) ("Scheme"). Upon implementation of the Scheme, Fortuna expects to issue up to 15,545,682 Fortuna Shares to Chesser shareholders, representing approximately 5.1% of the issued and outstanding Fortuna Shares on an undiluted basis.
The acquisition of Chesser will expand Fortuna's presence in West Africa to include the preliminary economic assessment stage Diamba Sud Gold Project ("Diamba Sud") in Senegal, one of the new and emerging gold discoveries in the region.
FSM Chesser Resources (FSM Presentation)
2 - Gold and Silver Prices
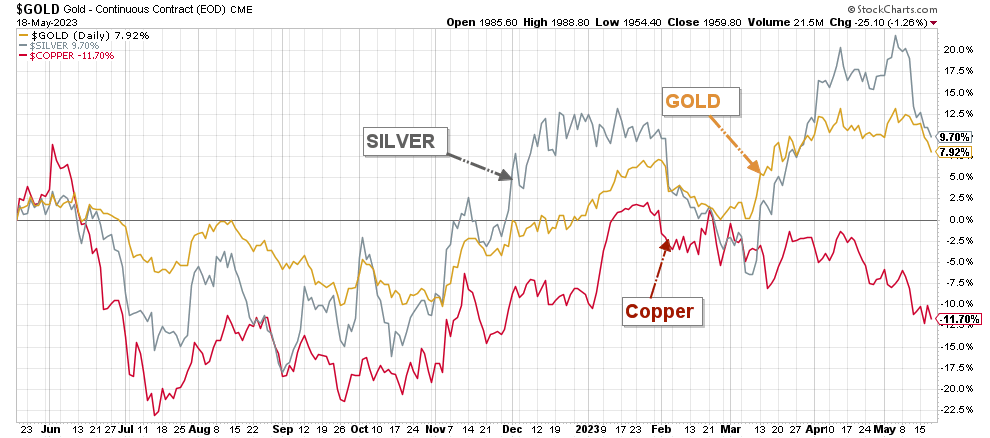
Due to the Fed's hawkish position against rampant inflation, gold, and silver prices dropped significantly in 2022. However, the situation drastically changed in 2023, with inflation slowly decreasing and the Fed searching for a new strategy. As we can see below, volatility is rising:
FSM 1-Year Chart Gold, Silver, Copper (Fun Trading StockCharts)
3 - Stock Performance
Fortuna Silver Mines Inc. has recovered significantly since October 2022 and is now up 10% on a one-year basis. However, the recent rally in gold and silver seems to be fading quickly now.
Fortuna Silver Mines: Financials and Production in 1Q23 - The Raw Numbers
| FSM |
| 1Q22 |
| 2Q22 |
| 3Q22 |
| 4Q22 |
| 1Q23 |
| Total Revenues in $ Million |
| 182.3 |
| 167.9 |
| 166.57 |
| 164.72 |
| 175.65 |
| Net income in $ Million |
| 26.1 |
| 2.3 |
| -3.8 |
| -152.77 |
| 11.86 |
| EBITDA $ Million |
| 75.0 |
| 61.9 |
| 50.9 |
| -126.5 |
| 66.68 |
| EPS diluted in $/share |
| 0.09 |
| 0.01 |
| -0.01 |
| -0.52 |
| 0.04 |
| Cash from operating activities in $ Million |
| 33.2 |
| 47.4 |
| 64.7 |
| 49.6 |
| 41.8 |
| Capital Expenditure in $ Million |
| 65.0 |
| 54.0 |
| 58.9 |
| 73.3 |
| 63.1 |
| Free Cash Flow in $ Million |
| -31.8 |
| -6.6 |
| 5.7 |
| -23.7 |
| -21.4 |
| Total cash $ Million |
| 110.7 |
| 116.4 |
| 91.0 |
| 80.6 |
| 85.12 |
| Total debt in $ Million |
| 198.0 |
| 218.6 |
| 204.2 |
| 219.2 |
| 244.9 |
| Shares outstanding (diluted) in Million |
| 294.6 |
| 295.2 |
| 291.4 |
| 290.2 |
| 292.4 |
| Silver and Gold Production |
| 1Q22 |
| 2Q22 |
| 3Q22 |
| 4Q22 |
| 1Q23 |
| Silver Production in M Oz |
| 1,670,128 |
| 1,652,895 |
| 1,837.506 |
| 1,746,746 |
| 1,586,378 |
| Gold production in K Oz |
| 66.800 |
| 62,171 |
| 66,344 |
| 64,112 |
| 60,092 |
| Gold price realized $/Oz |
| 1,884 |
| 1,869 |
| 1,718 |
| 1,802 |
| 1,893 |
| Silver price realized $/Oz |
| 24.18 |
| 22.62 |
| 19.16 |
| 21,75 |
| 22.52 |
| Zinc M lbs |
| 10,827 |
| 10,886 |
| 11,885 |
| 12,575 |
| 13,051 |
| Lead M lbs |
| 9,134 |
| 7,637 |
| 9,085 |
| 8,735 |
| 9,509 |
Source: Company material .
Part II - Gold and Silver Production Details
For 1Q23, Fortuna Silver Mines produced 1,586,378 ounces of silver and 60,092 ounces of gold. It translates to 94,110 GEOs.
FSM Quarterly Production Gold and Silver History (Fun Trading)
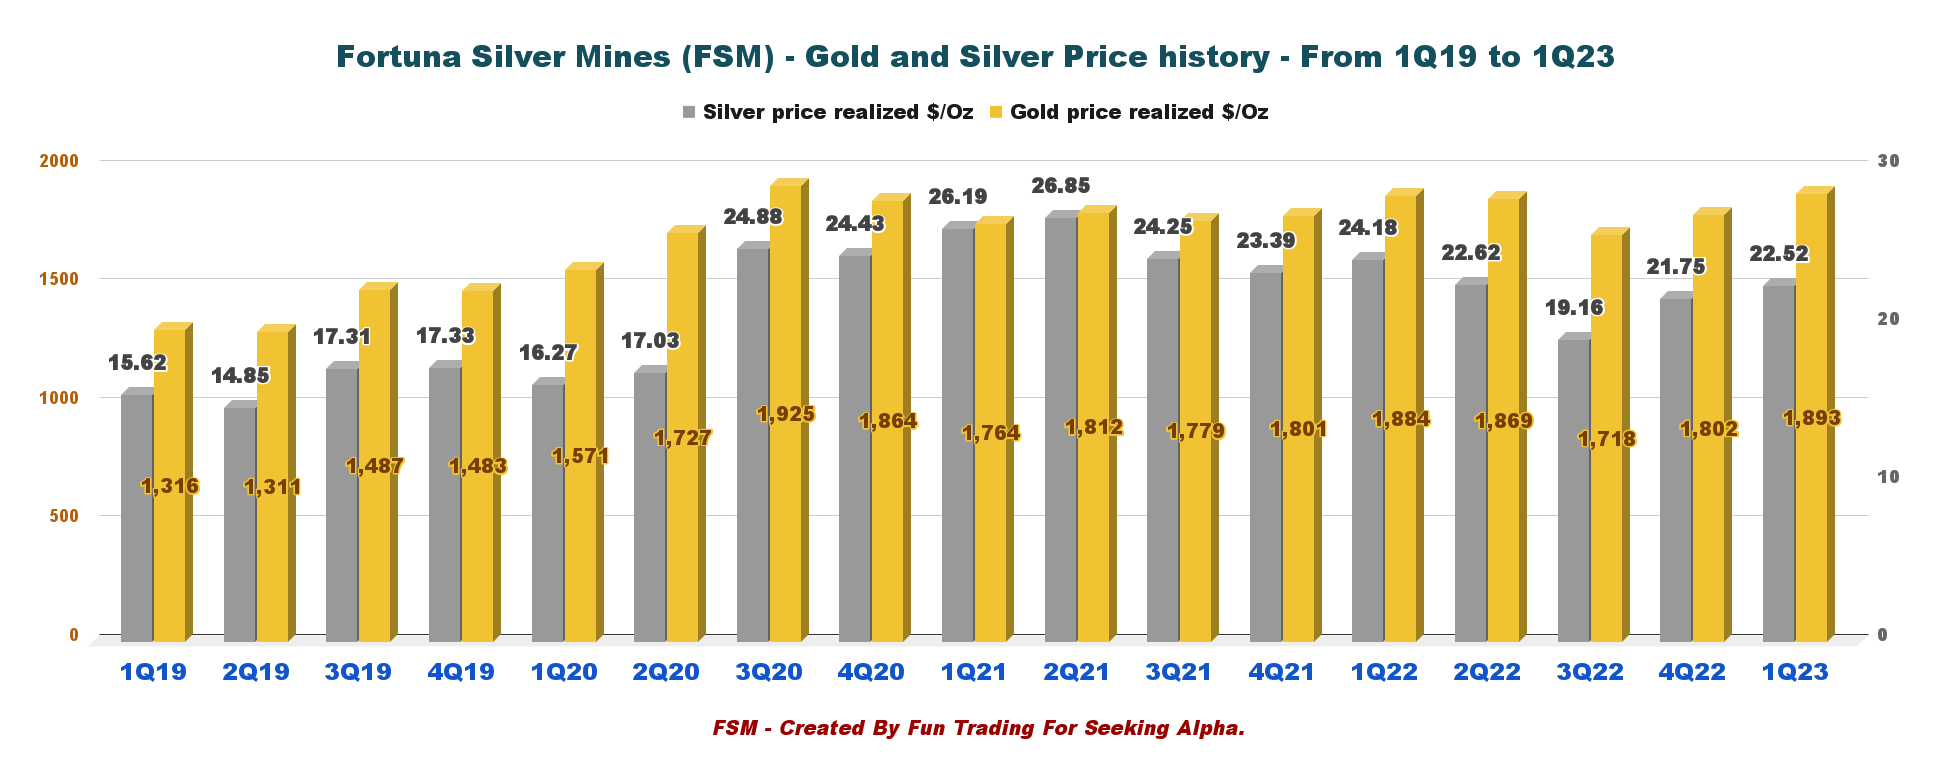
1 - Gold and Silver Prices History
The gold price was $1,893 per ounce, and the silver price was $22.52 per ounce.
FSM Quarterly Gold and Silver Price History (Fun Trading)
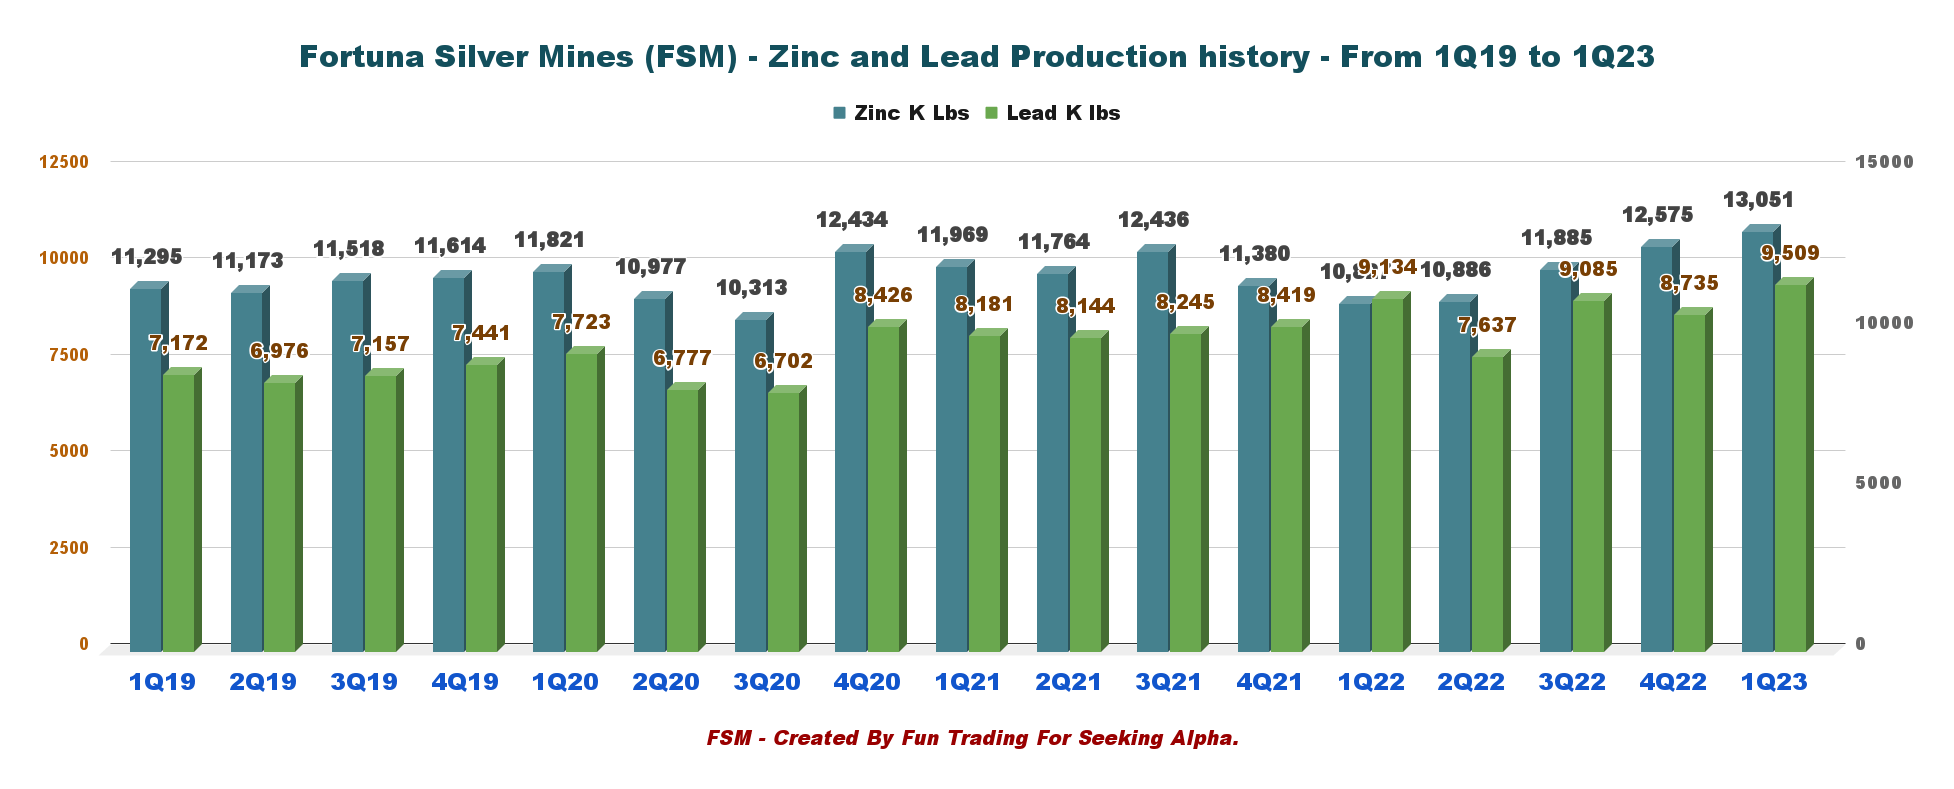
2 - Zinc and Lead Production History (Caylloma Mine)
Production in 1Q23 for lead was 9.509 Mlbs and 13.051 Mlbs for zinc.
FSM Quarterly Production of Lead and Zinc History (Fun Trading)
3 - Details Per Mine and Metal Produced
| Production per mine |
| Gold Oz |
| Silver Oz |
| Lead KLbs |
| Zinc KLbs |
| Lindero Mine, Argentina |
| 25,528 |
| 0 |
| 0 |
| 0 |
| Yaramoko Complex Burkina Faso |
| 26,437 |
| 0 |
| 0 |
| 0 |
| San Jose Mine Mexico |
| 8,231 |
| 1,303,312 |
| 0 |
| 0 |
| Caylloma Mine Peru |
| 166 |
| 283,066 |
| 9,509 |
| 13,051 |
| Total |
| 60,092 |
| 1,586,378 |
| 9,509 |
| 13,051 |
5 - 2023 Guidance and AISC (Including Seguela)
FSM 2023 Guidance (FSM Presentation)
Part III - Balance Sheet Commentary
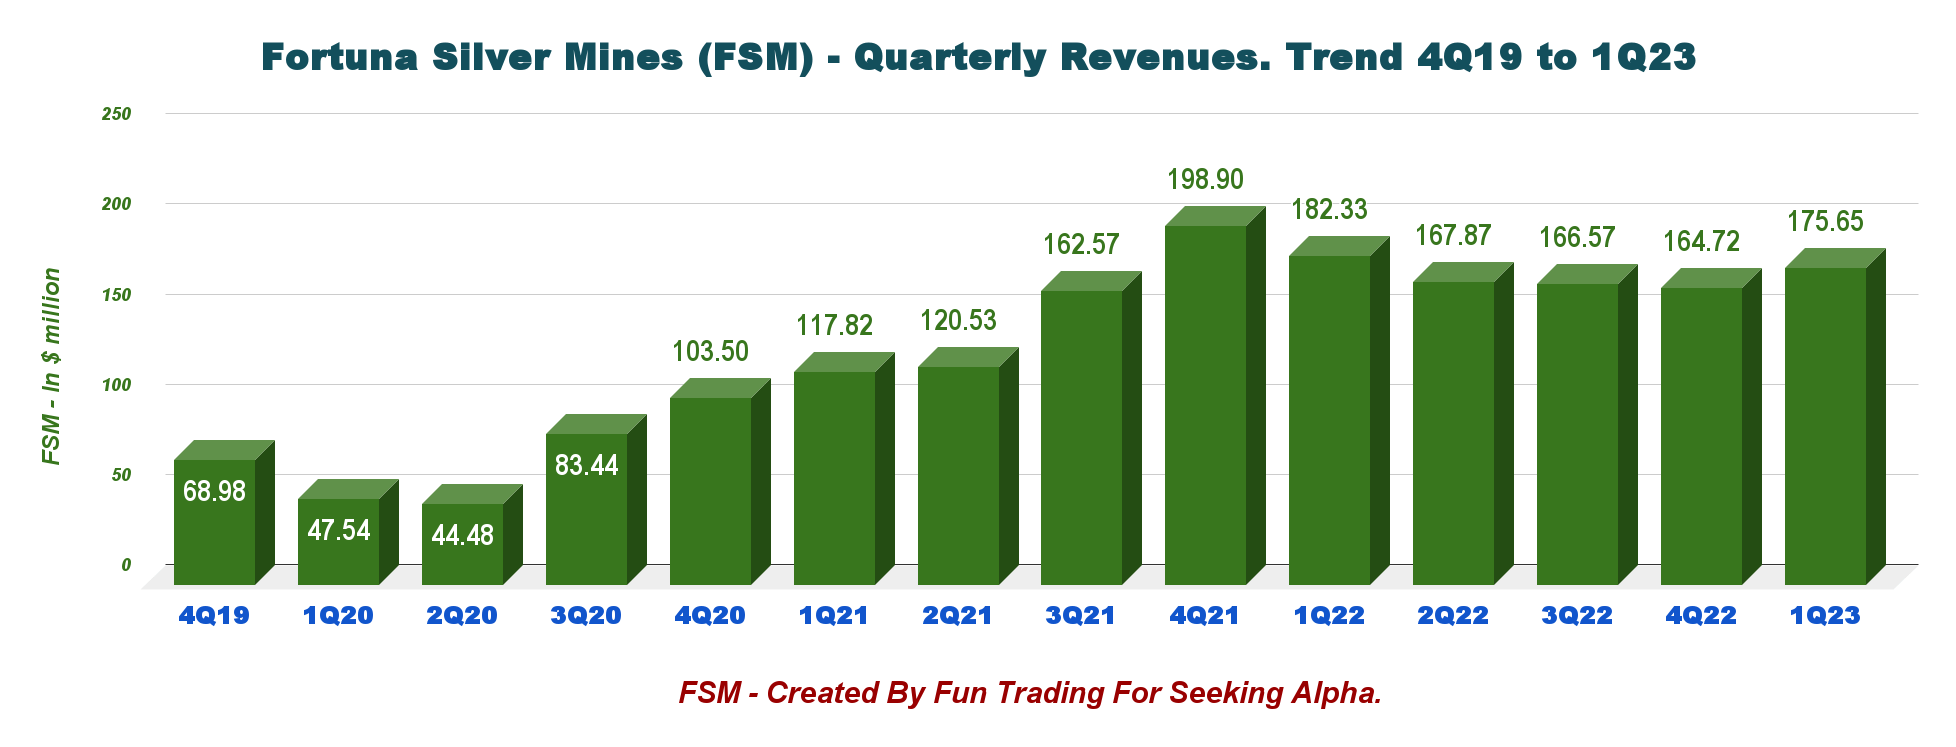
1 - Fortuna Silver Mines' Revenues were $175.65 Million in 1Q23
FSM Quarterly Revenue History (Fun Trading)
The net income was $11.86 million or $0.04 per share, compared with an income of $26.07 million or $0.09 per share reported in 1Q22.
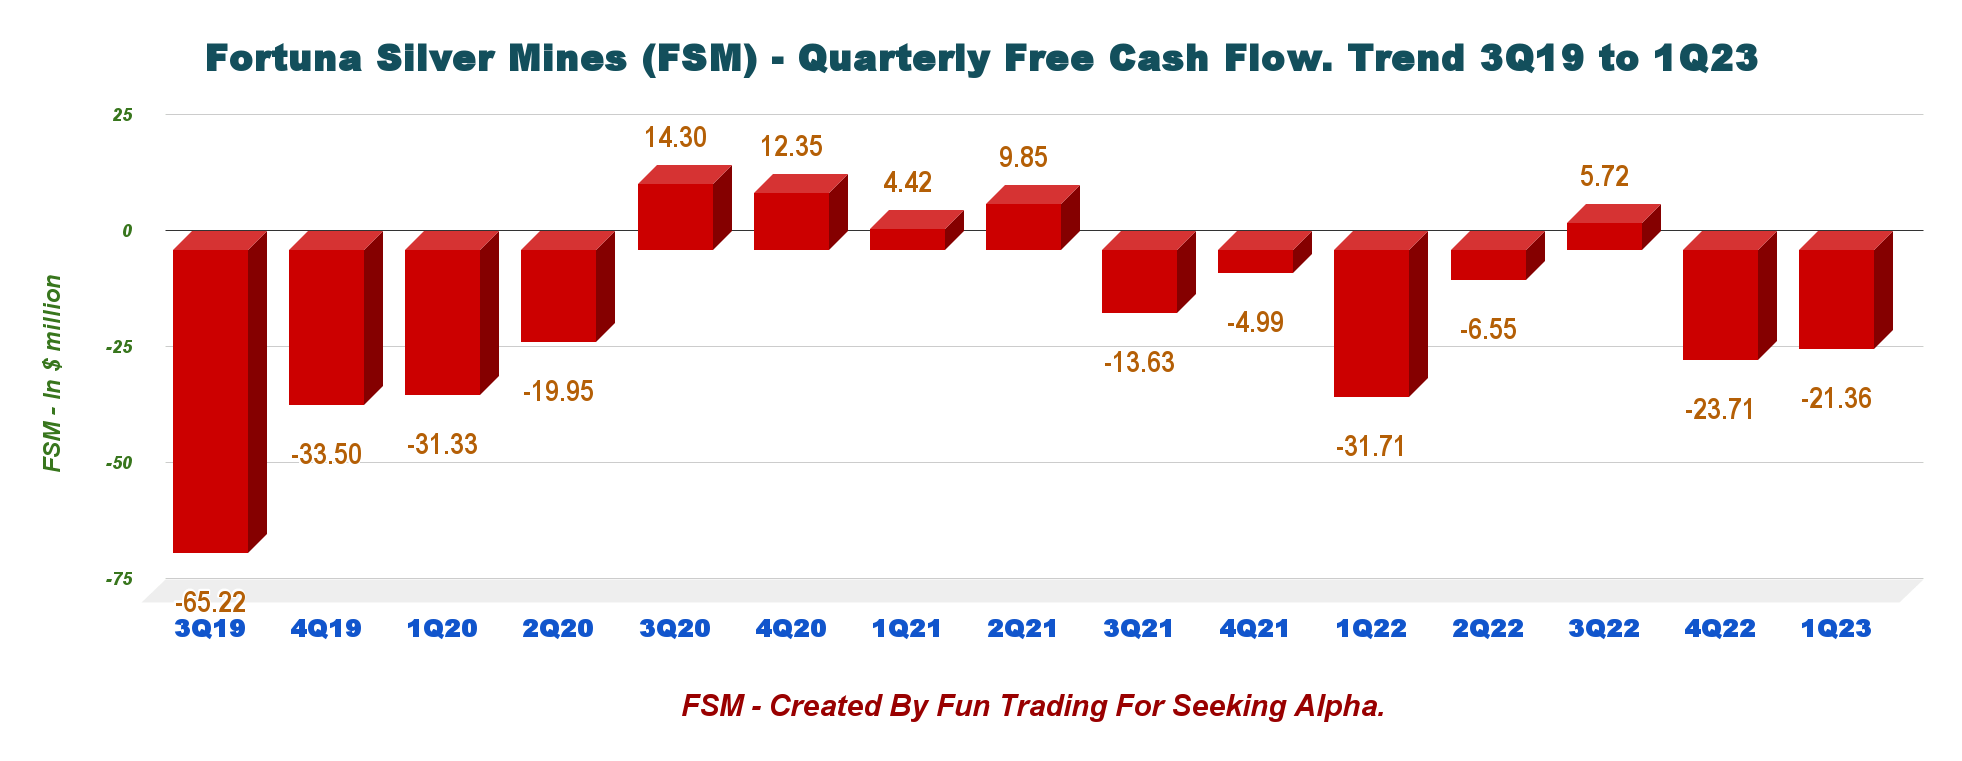
2 - Fortuna Silver Reported a 1Q23 Free Cash Loss of $21.36 Million
FSM Quarterly Free Cash Flow History (Fun Trading)
FSM's trailing 12-month free cash flow was a loss of $45.9 million, with a loss of $21.36 million in 1Q23.
Note: On May 2, 2022, the company initiated a share repurchase program to purchase up to 5% of its issued and outstanding common shares, expiring May 1, 2023, but renewed recently.
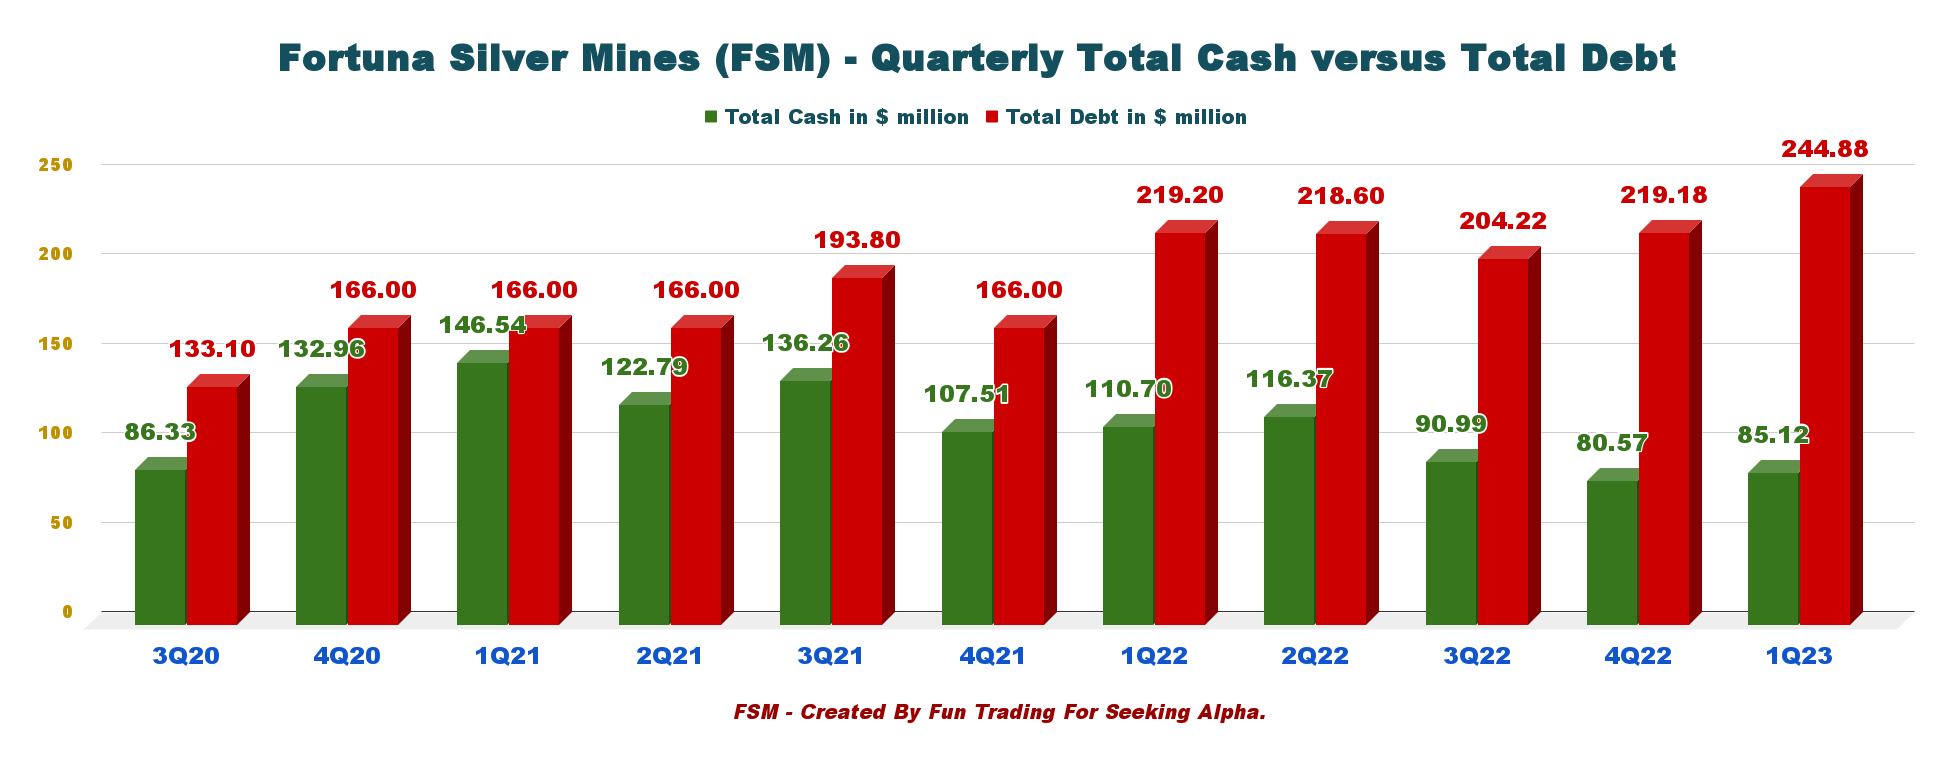
3 - Fortuna's Total Debt was $219.18 Million on December 31, 2022
FSM Quarterly Cash versus Debt History (Fun Trading)
As of March 31, 2023, the company had cash equivalents of $85.12 million and total debt of $244.48 million.
The total liquidity available to the Company as of March 31, 2023, was $129.7 million.
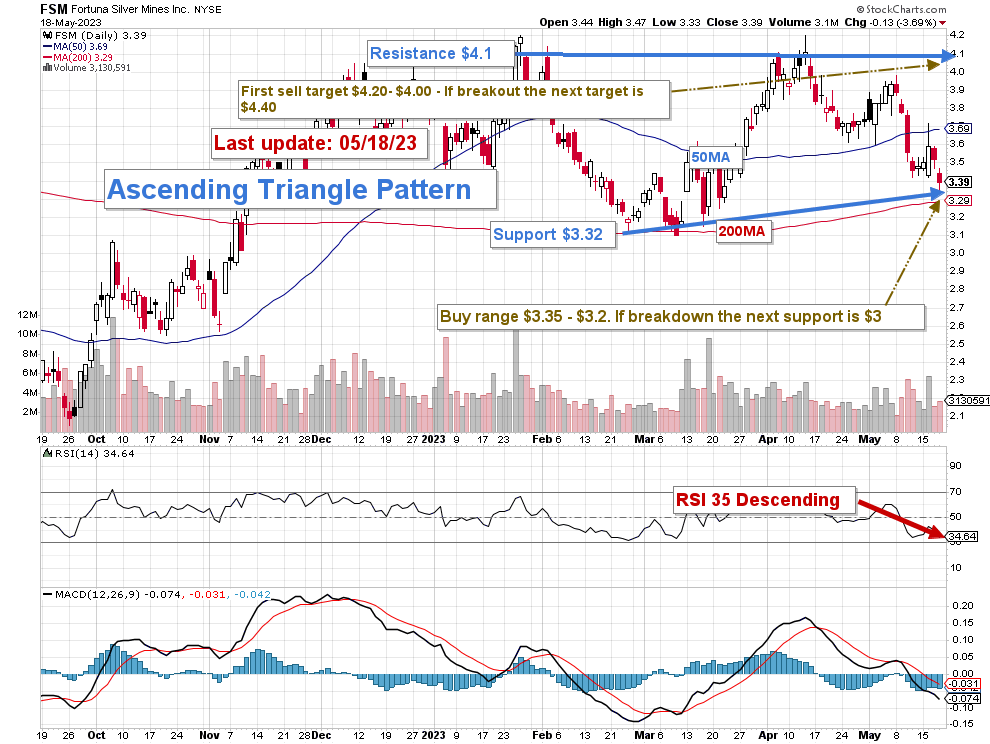
Part IV - Technical Analysis (Short Term) and Commentary
FSM TA Chart Short-term (Fun Trading StockCharts) FSM forms an ascending triangle pattern with resistance at $4.10 and support at $3.32. The ascending triangle is a bullish candlestick chart pattern that occurs in a mid-trend and signals a likely continuation of the overall trend. It's one of the most common chart patterns as it's quite easy to form - consisting of two simple trend lines. The price action temporarily pauses the uptrend as buyers are consolidating. This pause is marked with higher lows pushing for a breakout to the upside, which then activates the pattern. I regularly promote the general strategy in my marketplace to keep a core long-term position and use about 40% to trade short-term LIFO. It allows you to wait for a higher final price target for your core position between $5 and $6, a possible target in 2023.
For the short-term trading, I suggest selling Fortuna Silver Mines Inc. stock partially between $4 and $4.20 with possible upper resistance at $4.4 and waiting for a retracement between $3.35-$3.2, with likely lower support at $3.
Watch the gold and silver prices like a hawk.
Warning: The TA chart must be updated frequently to be relevant. It is what I am doing in my stock tracker. The chart above has a possible validity of about a week. Remember, the TA chart is a tool only to help you adopt the right strategy. It is not a way to foresee the future. No one and nothing can.
For further details see:
Fortuna Silver Mines: The Seguela Mine Is A Go