OTC:CC - FPA Crescent Fund Second Quarter 2023 Commentary
2023-08-19 10:20:00 ET
Summary
- First Pacific Advisors (FPA) is a Los Angeles-based institutional money management firm practicing a disciplined approach to value investing, prudently seeking superior long-term returns while maintaining a focus on capital preservation.
- FPA Crescent Fund gained 6.29% in Q2 2023 and 16.13% in the trailing twelve months, outperforming its average net risk exposure.
- Open Text was a short-lived holding due to a large acquisition announcement, while Broadcom has been a successful holding for almost five years.
- The fund focuses on bottom-up analysis and has a track record of generating equity-like returns with less risk than the equity market.
Dear Shareholder
Performance Overview
The FPA Crescent Fund – Institutional Class ( FPCSX , “Fund” or “Crescent”) gained 6.29% in Q2 2023 and 16.13% in the trailing twelve months. 1 The Fund captured 97.6% of the MSCI ACWI’s return in the trailing twelve months, outperforming its 73.8% average net risk exposure. 2
Performance versus Illustrative Indices 3
| Q2 2023 |
| Trailing 12-month |
| FPA Crescent |
| 6.29% |
| 16.13% |
| FPA Crescent – Long Equity |
| 9.09% |
| 21.38% |
| MSCI ACWI |
| 6.18% |
| 16.53% |
| S&P 500 |
| 8.74% |
| 19.59% |
| 60% MSCI ACWI / 40% Bloomberg US Agg |
| 3.36% |
| 9.44% |
| 60% S&P 500 / 40% Bloomberg US Agg |
| 4.86% |
| 11.24% |
Portfolio discussion
There wasn’t a unifying theme that drove performance in the last year. In the previous twelve months, Crescent’s top five performers contributed 6.19% to its return, while its bottom five detracted 1.54%.
Trailing Twelve-Month Contributors and Detractors as of June 30, 2023 4
| Contributors |
| Perf. Cont. |
| Avg. % of Port. |
| Detractors |
| Perf. Cont. |
| Avg. % of Port. |
| Holcim |
| 1.77% |
| 3.2% |
| Int’l Flavors & Fragrances |
| -0.51% |
| 1.8% |
| Meta Platforms |
| 1.32% |
| 1.8% |
| Charter Communications |
| -0.49% |
| 1.7% |
| Broadcom |
| 1.17% |
| 1.9% |
| McDermott (multiple securities) |
| -0.19% |
| 0.7% |
| Analog Devices |
| 1.02% |
| 3.0% |
| Open Text |
| -0.18% |
| 0.2% |
| FPS (shipping investment) |
| 0.91% |
| 2.7% |
| Herbalife (multiple securities) |
| -0.16% |
| 0.4% |
| 6.19% |
| 12.6% |
| -1.54% |
| 4.7% |
| 1 Effective September 4, 2020, the previous single class of shares of the Fund was renamed the Institutional Class shares. Unless otherwise noted, all data herein is representative of the Institutional Share Class. 2 Risk assets are any assets that are not risk free and generally refers to any financial security or instrument, such as equities, commodities, high-yield bonds, and other financial products that are likely to fluctuate in price. Risk exposure refers to the Fund’s exposure to risk assets as a percent of total assets. The Fund’s net risk exposure as of June 30, 2023 was 73.0%. 3 Comparison to the indices is for illustrative purposes only. The Fund does not include outperformance of any index or benchmark in its investment objectives. An investor cannot invest directly in an index. The long equity segment of the Fund is presented gross of investment management fees, transactions costs, and Fund operating expenses, which if included, would reduce the returns presented. Long equity holdings only includes equity securities excluding paired trades, short-sales, and preferred securities. The long equity performance information shown herein is for illustrative purposes only and may not reflect the impact of material economic or market factors. No representation is being made that any account, product, or strategy will or is likely to achieve profits, losses, or results similar to those shown. Long equity performance does not represent the return an investor in the Fund can or should expect to receive. Fund shareholders may only invest or redeem their shares at net asset value. 4 Reflects the top five contributors and detractors to the Fund’s performance based on contribution to return for the trailing twelve months (“TTM”). Contribution is presented gross of investment management fees, transactions costs, and Fund operating expenses, which if included, would reduce the returns presented. Percent of portfolio reflects the average position size over the period. The information provided does not reflect all positions purchased, sold or recommended by FPA during the quarter. A copy of the methodology used and a list of every holding’s contribution to the overall Fund’s performance during the TTM is available by contacting FPA Client Service at crm@fpa.com . It should not be assumed that recommendations made in the future will be profitable or will equal the performance of the securities listed. Past performance is no guarantee, nor is it indicative, of future results. |
Of the contributors and detractors listed, we haven’t recently addressed Open Text and Broadcom. We have discussed most of the other positions in the last year, which you can find in our archived commentaries.
Open Text ( OTEX ) was a relatively short-lived holding in comparison to our typical time frame. We were attracted to this Canadian-based provider of enterprise software due to its stable revenue stream. More than 80% of Open Text’s revenue was recurring, which helped deliver attractive mid-30s EBITDA margins. We considered the business to have a sticky customer base that included 97 of the 100 largest companies in the world. Purchased at a low double-digit multiple to after-tax free cash flow, we expected to own the company for years, with capital deployment going towards dividends, buybacks, and small bolt-on acquisitions, as it had in the past. Unfortunately, to our surprise, while we owned the stock, Open Text announced a relatively large acquisition in the form of UK-based Micro Focus. Familiar with the target, we were unenthused about both the asset and increased debt on the balance sheet from funding the purchase, so we chose to exit stage left rather than try to re-write our investment thesis. [1]
In contrast to our short-lived ownership of Open Text, Broadcom ( AVGO ) has been a holding for just short of five years. At the time of our original purchase, the company was primarily focused on driving organic growth in its existing semiconductor franchises and acquiring new ones when the opportunity presented itself. As potential acquisition candidates in the industry became scarce, management, led by highly regarded Hock Tan, pivoted to set their sights on the software industry, culminating in several acquisitions. Unlike Open Text, in this instance, after multiple discussions with senior management, we found ourselves comfortable with the company's new strategy after re-examining the investment implications. We are glad we did, as it would be an understatement to say that Broadcom has gone from strength to strength over the past five years, improving operating margins, aggressively repurchasing shares, and increasing the dividend, all the while continuing to execute its M&A strategy flawlessly.
“Risk on” in 2023 has replaced the fear that drove markets lower in 2022. How much of this rebound will ultimately be supported by corporate earnings has yet to be seen. While there is always something to fear, we prefer to focus on the future prospects of the businesses we own. Focusing on the destination makes the big potholes in the road feel more like small speed bumps and prevents us from executing panicked driving maneuvers.
Looking back at the past 18 months, there was certainly no shortage of opportunities to take down risk exposure as macro concerns, from interest rates to war, seemed to grow by the day. But as in prior market declines, we attempted to lean into the market and add to either new or existing names where our estimates of the risk/reward improved with each leg down. While we will never get it perfectly right, using the MSCI ACWI as a proxy, in the downturn from January 5, 2022 through the market low of October 12, 2022,
Crescent experienced a drop in value of 16.96%. While not ideal, this was more palatable than the ACWI’s 26.36% decline in the same period. Including the decline, the Fund’s recovery also puts us in the plus column (+1.00%), as compared to the ACWI, which is still in the red (-7.44%). [2]
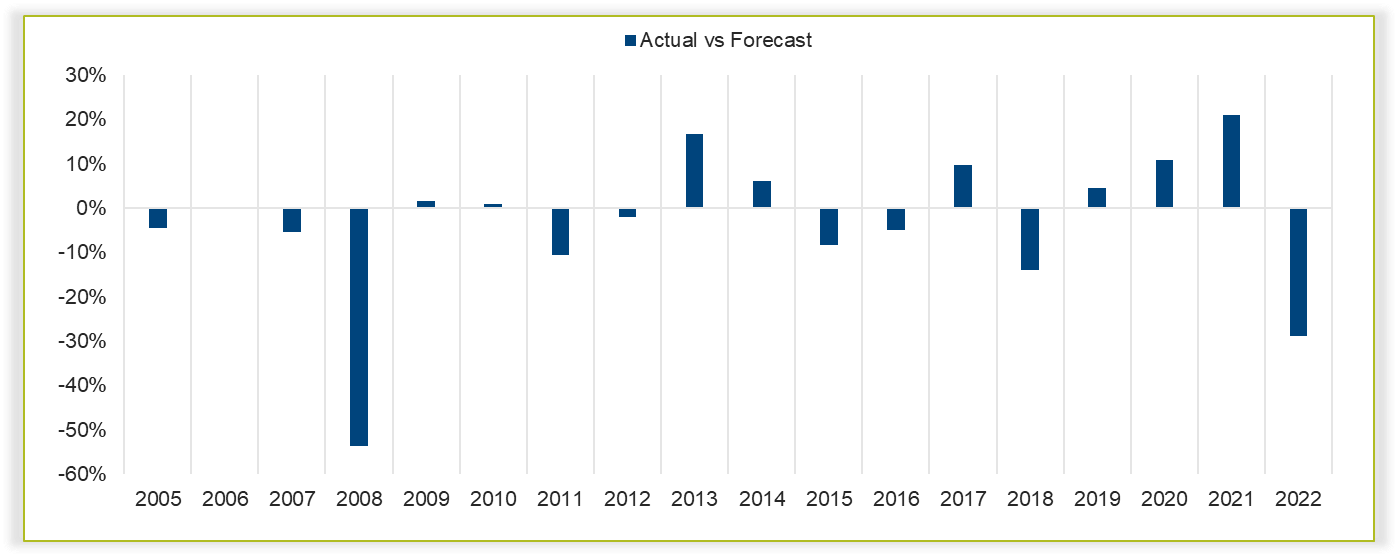
Looking forward, we do not offer a market forecast or make predictions about interest rates, the economy, or other significant macro issues because we don't know anyone who can do so consistently (ourselves included). We submit the following to show the futility of forecasting. In the last eighteen years, the consensus view only expected the market to increase, yet it declined 22% of the time. Further, the Wall Street consensus estimate of how the S&P 500 will perform (ex-dividends) in the next twelve months, from 2005 to 2022, usually missed the mark, often by quite a lot – 53.6% and 28.9% too high in 2008 and 2022; and 16.9% and 21.0% too low in 2013 and 2021. On average, the "experts" missed by 11.4%, quite a lot, particularly when compared to the S&P's 6.6% annualized return (before dividends) over the same period.
We, therefore, direct our efforts from the bottom up rather than the top down.
S&P 500 Actual vs Wall Street Analysts’ Forecasted Returns Ex-Dividends [3]
FPA Crescent – The First 30 years
The FPA Crescent Fund celebrated its 30 th anniversary in June. We are pleased the Fund has met its goal of generating equity-like returns over the long-term through multiple market cycles over its thirty-year history, achieving this favorable track record by focusing on a margin of safety, which meant shunning, at times, investments that may have been temporarily in favor.
More specifically, since inception, Crescent has exposed investor capital to less risk than the equity market, on average, generating 95% of the S&P 500’s wealth creation while “risking” just 65% of the dollars invested in the Fund, with 53% invested in common stocks and 12% in more senior instruments such as corporate bonds. [4] Reducing risk further, the Fund has avoided any meaningful interest rate exposure and has eschewed the use of leverage.
For those who prefer less up and down, especially when price moves precipitate an often-inappropriate action – buy or sell, Crescent’s mandate is as relevant to investors today as when the Fund launched in 1993. Though we don’t know what the next thirty years hold, we strive to continue to offer a similar investor experience. These last three decades have given us surprises and market excess; the recent pandemic, the internet bubble, September 11, millennia-low interest rates, and the Great Financial Crisis, to name a few. We will be surprised, but probably not astonished, in the future. We promise to remain thoughtful and calm as we continue to steward your capital, traits that allow us to lean in when there’s the opportunity and tilt away when there is none, like when we increased risk exposure during the Great Financial Crisis and Covid, but reduced it in the preceding periods.
While Steven founded the Fund, Brian and Mark have been around for about half its existence. During this period, we would like to think we have pushed each other to evolve and stay relevant, and fingers crossed, our continuing education is far from over. However regardless of the times, we think sensible optimism mixed with a dash of prudence will never go out of fashion, even if our haircuts may.
Closing
Steven reflected on his last thirty-eight years in a recent Speech at the Morningstar Conference titled “Evolution of a Value Investor,” available on our website. He also wrote a chapter introduction for the new 7th Edition of Graham & Dodd’s Security Analysis. We will have copies available for those joining us in Boston on September 12 for our 30th-anniversary celebration and investor update.
Thank you for entrusting us with your capital since 1993, but as we say goodbye to the past, we look forward to what the future holds.
Respectfully submitted,
FPA Crescent Portfolio Managers
Footnotes[1] Source: www.investors.opentext.com/press-releases ; OpenText to Acquire Micro Focus International plc ; August 25, 2022. [2] Source: Morningstar. The recovery performance noted is cumulative for the period January 5, 2022 through June 30, 2023. Past performance is no guarantee, nor is it indicative, of future results. [3] Source: Bloomberg; Chart shows actual S&P 500 price returns excluding dividends minus Wall Street analyst estimates. Chart period is 2005-2022. [4] Note: The performance noted is since inception, but the average net risk exposure of 65% and portfolio allocations reflect the period March 1, 1996 – June 30, 2023, and is shown for the Institutional Class shares. Data prior to March 1, 1996 is not available. If included, these statistics may differ materially, depending upon the time period. Past performance is no guarantee, nor is it indicative, of future results. |
Editor's Note: The summary bullets for this article were chosen by Seeking Alpha editors.
For further details see:
FPA Crescent Fund Second Quarter 2023 Commentary