UGIC - FPA Queens Road Small Cap Value Fund Second Quarter 2022 Commentary
- First Pacific Advisors (FPA) is a Los Angeles-based institutional money management firm practicing a disciplined approach to value investing, prudently seeking superior long-term returns while maintaining a focus on capital preservation.
- The FPA Queens Road Small Cap Value Fund (“Fund”) returned -11.46% in the second quarter of 2022.
- During times of market weakness, we expect to outperform in down markets and trail somewhat in robust markets.
- We believe small-cap valuations are more compelling than their large-cap peers.
- The Fund has historically held cash as a residual of the investment process: when we cannot find companies that meet our stringent criteria, we will allow cash to build.
| Average Annual Total Returns (%)* |
| Trailing Performance (%) |
| Current Market Cycle Performance |
| As of Date: 6/30/2022 |
| Inception |
| 15 Years |
| 10 Years |
| 5 Years |
| 3 Years |
| 1 Year |
| QTD |
| 6/5/07- 6/30/2022 |
| FPA Queens Road Small Cap Value |
| 9.0[1][2] |
| 6.60 |
| 9.10 |
| 7.41 |
| 9.77 |
| -9.15 |
| -11.46 |
| 6.40 |
| Russell 2000 Value Index |
| 7.91 |
| 5.58 |
| 9.05 |
| 4.89 |
| 6.18 |
| -16.28 |
| -15.28 |
| 5.31 |
| You should consider the Fund's investment objectives, risks, and charges and expenses carefully before you invest. The Prospectus details the Fund's objective and policies and other matters of interest to a prospective investor. Please read the Prospectus carefully before investing. The Prospectus may be obtained by visiting the website at www.fpa.com, by calling toll-free, 1-800-982-4372, or by contacting the Fund in writing. Past performance is no guarantee of future results and current performance may be higher or lower than the performance shown. This data represents past performance and investors should understand that investment returns and principal values fluctuate, so that when you redeem your investment it may be worth more or less than its original cost. Current month-end performance data, which may be lower or higher than the performance data quoted, may be obtained at www.fpa.com or by calling toll-free, 1-800-982-4372. The FPA Queens Road Small Cap Value Fund (“Fund”) commenced operations on June 13, 2002. Fund performance shown is for the Investor Class shares ( QRSVX ). Periods greater than one year are annualized. Fund performance is shown net of all fees and expenses and includes reinvestment of all distributions. Fund performance does not reflect the deduction of taxes that a shareholder would pay on Fund distributions or the redemption of Fund shares, which would lower these figures. An investor cannot invest directly in an index. * Prior to November 1, 2020, the performance shown reflects the historical performance of the Fund when Bragg Financial Advisors, Inc. ("BFA") served as investment adviser of the Fund. Effective November 1, 2020, FPA became the investment adviser of the Fund and BFA transitioned to serving as the sub-adviser. BFA continues to be responsible for the day-to-day management of the Fund, subject to FPA's oversight. No changes to the Fund's principal investment strategies were made in connection with these changes in management of the Fund, and Steve Scruggs, CFA, Director of Research and Senior Portfolio Manager for BFA, continues to serve as the portfolio manager for the Fund. From inception of the Fund to December 31, 2004, BFA and its affiliates voluntarily absorbed certain expenses of the Fund and voluntarily waived its management fee. Had BFA not done this, returns would have been lower during that period. Effective January 1, 2005 through October 31, 2020, BFA charged a single unitary management fee and contractually agreed to pay all operating expenses of the Fund except for brokerage, taxes, interest, litigation expenses, and other extraordinary expenses. The Fund's Total Annual Operating Expenses before reimbursement is 1.07% (Investor Class), 0.96 % (Advisor Class), and 0.91% (Institutional Class) as of the most recent prospectus. As of the most recent prospectus, First Pacific Advisors, LP, the Fund’s Adviser, has contractually agreed to waive its management fees and to make payments to limit Fund expenses, until February 1, 2024, so that the total annual operating expenses (excluding interest, taxes, brokerage fees and commissions payable by the Fund in connection with the purchase or sale of portfolio securities, fees and expenses of other funds in which the Fund invests, and extraordinary expenses, including litigation expenses not incurred in the Fund’s ordinary course of business) of the Fund do not exceed 1.04%, 0.99% and 0.89%, for Investor Class, Advisor Class, and Institutional Class shares, respectively. These fee waivers and expense reimbursements are subject to possible recoupment by the adviser from the Fund in future years (within the three years from the date when the amount is waived or reimbursed) if such recoupment can be achieved within the lesser of the foregoing expense limits or the then-current expense limits. The expense limit agreement may be terminated only by the Fund’s Board of Trustees, upon written notice to the adviser. Prior to November 1, 2020, the Fund had a utilized fee structure that limited annual operating expenses to 1.18%. Market Cycle reflects the most recent market cycle (peak to peak) defined as a period that contains a decline of at least 20% from the previous market peak over at least a two-month period and a rebound to establish a new peak above the previous one by Russell 2000 Value Index. The current cycle is ongoing and thus is presented through the most recent quarter-end. Once the cycle closes, the results presented may differ materially. Please see important disclosures at the end of the commentary |
Dear Fellow Shareholders,
The FPA Queens Road Small Cap Value Fund (“Fund”) returned -11.46% in the second quarter of 2022. This compares to a -15.28% return for the Russell 2000 Value Index in the same period. For the year-to-to date period, through June 30, 2022, the Fund returned -9.15% v -16.28% for the Russell 2000 Value Index.
The Fund’s outperformance versus the index during this most recent downturn is in line with our expectations. During times of market weakness, we expect to outperform in down markets and trail somewhat in robust markets as a result of our diligent, disciplined, and patient investment process.
We think of our investment process as having four pillars:
- Balance Sheet strength – Seek companies with strong balance sheets. We are not comfortable owning companies with significant liabilities (debt, legal, regulatory, pension, or something inherent in the business model) that could cause insolvency concerns when there’s an economic, financial, or other type of crisis. We want to ensure we are invested in companies with staying power.
- Valuation - Normalize economic earnings over full market cycles. Primarily using free cash flow discount valuation models. Require a margin of safety.
- Management - Evaluate management’s track record of laying out a long-term strategy and executing it to achieve their stated objectives.
- Sector and Industry analysis - We want to own companies in growing industries with stable competitive dynamics and favorable economics. Avoid commodity industries, overly competitive industries, and invest in companies that compete in industries that have long-term growth expectations.
For the second quarter of 2022, the Fund’s outperformance was broad-based by industry and company, resulting from our structured process rather than hitting a small number of home runs.
However, the Fund’s overweight position in Synaptics was a large detractor for the quarter. Synaptics is a long-term holding and was a large contributor to 2021 performance. As the valuation stretched, we trimmed the position in late 2021 and early 2022. In addition, we have been taking advantage of the recent volatility to buy back shares at significantly lower prices. [1]
Another item that negatively impacted performance during the first half was the portfolio’s lack of energy stocks. While we maintain an allocation to companies servicing the oil and gas industry, we do not currently have any direct energy holdings. With the Russell 2000 Value energy sector up over the first half, this has detracted from the Fund’s performance. We typically seek to avoid commodity exposure as we have little ability to predict commodity prices.
Furthermore, we think the energy industry historically has had low returns on capital and poor shareholder economics. With the environmental debate over fossil fuels underway, we believe the long-term economics of the industry are going to deteriorate, despite the recent runup in oil prices, which we think is primarily due to geopolitical issues. As a result, we prefer to look for high-quality franchises with differentiated products with pricing power.
Trailing 12 Months ((TTM)) and Q2 2022 Contributors and Detractors 2
| TTM Contributors |
| Performance Contribution |
| Average Percent of Portfolio |
| Detractors |
| Performance Contribution |
| Average P ercent of Portfolio |
| ServisFirst Bancshares ( SFBS ) |
| 0.76% |
| 4.8% |
| American National Group |
| -1.56% |
| 1.8% |
| South Jersey Industries ( SJI ) |
| 0.71% |
| 2.3% |
| MasTec ( MTZ ) |
| -1.16% |
| 3.0% |
| American Equity Investment Life ( AEL ) |
| 0.58% |
| 4.3% |
| PVH |
| -1.07% |
| 2.0% |
| CSG Systems International ( CSGS ) |
| 0.49% |
| 2.0% |
| Schweitzer-Mauduit International |
| -1.02% |
| 2.3% |
| RLI |
| 0.39% |
| 2.8% |
| Oshkosh ( OSK ) |
| -0.86% |
| 2.2% |
| 2.93% |
| 16.2% |
| -5.66% |
| 11.4% |
| Q2 2022 Contributors |
| Performance Contribution |
| Average Percent of Portfolio |
| Detractors |
| Performance Contribution |
| Average p ercent of Portfolio |
| TreeHouse Foods ( THS ) |
| 0.19% |
| 0.8% |
| American National Group |
| -1.96% |
| 1.3% |
| RLI |
| 0.15% |
| 3.0% |
| Synaptics Incorporated ( SYNA ) |
| -1.44% |
| 2.9% |
| Citizens Financial Group ( CFG ) |
| 0.05% |
| 0.4% |
| ServisFirst Bancshares |
| -0.92% |
| 5.0% |
| UGI Corporation ( UGI ) |
| 0.05% |
| 1.1% |
| CNO Financial Group ( CNO ) |
| -0.83% |
| 2.8% |
| Graphic Packaging Holding Company ( GPK ) |
| 0.02% |
| 1.0% |
| Fabrinet ( FN ) |
| -0.72% |
| 3.0% |
| 0.47% |
| 6.3% |
| -5.87% |
| 14.9% |
Trailing 12 Months ((TTM)) Contributors
- ServisFirst Bancshares , a branch-light commercial bank focused on the Southeast, continues to grow at a high double-digit rate. They are adding bankers and loan losses remain low. 3 SFBS’s differentiated model, investing in people over branches, allows them to have best-in-class efficiency metrics while maintaining a conservative lending culture.
- South Jersey Industries shares rose 40% on Feb. 24, 2022, on news that Infrastructure Investment Funds, a private equity fund managed by JP Morgan Investment Management, would take the company private. The deal is scheduled to close in the fourth quarter of 2022. 4
- American Equity Investment Life Holding Company ,a leading writer of fixed index annuities, has continued to transition to its American Equity Investment ( AEL ) 2.0 business model. The plan’s main goals are to diversify the company’s assets into a broader array of investments, including private debt through strategic partnerships, and to increase its use of reinsurance to free up capital. We think this is an interesting, but somewhat aggressive plan. Thus far, the results have been impressive, but we continue to monitor the credit quality of their assets as they move toward achieving their target of having 40% of their portfolio invested in private assets, up from 15.4%. 5
- CSG Systems offers customer service and revenue management software and services, primarily to the telecom industry. Revenue is mostly recurring and non-cyclical. The company continues to diversify its customer base, grow organically, and return cash to shareholders. They recently confirmed 2022 guidance. [6]
- RLI Corp is an Illinois-based specialty insurer with a conservative underwriting culture that routinely puts up a market-leading industry metrics. We think the 9% insider ownership and unique use of the employee stock ownership plan (ESOP) helps align incentives and protect against losses. [7]
Trailing 12 Months ((TTM)) Detractors
- MasTec, Inc. is a specialty engineering and construction firm that builds and services oil & gas pipelines, telecom, renewable energy, and electric utility infrastructure. Founder operators Jorge and Jose Mas own 20% of the company and have done a great job growing the company by rolling up smaller competitors at attractive prices. [8] Share price performance over the last year suffered due to overly optimistic expectations for federal infrastructure stimulus.
- PVH Corp. owns the Tommy Hilfiger and Calvin Klein brands globally. Approximately two-thirds of profits comes from its International segment, where Tommy in particular has a premium positioning, strong same store sales growth and demonstrated pricing power. 9 Shares are down with other fashion and apparel names as investors worry about inventory levels and economic headwinds for consumer spending.
- Mativ Holdings (previously Schweitzer-Mauduit) is a specialty paper and materials maker that has struggled with supply chain issues and cost inflation. In March, the company agreed to an all-stock combination with Neenah, a specialty paper company we had previously researched. We are evaluating the deal.
- Oshkosh Corp. makes trucks and specialty vehicles in four segments: Access Equipment (aerial work platforms and telehandlers), Defense, Fire and Safety, and Commercial. The company has suffered from component shortages and supply chain issues, but we think it has generally performed well otherwise. We remain positive on the company’s long-term prospects.
- TD Synnex , the largest electronics distributor globally, was formed last year from the merger of Tech Data and Synnex. With the merger, the valuable North American market consolidated from three to two and we are cautiously optimistic about the company’s ability to increase margins over time. The industry is relatively non-cyclical and is expected to grow slightly faster than GDP growth.
Market Commentary
Persistently high inflation, rising interest rates, and the ongoing Russia/Ukraine war weighed heavily across the markets during the first half of 2022. The Federal Reserve has stated its primary concern is to get inflation down to its target of 2%, and the resulting quantitative tightening has weighed heavily on markets. As a result, price-to-earnings multiples contracted significantly throughout the first half of the year.
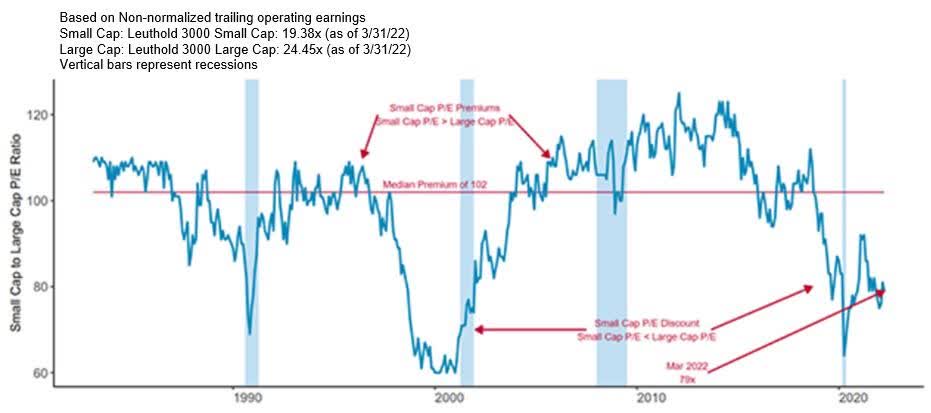
As broad markets have fallen, valuations have come down. We believe small-cap valuations are more compelling than their large-cap peers. The chart below shows the relative valuation of small-cap vs. large-cap stocks over the last 40 years. Over that period, small-cap stocks traded at a median price-to-earnings ratio (P/E) roughly equal to the P/E of large caps. As of March 31, small caps traded at a 20% discount to the P/E of large caps. This is only the third time in the last 40 years that this discount has been this great. As a result, we are slowly putting cash to work.
Small Cap to Large Cap Historical P/E Ratio (x100)
| The Leuthold 3000 Universe is defined as the largest 3,000 securities traded on U.S. exchanges. Universe was segregated into large- and small-cap tiers. Blue vertical bars identify recessionary periods of July 1990 to March 1991, March 2001 to November 2001, December 2007 to June 2009, March 2020 to April 2020. Price/Earnings Ratio (P/E). |
As we look through our portfolio, valuations of the companies we own look very attractive. We think we are getting these attractive valuations because of heightened near-term uncertainty and a potential recession. As always, we focus on balance sheet strength, management quality and long-term industry outlook. We feel confident that the companies we’re invested in have the staying power and long-term ability to adapt and thrive in the uncertain future.
Four Pillar Process
When we go through our process, we weigh the different pillars - balance sheet, valuation, management, and industry - against each other. This isn’t an exact science, but the four pillars keep us from getting too far out in front of our skis.
We’re willing to pay up a little for quality when it makes sense. A company like ServisFirst Bancshares, one of the Fund’s largest holdings, is an example. Servisfirst is a commercial lender that focuses on lower-to-middle market companies. From a valuation perspective, ServisFirst historically has traded for a premium compared to other regional banks, and yet we believe it is a good value due to their strong balance sheet, good management, and stable industry.
Companies like this make up the core of the portfolio. High-quality companies that are reasonably valued with great long-term prospects. We call them long-term compounders and hope to own them forever. Right now, about 75% of the portfolio is in long- compounders.
Don’t get me wrong, we are valuation conscious with these companies, but we are willing to pay a little bit more for higher quality.
The rest of the portfolio is what we consider “quality value”. Value meaning they are cheap, but quality meaning they are not junk – they have a core franchise that we expect to grow a little and throw off cash. They may not have the exceptional character of our long-term compounders, but we think they are good businesses trading at attractive valuations. Often, we find a company that may be experiencing a company specific issue that brings the valuation down to an attractive level.
We focus on the four pillars of our process with these companies as well – they still have strong balance sheets, good management, and must be in good industries - but it’s a matter of degree. Many of those types of companies are trading at 6x – 8x expected earnings. We think these valuation levels will compensate for imperfections in the other pillars.
Portfolio holding PVH is an example of ‘quality value’. The company’s Calvin Klein and Tommy Hilfiger brands have strong recognition and pricing power in their international operations, which is most of their business. The company currently trades at an attractive multiple. However, we know fashion can be fickle, and that there are some concerns with channel inventories, but at the current valuation we think it’s an attractive opportunity. It’s currently a smaller position in the portfolio.
Portfolio Positioning
In the current market downturn, the Fund’s high-quality long-term compounders have held up better than our quality value positions. And so those quality value holdings, and what we are seeing in the universe of good-but-not-great companies, have gotten relatively cheaper. As bottom-up stock pickers, we are always weighing the opportunity set in front of us. But we prefer the long-term compounders – high quality companies that we would expect to outperform over the long term – so we seek to tilt the portfolio in this direction.
The Fund has historically held cash as a residual of the investment process. When we cannot find companies that meet our stringent criteria, we will allow cash to build. Over a long time horizon, we would almost always prefer to own a diversified collection of quality companies (acquired at reasonable prices) instead of cash. But we weigh this against our reluctance to sacrifice margin of safety and risk permanent impairment of capital.
While prices have come down, long-term compounders still appear somewhat expensive. We are putting money to work opportunistically but in a measured manner. We have reduced our cash position this year from around 17% at the beginning of the year to just under 12% on June 30.
Despite the market selloff during the first half of the year, we are excited about the opportunities the recent volatility is providing us. As always, we continue to diligently seek attractively priced companies that are in sound financial condition, led by strong management teams, and operating in growing industries, while remaining mindful of our long-term focus on limiting the permanent impairment of capital.
Respectfully,
Steve Scruggs, Portfolio Manager
Footnotes
| [1] References to individual securities or sectors is not intended as a recommendation to purchase or sell such securities or invest in such sectors. [2] Reflects top five contributors and top five detractors to the Fund’s performance based on contribution-to-return on a gross basis. This is not a recommendation for a specific security and these securities may not be in the Fund at the time you receive this commentary. The information provided does not reflect all positions purchased, sold or recommended by the Fund during the quarter. It should not be assumed that recommendations made in the future will be profitable or will equal the performance of the securities listed. For a full list of holdings, please view the holdings report at the end of this commentary. The portfolio holdings as of the most recent quarter-end may also be obtained at www.fpa.com . [3] Source: Servisfirst Bancshares Q1 2022 results, https://www.servisfirstbancshares.com/news - events/press releases/detail/185/servisfirst - bancshares - inc - announces - results - for - first [4] Source: Press release, Feb 14, 2022, https://www.globenewswire.com/en/news - release/2022/02/24/2391259/0/en/South - Jersey - Industries - Inc - Enters - into - Agreement - to - be - Acquired - by - the - Infrastructure - Investments - Fund.html [5] Source: American Equity Investment Life Holding Company Q1 2022 results, https://americanequity.gcs - web.com/news releases/news - release - details/american - equity - reports - solid - results - line - expectations [6] Source: CSG Systems Q1 2022 results, https://ir.csgi.com/investors/press - releases/press - release - details/2022/CSG - Systems International - Reports - First - Quarter - 2022 - Results/default.aspx [7] Source: RLI 2021 annual report: https://www.rlicorp.com/sites/default/files/pdf/2021%20RLI_Annual_Report.pdf [8] MasTec 2021 annual report: https://investors.mastec.com/static - files/fbd5f009 - f3fb - 4759 - 838e - bc68f739351c [9] PVH 2021 annual report: https://pvh.gcs - web.com/static - files/cec07be7 - f102 - 4cbd - 926f - 2e1520efc94e |
Editor's Note: The summary bullets for this article were chosen by Seeking Alpha editors.
For further details see:
FPA Queens Road Small Cap Value Fund Second Quarter 2022 Commentary