NAPRF - FPA Source Capital Inc. Second Quarter 2022 Commentary
- First Pacific Advisors (FPA) is a Los Angeles-based institutional money management firm practicing a disciplined approach to value investing, prudently seeking superior long-term returns while maintaining a focus on capital preservation.
- Source Capital Inc.’s (“Source” or “Fund”) net asset value (NAV) decreased 8.03% in 2022’s second quarter.
- Market declines can be psychologically difficult, but are to be expected, and can be used to allocate capital towards re-priced and newly attractive opportunities.
- We are predisposed to lean into price weaknessby adding to what we believe are quality businesses.
- A decline in pricecan afford us the opportunity to buyas much as an increase can offer the chance to sell.
Dear Shareholders:
Overview
Source Capital Inc.’s (“Source” or “Fund”) net asset value ((NAV)) decreased 8.03% in 2022’s second quarter and decreased 8.61% for the trailing twelve months, favorable when compared its two relevant benchmarks.
Exhibit A: Performance Versus Indices 1
| Q2 2022 |
| Trailing 12-month |
| Source Capital ((NAV)) |
| -8.03% |
| -8.61% |
| 60% MSCI ACWI NR USD/ 40% Bloomberg US Agg |
| -11.36% |
| -13.43% |
| 60% S&P 500 / 40% Bloomberg US Agg |
| -11.63% |
| -10.24% |
Exhibit B: Portfolio Exposure 2
| Q2 2022 |
| Equity |
| Common Stocks* |
| 46.4% |
| Common Stocks –SPACs |
| 8.2% |
| Total Equity |
| 54.8% |
| Credit |
| Public |
| 23.7% |
| Private (Invested assets only) |
| 18.5% |
| Total Credit |
| 42.2% |
| Other |
| 0.2% |
| Cash |
| 3.0% |
| Total |
| 100% |
| 1Source: FPA, Bloomberg. As of June 30, 2022. 2For more information related to the Fund’s distribution rate, please see the press release dated May 9, 2022 https://fpa.com/docs/default - source/funds/source - capital/literature/source - capital - pr - may - 2022 - final.pdf?sfvrsn=c4d909d_2 . Dividends and other distributions are not guaranteed. 3For more information related to the Fund’s share repurchase program, please see the press release dated January 4, 2022 ( https://fpa.com/docs/default - source/fpa - news - documents/2022 - 01 - 04_source - capital - jan - 2022 - final.pdf?sfvrsn=4a01909d_6 ) . 4Source: FPA. The averages are calculated using daily discount rates. Past performance is no guarantee, nor is it indicative, of future results. |
The MSCI ACWI declined more than 20% from peak to trough during the first half of 2022. The decline in global equity indexes was broad-based, leaving little unscathed, with energy as one of the few exceptions, as rising interest rates, high inflation, fears of a weakening economy, and greater caution around funding risky, money-losing companies. Market declines can be psychologically difficult, but are to be expected, and can be used to allocate capital towards re-priced and newly attractive opportunities. We are predisposed to lean into price weakness by adding to what we believe are quality businesses at increasingly attractive prices, acquiring debt at equity-like returns, building positions in long-admired franchises, and occasionally seeking out opportunities in distressed and deeply out-of-favor situations.
Portfolio Discussion
Equity
The top contributors to and detractors from the Fund’s trailing twelve-month returns are listed below.
Exhibit C: Trailing Twelve Month Contributors and Detractors as of June 30, 2022 3
| Contributors |
| Perf. Cont. |
| Avg. % of Port. |
| Detractors |
| Perf. Cont. |
| Avg. % of Port. |
| Glencore ( GLCNF ) |
| 0.71% |
| 1.9% |
| Comcast ( CMCSA ) |
| -1.07% |
| 3.1% |
| American International Group ( AIG ) |
| 0.46% |
| 2.6% |
| -0.83% |
| 1.5% |
| Aon ( AON ) |
| 0.41% |
| 2.0% |
| Citigroup ( C ) |
| -0.81% |
| 2.1% |
| Broadcom ( AVGO ) |
| 0.37% |
| 2.5% |
| Meta Platforms ( META ) |
| -0.81% |
| 1.2% |
| FirstEnergy ( FE ) |
| 0.14% |
| 1.0% |
| Holcim ( HCMLF ) |
| -0.79% |
| 2.6% |
| 2.08% |
| 10.0% |
| -4.31% |
| 10.4% |
In the last twelve months, Source’s top five performers contributed 2.08% to its return, while its bottom five detracted 4.31%. We believe that some of these ups and downs might prove ephemeral, but we’ll address where our thesis is being validated or where it might be broken.
Glencore is one of the largest globally diversified commodity businesses operating both industrial and marketing businesses. Importantly, we believe Glencore operates in a genuinely shareholder-oriented manner. Source purchased Glencore off-and-on from 2018 through 2020 at what we believe is a single digit multiple of normal earnings power. The opportunity presented itself when investors were less willing to own commodity sensitive businesses due to a period of low inflation and general disregard for valuation. Net of distributions of above average cyclical profits likely to be earned in 2022, we believe the company still trades at an attractive valuation relative to its long-term earnings power, justifying its continued presence in the Fund.
Our investment thesis on the names that have detracted from performance have not materially changed but highlight the following.
Prosus ’ stock price has declined along with the values of their investment portfolio. Our thesis has somewhat improved as management recently announced a share repurchase program that will be funded, in part, by periodic and partial sales of its Tencent holding. Given that its stock price trades at a greater than 35% discount to its estimated net asset value ( NAV ), share repurchases should be accretive. The Company’s stock price has appreciated 26% since the announcement. 4
Comcast , along with our investment in Charter ( CHTR ), the Fund’s investment in the US cable industry, is an example of us leaning into fear. These investments have underperformed in the last year but still trade above the Fund’s cost basis. The industry has been plagued by fears of video cord cutting, and competition from 5G and Fiber to the Home. This allowed us to buy and to continue to hold both Comcast and Charter Communications. These businesses trade at what we believe are reasonable valuations and we think should have attractive growth in free cash flow over the next decade. We expect that they will allocate that free cash flow in the best interest of shareholders, given that they are controlled by owner-operators.
We added five new equity positions to the Fund and exited one in the quarter. One of the new equity positions the Fund has taken on includes CarMax ( KMX ).
CarMax has three operating segments: used retail, used wholesale, and used auto lending. The general market decline and recession concerns have caused its stock price to decline by almost half since it peaked in Q4 2021. CarMax is the largest US company in the used car retail space. We think CarMax has the opportunity to gain share in the market due to its strong wholesale business, historically good returns on capital, and an excellent management team that invests for the future and allocates capital with an owner-oriented mindset. [3] Recessionary concerns are valid as their lending business, in particular, will likely be hurt. We would not be surprised to see its stock price decline as a result and would consider the opportunity to increase the Fund’s stake at that time.
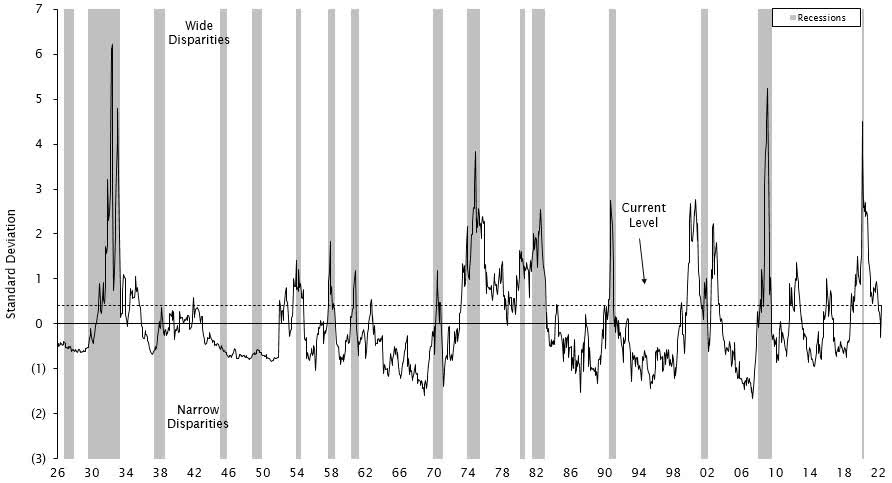
In equities, more traditional value stocks are no longer as inexpensive, unlike March 2020 when value spreads (the cheapest 20% of the market versus the market average) got to 2008 levels of cheapness. We have therefore spent more time considering (and adding to) faster growing, better quality businesses, many of which are both less expensive than the market today and where they have historically been valued, as supported in the following Exhibits D and E.
Exhibit D: Valuation Spreads – The Cheapest Quintile Compared to the Market Average (1926 – June 30, 2022) [4]
Exhibit E: The Big Growers – Relative Price to Sales Ratio [5]
We will remain flexible, and seek to take advantage of opportunities that present a margin of safety, whether they are perceived as “value” or “growth.” [6]
Relatively speaking, international markets continue to trade at lower valuations than that of the US, as shown in Exhibit F below. That explains, in part, the Fund’s increase in international exposure from 23.9% to 37.4% of the Fund’s net equities over the last four years. We continue to find attractive opportunities outside of the US.
Exhibit F: Twelve-Month Forward Price to Earnings Ratio Discount MSCI AC World Index ex-US vs S&P 500 Index [7]
Traditional
Credit (investments rated BBB or lower) has become cheaper, but we would not say it is generally attractive. The following chart shows the history of the BB component of the high yield, index excluding energy. We often look at this measure of the market for a more consistent view of history, less burdened by changes in composition of the index over time.
Exhibit G: Bloomberg US High-Yield BB excluding Energy [8]
It is tempting to look at charts like these, marvel at how much yields and spreads have increased recently and proclaim “the market is cheap”! Yes, the market is cheaper compared to a 2.7% yield which is where the above index traded in September 2021. But is the market cheap or attractively priced on an absolute basis? We do not think so and the reason is that not all markets are created equal. The high yield bond universe that exists today is the rotten fruit of seeds planted in the past couple of years when easy monetary policy created an environment where investors clamored for return. As a consequence of those times, today’s high yield bond universe is marked by higher leverage, thinner tranches and weaker protections for investors. Nevertheless, we never stop looking because, as described earlier, we sometimes find select opportunities that are attractive.
Private Credit
The Fund’s private credit holdings continue to ramp. The Fund’s exposure (committed + invested capital) increased to 28.1% at quarter end vs. 24.7% at the end of 2021 and 11.7% at the end of 2020. We are currently underwriting potential private credit investment opportunities to an expected rate of return of approximately 9% to 11%. [9]
Convertible Bonds
Exposure to high-yield bonds has been low due to historically low yields and spreads to Treasuries. Since Q4, the high-yield bond index has declined 10% as both Treasury yields have increased, and credit spreads have widened. We have begun to see some compelling risk-adjusted opportunities in convertible bonds specifically for the first time since 2000. Many stocks have seen a tremendous decline in price, particularly those companies that are still in their earlier stages with business models that have yet to be optimized. Some of these companies had raised money to fund their growth via convertible bonds initially with yields of 1% and lower. With the conversion price now well out of the money due the decline in their stock prices, the bonds have traded down and now offer what we believe are attractive yields to intermediate term maturities that leave some optionality should these businesses succeed. If this is the case, we would expect the market to reward them with a higher stock price that should translate to a higher bond price; and an outside chance that the convertible feature pays off prior to maturity. The average yield-to-maturity of these bonds is currently 12.8%, 440 basis points better than the 8.4% yield currently offered in the high-yield market. 12 The allocation to these bonds is small for now, but we are hopeful a combination of a further increase in interest rates and continued stock market volatility may allow us to increase the allocation to this space.
Corporate and Other Matters
Distribution and Yield
On May 9, 2022, the Fund’s Board approved maintaining the Fund’s regular monthly distribution at the current rate of 18.5 cents per share through August 2022. 13 This equates to an annualized 5.95% unlevered distribution rate based on the Fund’s closing market price on June 30, 2022.
Share Buyback
Source’s average discount to NAV rose during the 2 nd quarter of 2022 to 7.79% vs. 6.36% in the 1 st quarter. The Fund repurchased 29,433 shares during the 2 nd quarter, representing 0.352% of the outstanding shares, at an average price of $37.96 per share and at an average discount to NAV of 8.80%. 14
Discount to NAV
The Fund’s discount to NAV closed at 7.09% on June 30, 2022, up from 5.13% at the end of the 1 st quarter of 2022. The average discount to NAV for the trailing twelve months was 6.57%. 15
Closing
We are living through what is not our first volatile period. While we cannot tame volatility, we have learned to make friends with it. A decline in price can afford us the opportunity to buy as much as an increase can offer the chance to sell. We believe our hyper focus on price and business quality should allow us to successfully navigate this current turbulent moment in time.
Respectfully submitted,
Source Capital Portfolio Management Team
Footnotes
3 Reflects the top five contributors and detractors to the Fund’s performance based on contribution to return for the trailing twelve months (“TTM”). Contribution is presented gross of investment management fees, transactions costs, and Fund operating expenses, which if included, would reduce the returns presented. The information provided does not reflect all positions purchased, sold or recommended by FPA during the quarter. A copy of the methodology used and a list of every holding’s contribution to the overall Fund’s performance during the TTM is available by contacting FPA Client Service at crm@fpa.com . It should not be assumed that recommendations made in the future will be profitable or will equal the performance of the securities listed.
4 Source: Prosus announcement, June 27, 2022. Appreciation is in Euros, the local currency as of July 21, 2022. https://www.prosus.com/news/the - group - announces - the - beginning - of - an - open - ended - share - repurchase - programme - of - prosus - and naspers - shares/
5 Source: FPA, recent Company filings, Automotive News. As of June 30, 2022.
6 Source: Empirical Research Analysis, National Bureau of Economic Research. As of June 30, 2022. Cheapest quintile refers to the most undervalued 20% of stocks in an analysis of large-capitalization US stocks. Standard Deviation is a measure of dispersion of a data set from its mean. Prior to 1952, the spread is measured using the price-to-book data of the largest 1,500 stocks. Current Level refers to the valuation spread as of June 30, 2022 which is 0.4 standard deviations above the mean.
7 Source: Empirical Research Partners (“ERP”) Analysis, National Bureau of Economic Research, as of June 5, 2022. Equally-weighted data. ERP categorized a group of 75 US large-capitalization stocks that they have faster and stronger growth credentials than the rest of the US large-cap universe as ‘Big Growers’. The analysis covers the period January 1960 through June 5, 2022.
8 Margin of Safety - Buying with a “margin of safety” is when a security is purchased at a discount to the portfolio manager’s estimate of its intrinsic value. Buying a security with a margin of safety is designed to protect against permanent capital loss in the case of an unexpected event or analytical mistake. A purchase made with a margin of safety does not guarantee the security will not decline in price.
9 As of June 30, 2022. Source: Factset, MSCI, Standard & Poor's, J.P. Morgan Asset Management Guide to the Markets. Forward Price to Earnings is a version of the ratio of price-to-earnings (P/E) that uses forecasted earnings for the P/E calculation. Past results are no guarantee, nor are they indicative, of future results.
10 Source: Bloomberg. As of 6/30/2022. YTW is Yield-to-Worst. Spread reflects the quoted spread of a bond that is relative to the security off which it is priced, typically an on the-run treasury.
11 There can be no guarantee that current or future investments will achieve the expected rate of return used in evaluating such private credit investments.
12 Source: FPA, Bloomberg. As of June 30, 2022.
13 For more information related to the Fund’s distribution rate, please see the press release dated May 9, 2022 https://fpa.com/docs/default-source/funds/source-capital/literature/source-capital-pr-may-2022-final.pdf?sfvrsn=c4d909d_2. Dividends and other distributions are not guaranteed.
14 For more information related to the Fund’s share repurchase program, please see the press release dated January 4, 2022 (https://fpa.com/docs/default-source/fpa-news-documents/2022-01-04_source-capital-jan-2022-final.pdf?sfvrsn=4a01909d_6 ). 15 Source: FPA. The averages are calculated using daily discount rates.
Editor's Note: The summary bullets for this article were chosen by Seeking Alpha editors.
For further details see:
FPA Source Capital Inc. Second Quarter 2022 Commentary