PFF - FPE: High Yield ETF With Bond Performance And Stock Risks
2023-04-06 17:22:27 ET
Summary
- First Trust Preferred Securities and Income ETF is an actively managed fund of preferred stocks.
- It is massively overweight in financials and has a large exposure to banks.
- Both the FPE ETF share price and distributions have shrunk significantly since 2013.
- Bonus: a solution to get high yields without decay.
This article series aims at evaluating ETFs (exchange-traded funds) regarding the past performance of their strategies and quality of their current portfolios. As holdings and their weights change over time, updated reviews are posted when necessary.
Strategy and portfolio
First Trust Preferred Securities and Income ETF ( FPE ) is a high yield fund paying monthly distributions. It has 293 holdings, a 12-month distribution rate of 5.51%, and a total expense ratio of 0.85%. It was launched on 2/11/2013 with the objective “ to seek total return and to provide current income. ” It is an actively managed fund, which offers a lot of flexibility to managers. On the downside, the strategy is a black box and it is impossible to duplicate or back-test it.
The fund invests in preferred stocks, which are hybrid securities behaving partly like stocks and partly like bonds. In fact, preferred stocks are much closer to convertible bonds than to common stocks. Many income-seeking investors like preferreds for their high yields.
As described in the prospectus by First Trust , the fund uses
three significant areas of analysis: credit fundamentals; relative value; and technical aspects of the securities, which may include, but are not limited to, interest rate sensitivity, call features, covenants, maturities, trading volumes, liquidity and pricing inefficiencies.
U.S. companies represent 54.3% of asset value. For clarity, the next chart plots the weights of the fund’s top countries without the U.S.
Country allocation without the U.S. (chart: author; data: First Trust)
About 70% of asset value is in the financial sector. The next chart plots the top 10 industries, with an aggregate weight of 93%. Banks come first with 38.5%, followed by insurance (20.5%). Other industries are below 10%.
Industry breakdown (chart: author; data: First Trust)
Several securities issued by the same company may be included in the portfolio and counted as distinct holdings. To assess company exposure, I have calculated and listed the weights of the top 10 issuers in the next table. They represent 28% of asset value and the top name is at about 4%. Therefore, risks related to individual companies are moderate. However, keep in mind that exposure to the banking industry is massive.
| Name |
| Ticker |
| weight |
| BARCLAYS PLC |
| 4.05% |
| Enbridge Inc. |
| 3.65% |
| Wells Fargo & Company |
| 3.42% |
| Bank of America Corporation |
| 2.88% |
| Energy Transfer LP |
| 2.70% |
| LLOYDS BANKING GROUP PLC |
| 2.62% |
| AERCAP HOLDINGS |
| 2.59% |
| Brookfield (and subsidiaries) |
| 2.20% |
| CITIGROUP INC |
| 2.07% |
| LAND O'LAKES INC |
| 1.85% |
Competitors
The table below lists 16 ETFs invested exclusively or mostly in preferred stocks, ranked by decreasing market capitalization. I tried to make this list as exhaustive as possible. If you know one or several ones I missed, feel free to write a comment below.
| Ticker |
| Name |
| Market Cap. |
| Inception |
| iShares Preferred and Income Securities ETF |
| 12,428,768,000.00 $ |
| 03/26/2007 |
| Invesco Preferred Portfolio ETF |
| 4,489,254,000.00 $ |
| 01/31/2008 |
| Global X U.S. Preferred ETF |
| 2,153,780,000.00 $ |
| 09/11/2017 |
| Invesco Variable Rate Preferred ETF |
| 1,569,625,000.00 $ |
| 05/01/2014 |
| Invesco Financial Preferred ETF |
| 1,050,192,000.00 $ |
| 12/01/2006 |
| VanEck Preferred Securities ex Financials ETF |
| 973,440,000.00 $ |
| 07/16/2012 |
| SPDR Wells Fargo Preferred Stock ETF |
| 956,059,000.00 $ |
| 09/16/2009 |
| Virtus InfraCap U.S. Preferred Stock ETF |
| 493,120,572.00 $ |
| 05/15/2018 |
| Principal Spectrum Preferred Securities Active ETF |
| 425,216,083.00 $ |
| 07/10/2017 |
| Global X Variable Rate Preferred ETF |
| 258,503,400.00 $ |
| 06/24/2020 |
| AAM Low Duration Preferred and Income Securities ETF |
| 196,499,250.00 $ |
| 11/27/2019 |
| Global X SuperIncome Preferred ETF |
| 188,500,800.00 $ |
| 07/16/2012 |
| Innovator S&P Investment Grade Preferred ETF |
| 110,054,250.00 $ |
| 05/23/2016 |
| InfraCap REIT Preferred ETF |
| 59,531,565.00 $ |
| 02/07/2017 |
| American Century Quality Preferred ETF |
| 24,728,616.00 $ |
| 02/18/2021 |
| John Hancock Preferred Income ETF |
| 20,268,105.00 $ |
| 12/15/2021 |
Performance
The next table compares FPE performance since March 2013 with its two largest competitors: iShares Preferred and Income Securities ETF ( PFF ) and Invesco Preferred ETF ( PGX ). It also includes a diversified corporate bond benchmark: the iShares iBoxx $ Investment Grade Corporate Bond ETF ( LQD ) and the equity benchmark S&P 500 ( SPY ).
| since 3/1/2013 |
| Total Return |
| Annual.Return |
| Max.Drawdown |
| Sharpe ratio |
| FPE |
| 36.88% |
| 3.16% |
| -33.35% |
| 0.27 |
| PFF |
| 36.20% |
| 3.11% |
| -34.10% |
| 0.28 |
| PGX |
| 35.36% |
| 3.04% |
| -34.10% |
| 0.26 |
| SPY |
| 223.87% |
| 12.34% |
| -33.72% |
| 0.79 |
| LQD |
| 27.13% |
| 2.41% |
| -24.95% |
| 0.22 |
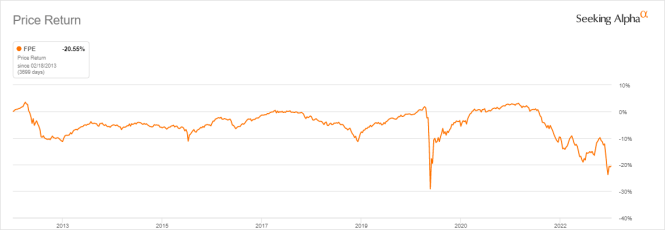
Based on these numbers, FPE and its peers have bond-like performance (measured in total return or Sharpe ratio) with stock-like risks (measured in maximum drawdown). This table also shows a concerning fact: the annualized return with distributions is inferior to the distribution rate, which points to capital decay. This is confirmed by share price history (next chart): it has lost about 20% since inception. To make it more painful, cumulative inflation in the same time has been 29% (based on CPI).
Return without dividends ( Seeking Alpha)
Moreover, the annual sum of distributions went down from $1.13 in 2014 to $0.95 in 2022. The loss in income stream is 16% in 8 years.
Distribution history (Seeking Alpha)
These numbers are not as bad as for SPFF ( review here ), but they are not attractive.
A solution to get high yields without decay
Most funds with a yield above 6% suffer from capital and distribution decay, not only hybrid asset ETFs. It is also an issue in many closed-end funds, or CEFs. However, capital decay can be avoided or mitigated by rotational strategies, instead of using funds as buy-and-hold instruments.
I designed a 5-factor ranking system in 2016, and monitored its performance during several years. I started publishing the eight best ranked CEFs in Quantitative Risk & Value (QRV) after the March 2020 meltdown. The list is updated every week. Its average dividend yield varies around 7%. It's not a model portfolio: trading the list every week is too costly in spreads and slippage. Its purpose is helping investors find funds with a good entry point. In the table and chart below, I give the hypothetical example of starting a portfolio on 3/25/2020 with my initial “Best 8 Ranked CEFs” list and updating it every 3 months since then, ignoring intermediate updates. Return is calculated using closing prices, with holdings in equal weights and reinvesting dividends at the beginning of every 3-month period.
| since 3/25/2020 |
| Total Return |
| Annual.Return |
| Drawdown |
| Sharpe ratio |
| Volatility |
| Best 8 CEFs quarterly |
| 121.20% |
| 30.04% |
| -20.60% |
| 1.27 |
| 20.42% |
| SPY |
| 73.66% |
| 20.03% |
| -24.50% |
| 0.92 |
| 19.22% |
This simulation is not a real portfolio and not a guarantee of future return
This strategy is unlikely to perform as well in the near future as since March 2020. The 2020 meltdown resulted in price dislocations and exceptional opportunities in the CEF universe. However, I think a time-tested rotational strategy in CEFs has a much better chance to protect both capital and income stream against erosion and inflation than a high-yield passive investment.
For further details see:
FPE: High Yield ETF With Bond Performance And Stock Risks