SAND - Franco-Nevada Corporation: A Weak Production Quarter
2023-05-03 15:46:37 ET
Summary
- Franco-Nevada Corporation generated $276.3 million in the first quarter, down 18.4% from last year's quarter.
- Metals production in GEOs was lower than a year ago, with 111,238 GEOs sold compared with 128,627 GEOs last year.
- This quarter's energy revenues were down significantly, reaching only $49.0 million compared to $82.7 million in the preceding quarter.
- I recommend buying Franco-Nevada Corporation between $153 and $150, with potential lower support at $144.15.
Introduction
The Toronto-based Franco-Nevada Corporation (FNV) released its first-quarter 2023 results on May 2, 2023.
Note: I have been covering FNV quarterly on Seeking Alpha since March 2017. This article is an update of my preceding article, published on March 20, 2023.
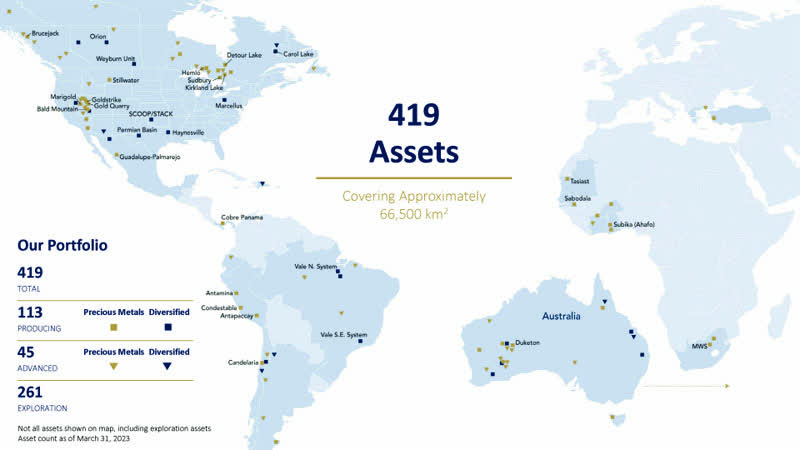
Franco-Nevada owns 419 assets worldwide, unchanged sequentially:
FNV Assets Map (FNV Presentation)
1 - 1Q23 Quick Snapshot
Franco-Nevada came out with adjusted quarterly earnings of $0.79 per share, or $152.2 million. The company generated $276.3 million in the first quarter, down 18.4% from last year's quarter.
The decline was due to decreased GEOs earned from our Precious Metal assets and lower realized oil, gas, and iron ore prices. Deliveries from the Precious Metal assets in Q1 2023 were affected by curtailed operations at Cobre Panama and Antapaccay.
Metals production in GEOs was lower than a year ago, with 111,238 GEOs sold compared with 128,627 GEOs last year.
This quarter's energy revenues were down significantly, reaching only $49.0 million compared to $82.7 million in the preceding quarter.
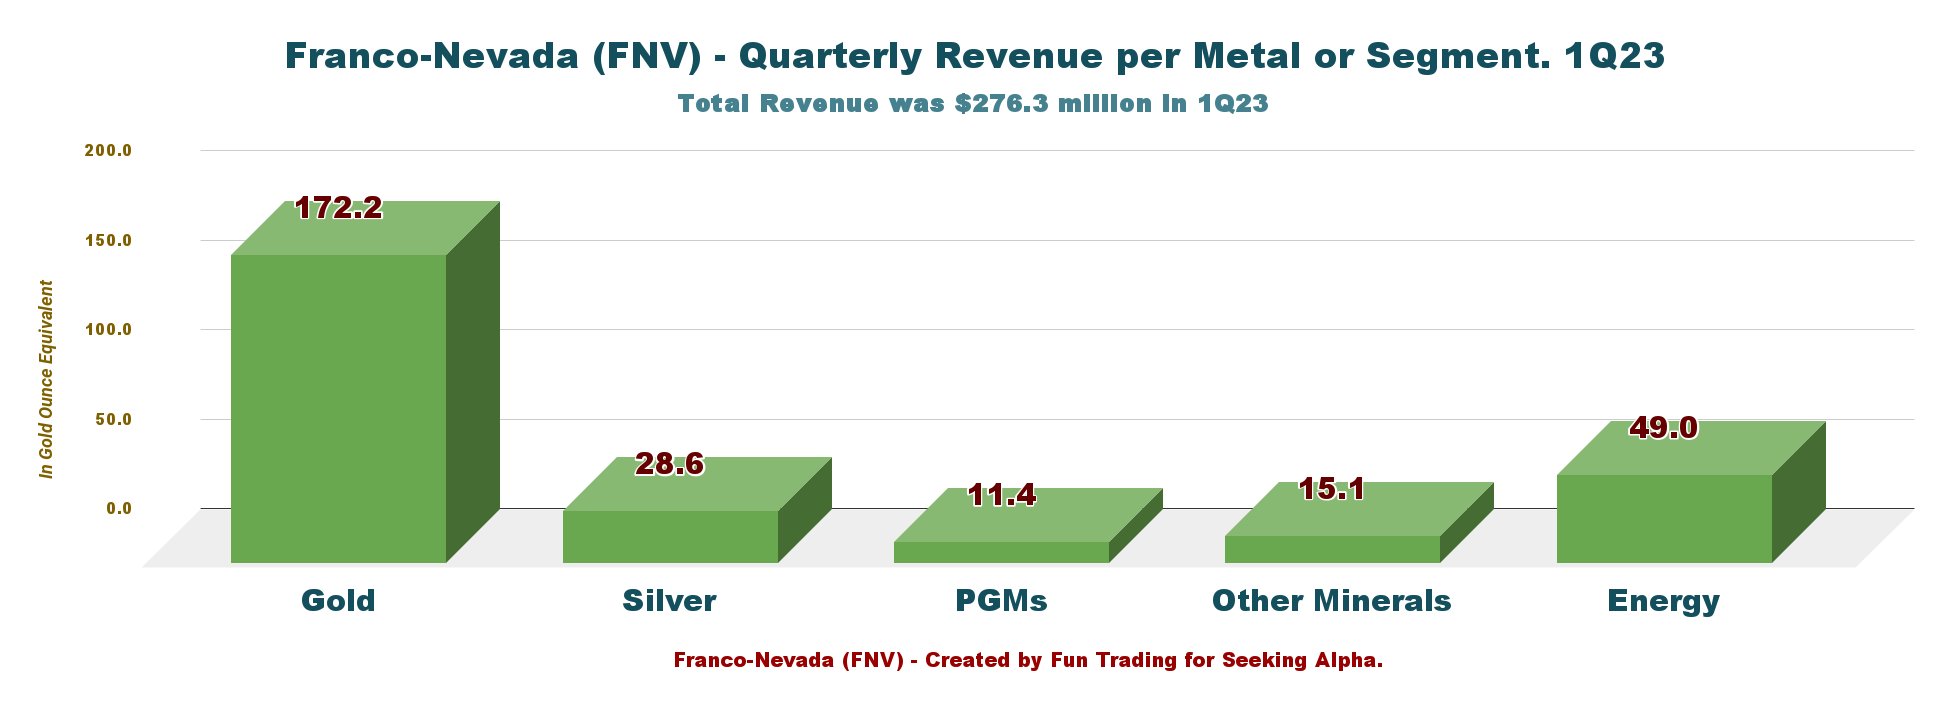
Below are the revenues per segment in the first quarter of 2023:
FNV 1Q23 revenue per metal (Fun Trading)
The company is highly dependent on the gold price, representing 62.3% of the total revenues in 1Q23. The energy sector dropped significantly this quarter and now represents 17.7%.
2 - Stock Performance
As I have indicated for years, Franco-Nevada is one of my most significant long-term investments in the streaming sector, followed closely by Wheaton Precious Metals ( WPM ). I also own a smaller long-term position in Sandstorm Gold Ltd. ( SAND ).
Franco-Nevada Corporation's fundamentals are solid, with no debt and a cash position of $1,248.4 million, up $51.9 million quarter over quarter.
FNV is down 12% on a one-year basis, whereas WPM is up 4%. Meanwhile, Osisko Gold Royalties Ltd ( OR ) has outperformed the group and is up 42% on a one-year basis.
3 - Investment Thesis
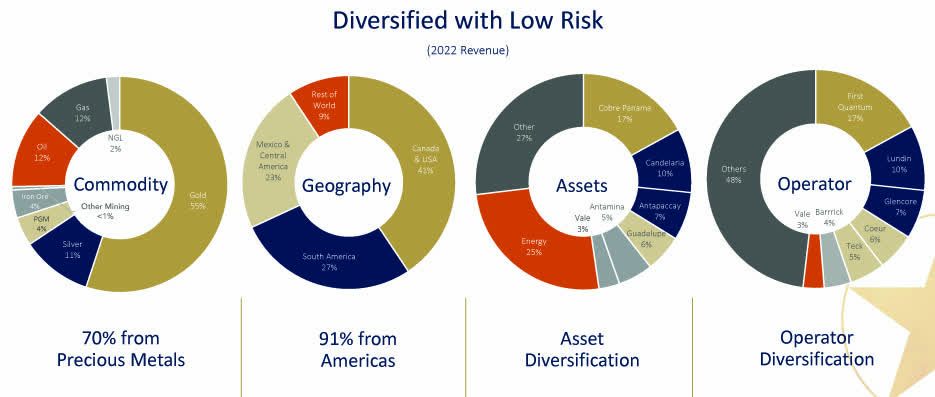
Franco-Nevada Corporation continues to present a low-risk profile, with 91% of assets located in the Americas, which is excellent support from a long-term investment perspective. Thus, it is my leading investment in the streamer group.
FNV Assets presentation (FNV Presentation)
FNV has a record total cash of $1,248.4 million as of March 31, 2023, and above all, no debt. The company is paying a quarterly dividend of $0.34 per share.
However, Franco-Nevada is highly correlated to commodity prices and fluctuates widely. Energy price has dropped significantly this quarter, and the company's revenue took a hit.
Thus, it is critical to monitor commodity prices and trade FNV accordingly. Sadly, FNV is not paying a significant dividend to consider the stock dividend-friendly.
Gold bullion trades above $2,000 per ounce today and may strengthen further depending on the FED action. It is widely expected that the FED will hike another 25 points and then pause after that, which is bullish for gold.
I recommend short-term trading LIFO 30%-40% of your position and keeping the remainder for a much higher target. This dual strategy has been my dominant strategy recommended in my marketplace, "The Gold and Oil Corner," It is the best way to maximize your gain over a long period.
Franco-Nevada - A Solid Balance Sheet and Production in 1Q23, The Raw Numbers
| Franco-Nevada |
| 1Q22 |
| 2Q22 |
| 3Q22 |
| 4Q22 |
| 1Q23 |
| Total Revenues in $ Million |
| 338.8 |
| 352.3 |
| 304.2 |
| 320.4 |
| 276.3 |
| Net income in $ Million |
| 182.0 |
| 196.5 |
| 157.1 |
| 165.0 |
| 156.5 |
| EBITDA $ Million |
| 285.3 |
| 302.8 |
| 256.8 |
| 266.1 |
| 233.1* |
| Adjusted EBITDA $ Million |
| 286.6 |
| 301.2 |
| 256.7 |
| 262.4 |
| 229.4 |
| EPS diluted in $/share |
| 0.95 |
| 1.02 |
| 0.82 |
| 0.85 |
| 0.81 |
| Operating Cash Flow in $ Million |
| 230.6 |
| 257.3 |
| 232.3 |
| 279.3 |
| 209.8 |
| CapEx in $ Million |
| 3.1 |
| 10.3 |
| 3.1 |
| 125.0 |
| 109.6 |
| Free Cash Flow in $ Million |
| 227.5 |
| 247.0 |
| 229.2 |
| 154.3 |
| 100.2 |
| Total cash $ Million |
| 722.7 |
| 910.6 |
| 1,057.4 |
| 1,196.5 |
| 1,248.4 |
| Long-term Debt in $ Million |
| 0 |
| 0 |
| 0 |
| 0 |
| 0 |
| Dividend per share in $ |
| 0.32 |
| 0.32 |
| 0.32 |
| 0.32 |
| 0.34 |
| Shares outstanding (diluted) in Million |
| 191.7 |
| 191.9 |
| 192.0 |
| 194.76 |
| 192.77 |
| GEOs |
| 1Q22 |
| 2Q22 |
| 3Q22 |
| 4Q22 |
| 1Q23 |
| Production gold equivalent K Oz Eq. |
| 128,627 |
| 131,574 |
| 128,427 |
| 129,642 |
| 111,238 |
| Production GEO, including Energy |
| 178,614 |
| 191,052 |
| 176,408 |
| 183,886 |
| 145,331 |
| Gold price |
| 1,874 |
| 1,872 |
| 1,728 |
| 1,742 |
| 1,889 |
Data Source: Company document .
* Estimated by Fun Trading.
Note: More historical data starting in 2015 are available for subscribers only.
Analysis: Revenues, Earnings Details, Free Cash Flow, Debt, And Production Details
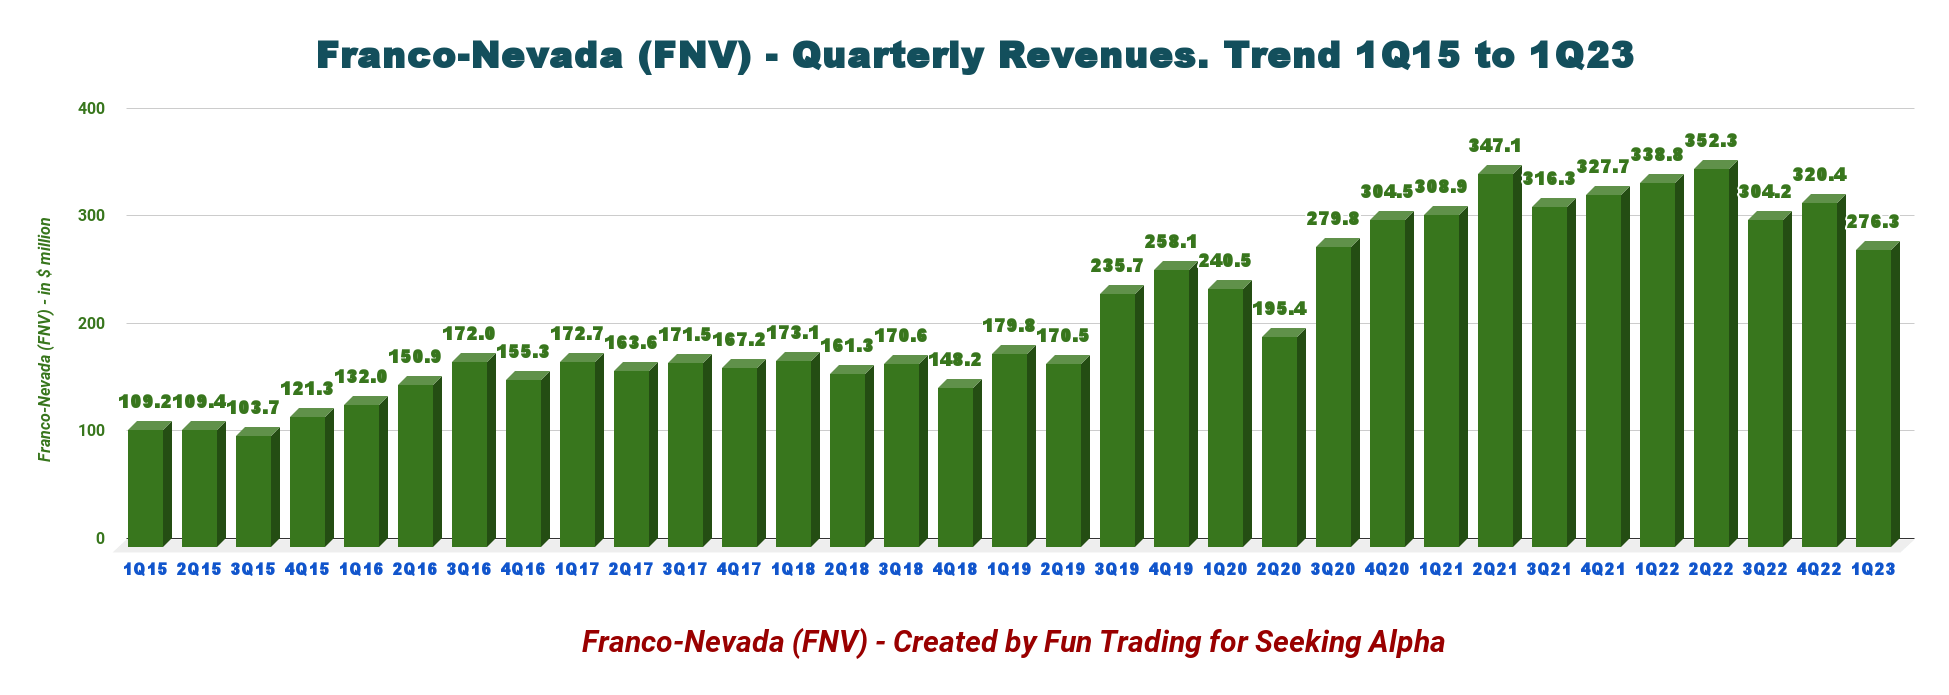
1 - Revenues were $276.3 million in 1Q23
FNV Quarterly Revenue History (Fun Trading) During the first quarter of 2023, the company generated $276.3 million, down from $338.8 million in the same quarter a year ago and down 13.8% sequentially. Net income was $156.5 million, $0.81 per diluted share, and $152.2 million adjusted net income, or $0.79 per share.
Adjusted EBITDA in 1Q23 was $229.4 million.
Oil and gas assets added $49.0 million to Franco-Nevada's overall quarter results, a significant drop from the 4Q22 or $82.7 million.
2 - Free Cash Flow was estimated at $100.2 million i n 1Q23
FNV Quarterly Free cash flow History (Fun Trading) Note: The free cash flow is cash from operating activities minus CapEx.
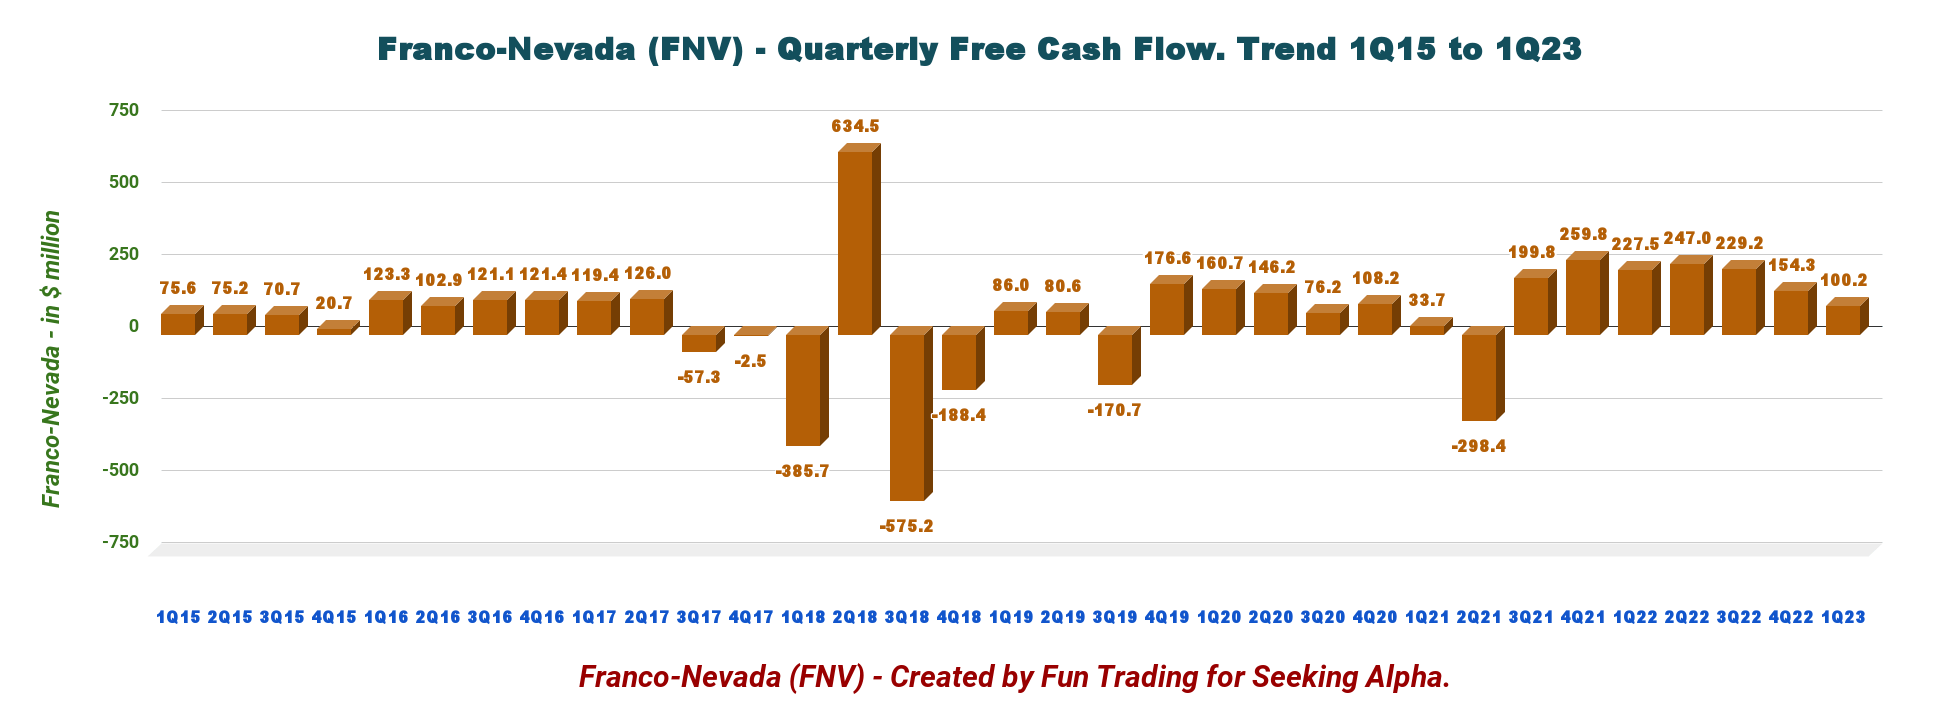
This quarter, the company earned $100.2 million in free cash flow and a trailing 12-month free cash flow of $730.7 million.
Franco-Nevada announced that its Board of Directors had declared a quarterly dividend of $0.34 per share in 1Q23.
As I said earlier, the dividend is still too low, with a yield of 1.2%. With net cash of over $1.25 billion, the company should double its dividend at the least.
3 - The Company Has No Debt And $1,248.4 million in cash as of March 31, 2023.
Franco-Nevada continues to deliver another perfect financial profile, with cash and cash on hand of $1,248.4 million in 1Q23 and no debt. The graph below shows how fast cash is increasing rapidly.
FNV Quarterly Cash versus Debt History (Fun Trading)
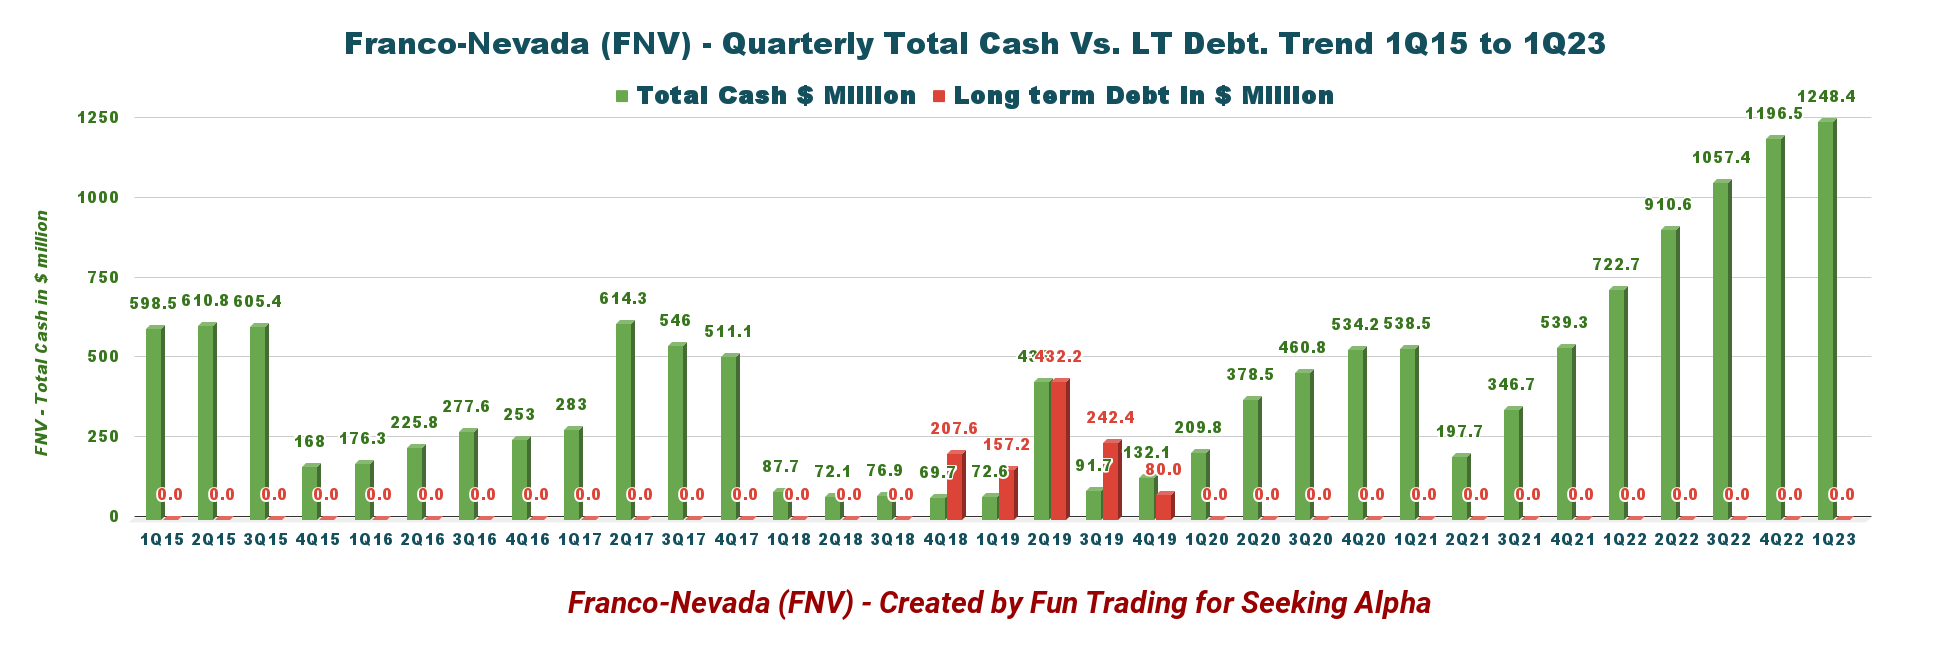
Also, Franco-Nevada has $2.25 billion in available capital as of March 31, 2023, including $1 billion in credit facility.
4 - Production in Gold Equivalent Ounces was 111,238 GEOs in 1Q23 and 145,331 GEOs, including The Energy Assets
FNV Quarterly GEO sold History not including Energy (Fun Trading)
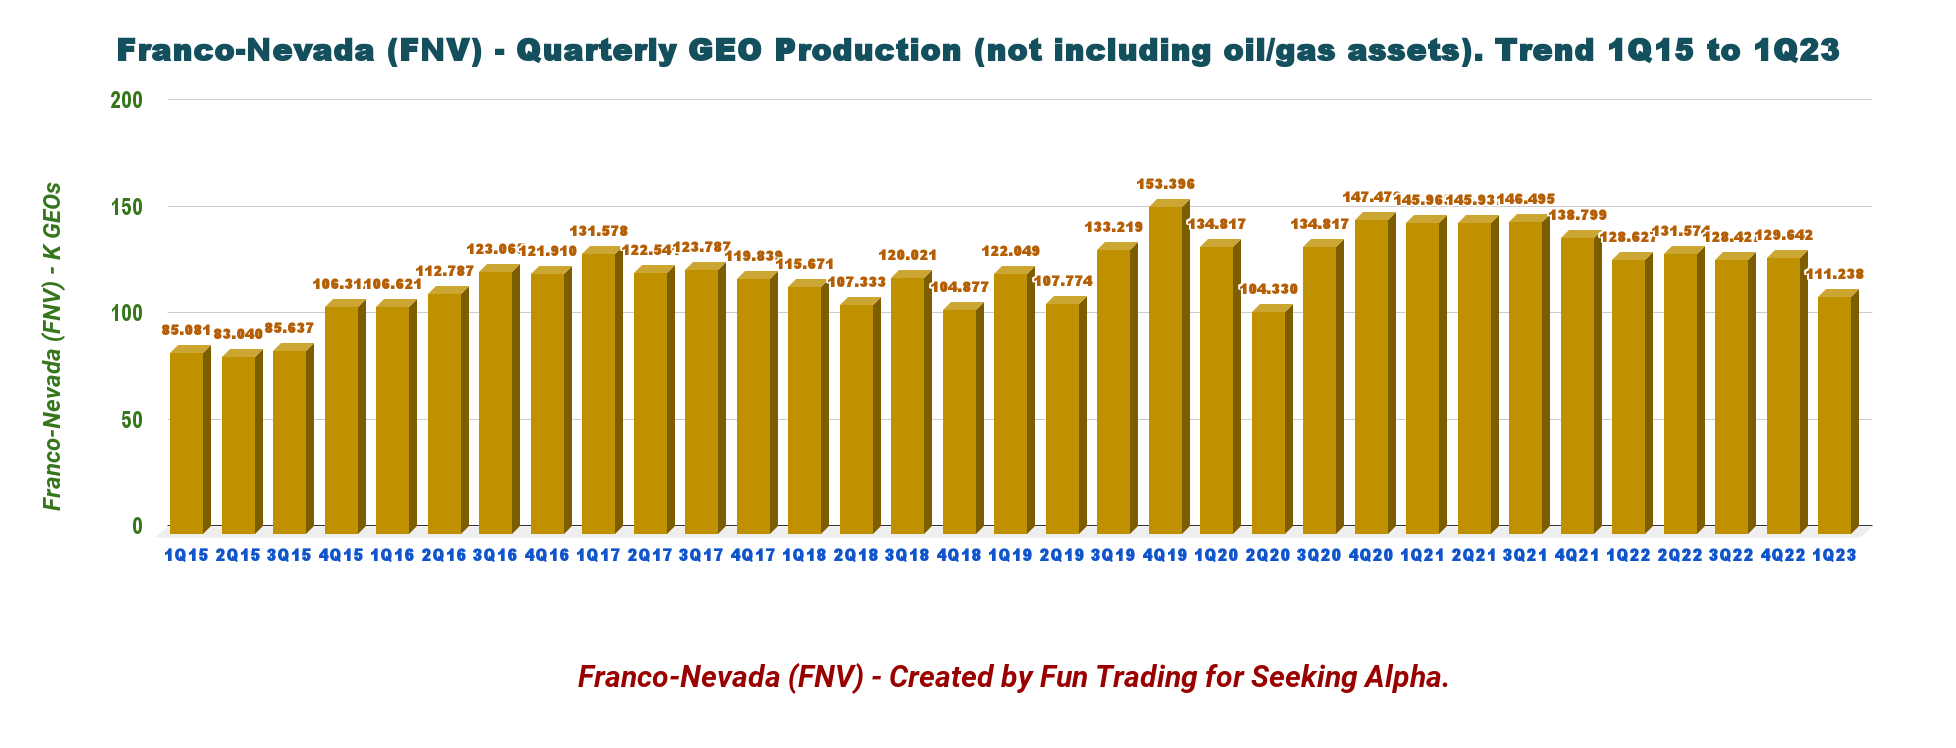
Franco-Nevada stated that it sold 111,238 gold equivalent ounces in 1Q23 (not counting the Energy segment), significantly down from 128,627 GEOs in the same quarter a year ago.
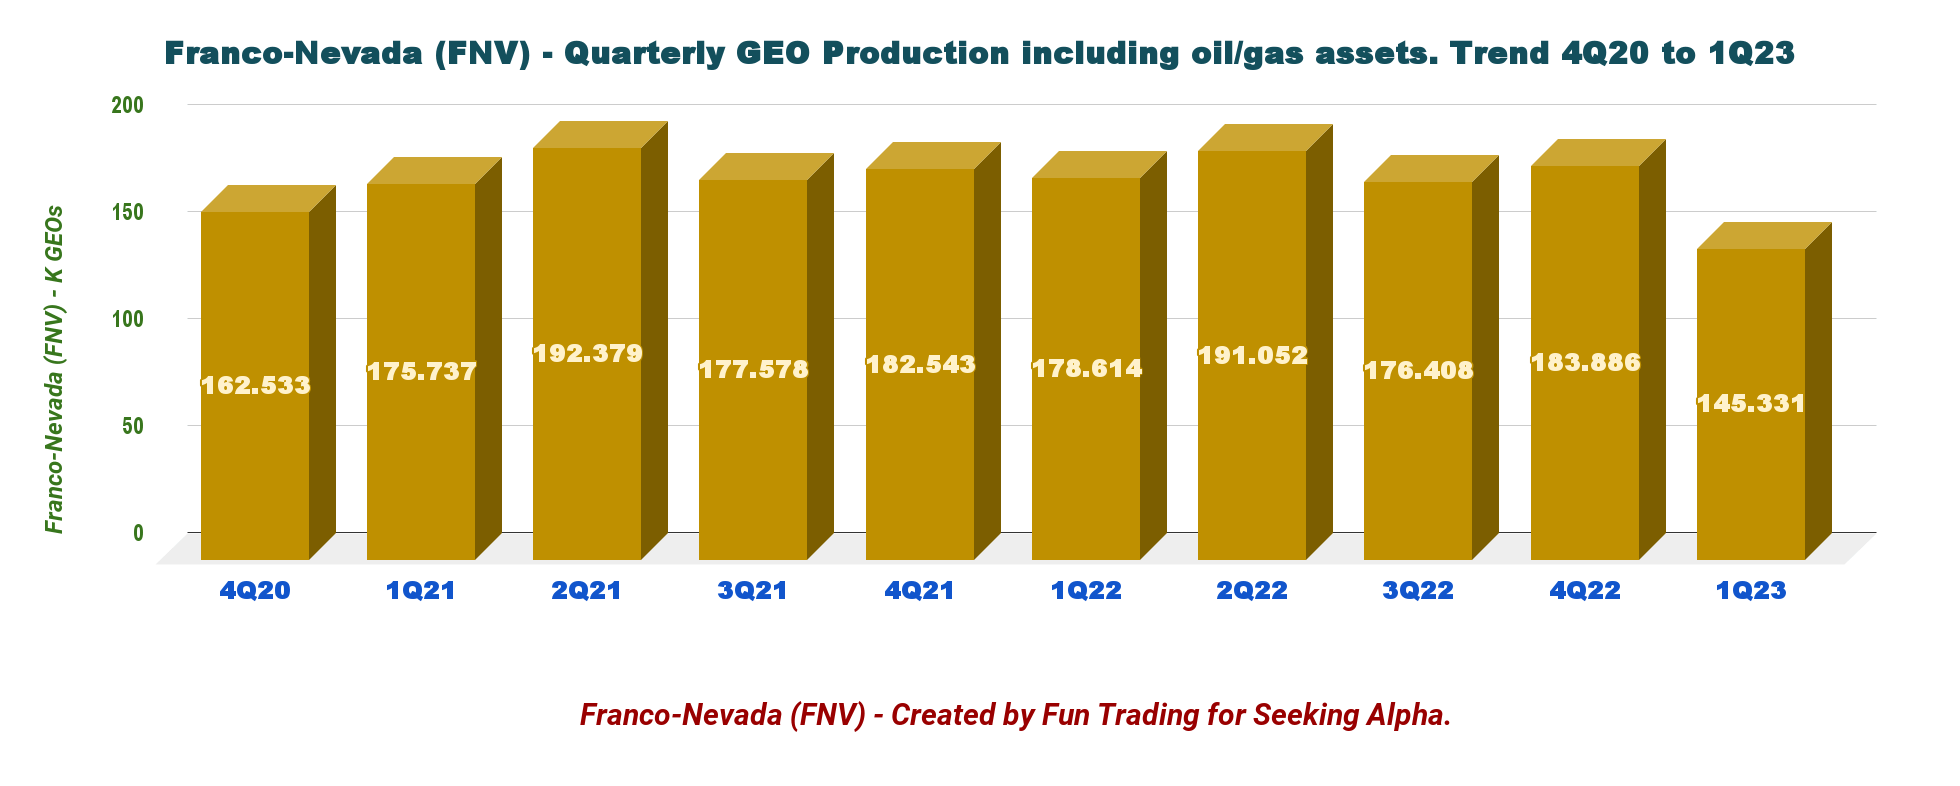
The total production, including the energy segment, was 145,331 GEOs, down significantly from 178,614 GEOs in 1Q22.
FNV Quarterly Production Including Energy History (Fun Trading)
Gold represented 62.4% of the total output in 1Q23, including energy.
Details per metals/segment are presented below:
FNV Quarterly Production per Metal History 1Q23 (Fun Trading)
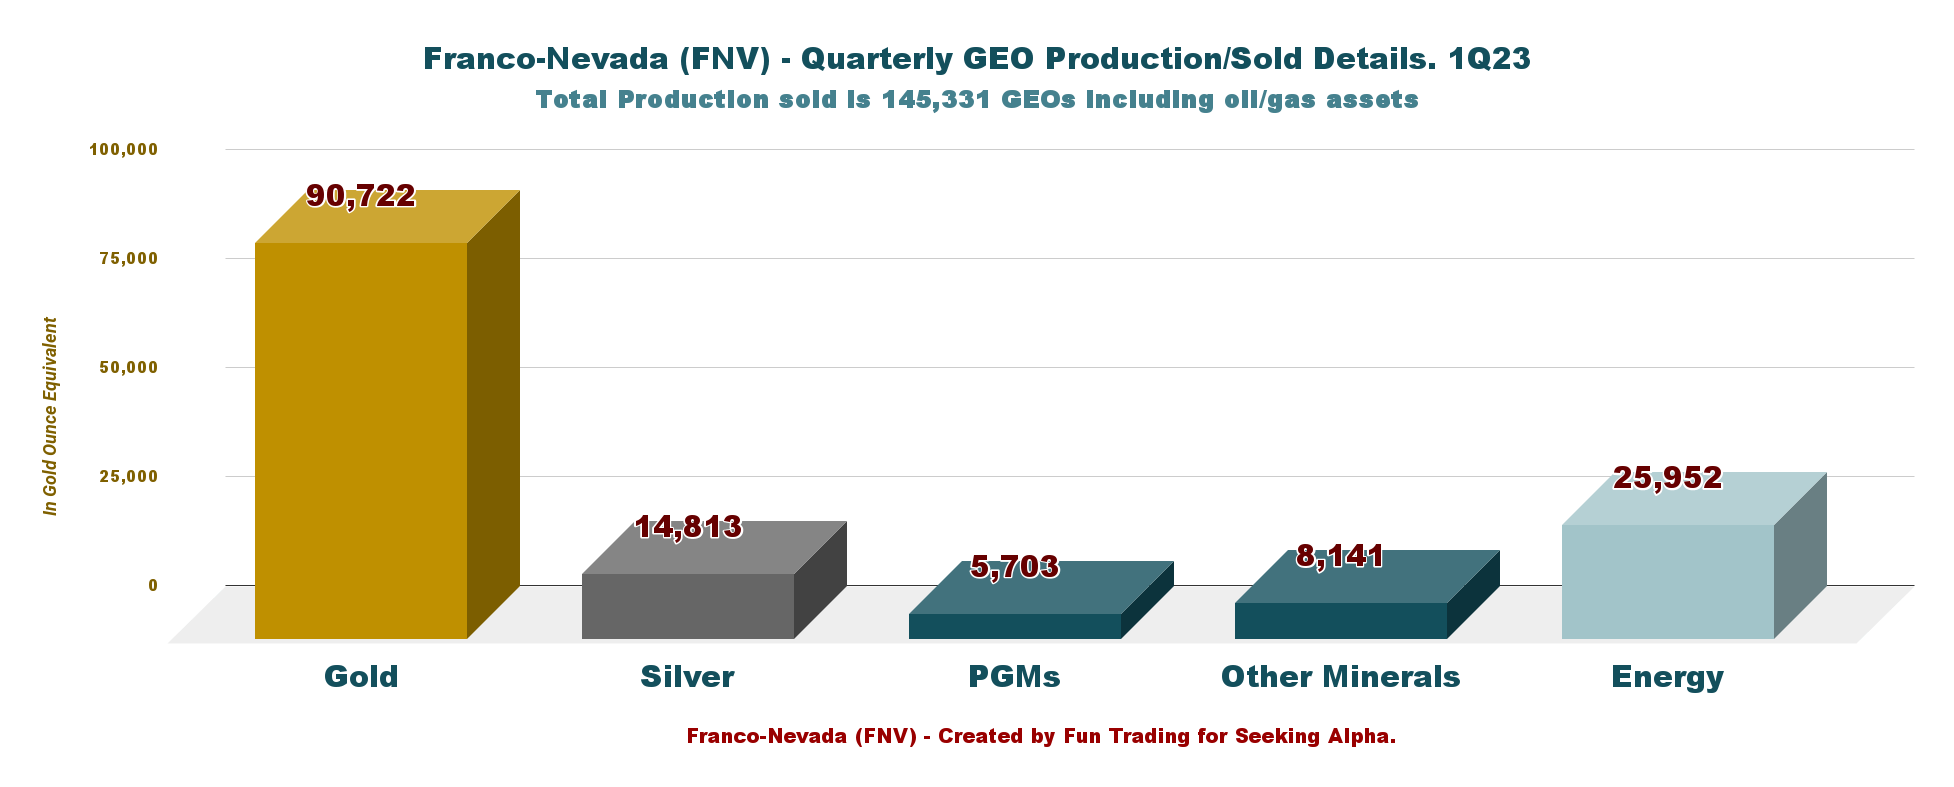
Note: Other metals include mainly Iron for 7,074 GEOs.
In the first quarter of 2023, metal and energy prices were as follows:
- $1,889/oz gold
- $22.56/oz silver
- $994/oz platinum
- $1,567/oz palladium
- $124/tonne Fe 62% CFR China.
5 - Guidance 2023 and 2027 Outlook (unchanged)
FNV 2023 Guidance (FNV Presentation)
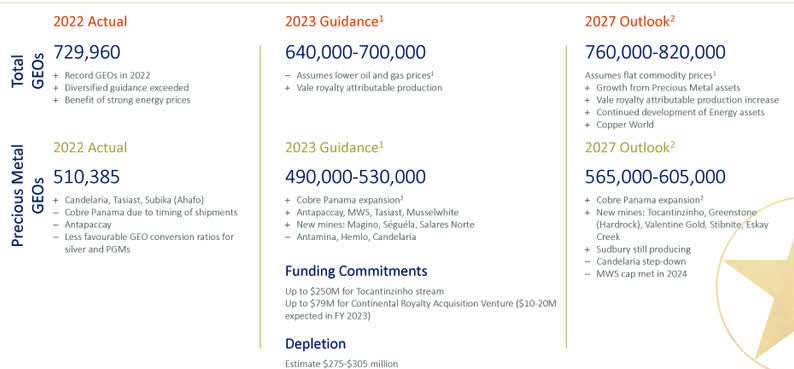
The company also indicated a 2027 Outlook of 760K-820K GEOs, consistent with the 2026 outlook shown in the preceding quarter.
Technical Analysis And Commentary
FNV TA Chart short-term (Fun Trading StockCharts)
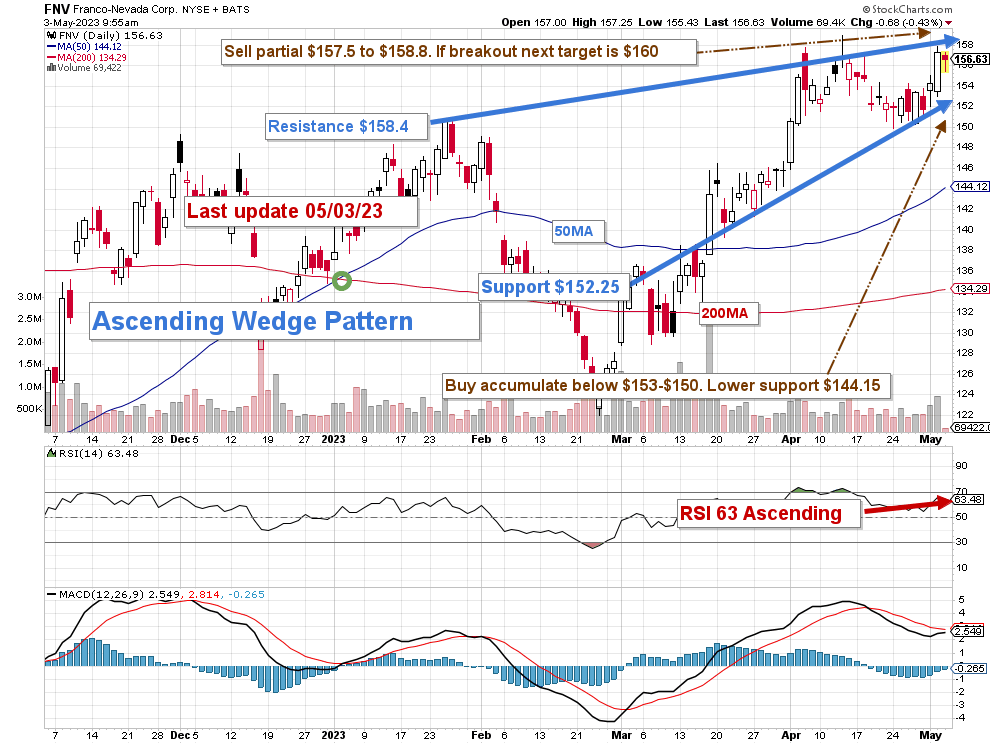
Note: The chart has been adjusted for the dividend.
FNV forms an ascending wedge pattern with resistance at $158.4 and support at $152.25.
A rising wedge is a bearish stock pattern that begins wide at the bottom and contracts as trading range narrows and the prices move higher.
The dominant strategy I regularly promote in my marketplace, "The Gold and Oil Corner," is to keep a core long-term position and use about 40% to trade LIFO FNV while waiting for a higher final price target for your core position.
I suggest buying Franco-Nevada Corporation between $153 and $150 with potential lower support at $144.15. Conversely, it is reasonable to take profits between $157.5 and $158.8 with higher resistance at $160.
Warning: The TA chart must be updated frequently to be relevant. It is what I am doing in my stock tracker. The chart above has a possible validity of about a week. Remember, the TA chart is a tool only to help you adopt the right strategy. It is not a way to foresee the future. No one and nothing can.
For further details see:
Franco-Nevada Corporation: A Weak Production Quarter