FC - Franklin Covey: Today's Near-Term Best Buy Management Consulting Services Stock
2023-03-16 12:13:46 ET
Summary
- This investment choice is based on both fundamentals and market judgment that investors have favorable odds to see 20+% gains in the next few months from the stock’s ownership.
- How do we believe that can happen? Smart money is betting that it will. Not only market-active institutional investor-buyers expect continued recovery, but speculator-insurance providers also see it within limits.
- Its prior outcomes of its net benefits as tests of seen-today forecasts for how big, how sure, and how soon it may recover appear substantially more likely than average for some 3,000 equities.
- Alternatives presented include those identified by Yahoo Finance as being “similar to” the subject, or stocks which “people also watch” as well as the subject.
The primary focus of this article is near-term capital gain from Franklin Covey Co. ( FC ).
Investment Thesis
The trade-commission-free automation progress achieved by securities markets in serving a continuing flow of individual investor internet-order small trades makes it necessary for Market-Makers to have capital at risk while handling the irregular huge-value “institutional” transactions. They protect their at-risk capital endangerment by hedging actions which reflects the coming price range expectations of the stocks involved – virtually all of the actively-traded issues.
The pricing and structure of such hedges reveal the coming-price expectations of both the MM protection-buyers and that of the MM industry protection-sellers.
Our selection of FC is established by its currently-attractive stock pricing reinforced by other Seeking Alpha fundamental-analytical contributors.
Description of Subject Company
“Franklin Covey Co. provides training and consulting services in the areas of execution, sales performance, productivity, customer loyalty, and educational improvement for organizations and individuals worldwide. The company operates through three segments: Direct Offices, International Licensees, and Education Practice. It also provides a suite of individual-effectiveness and leadership-development training and products. Franklin Covey Co. was incorporated in 1983 and is headquartered in Salt Lake City, Utah.”
Source: Yahoo
Yahoo Finance
These growth estimates have been made by and are collected from Wall Street analysts to suggest what conventional methodology currently produces. The typical variations across forecast horizons of different time periods illustrate the difficulty of making value comparisons when the forecast horizon is not clearly defined.
Risk~Reward Comparisons of Alternative Investment Candidates
Here are several businesses similar to Franklin Covey Co. Following the same analysis as with FC, historic sampling of today’s Risk~Reward balances were taken for each of the alternative investments. They are mapped out in Figure 1.
Figure 1
blockdesk.com
(used with prior permission)
The tradeoffs here are between near-term upside price gains (green horizontal scale) seen worth protecting against by Market-makers with short positions in each of the stocks, and the prior actual price draw-downs experienced during holdings of those stocks (red vertical scale). Both scales are of percent change from zero to 25%.
The intersection of those coordinates by the numbered positions is identified by the stock symbols in the blue field to the right.
The dotted diagonal line marks the points of equal upside price change forecasts derived from Market-Maker [MM] hedging actions and the actual worst-case price draw-downs from positions that could have been taken following prior MM forecasts like today's.
Our principal interest is in FC at location [9] near the right-hand margin. A "market index" norm of reward~risk tradeoffs is offered by SPDR S&P500 index ETF at [6]. Best-located issues in Figure 1 are in directions down and to the right, like [9].
Those forecasts are implied by the self-protective behaviors of MMs who must usually put firm capital at temporary risk to balance buyer and seller interests in helping big-money portfolio managers make volume adjustments to multi-billion-dollar portfolios. The protective actions taken with real-money bets define daily the extent of likely expected price changes for thousands of stocks and ETFs.
On occasion stock prices reach extremes producing Reward~Risk balances not previously encountered in prior recent 5 year daily markets. That is the case here for NVEE [5] and CBZ [4]. Specifics are presented in the next visual.
This map is a good starting point, but it can only cover some of the investment characteristics that often should influence an investor's choice of where to put his/her capital to work. The table in Figure 2 covers the above considerations and several others.
Comparing Alternative Investments
Figure 2
(used with prior permission)
Why do all this math?
Figure 2's purpose is to attempt universally comparable answers, stock by stock, of a) How BIG the prospective price gain payoff may be, b) how LIKELY the payoff will be a profitable experience, c) how SOON it may happen, and d) what price draw-down RISK may be encountered during its holding period.
Readers familiar with our analysis methods after quick examination of Figure 2 may wish to skip to the next section viewing Price range forecast trends for FC.
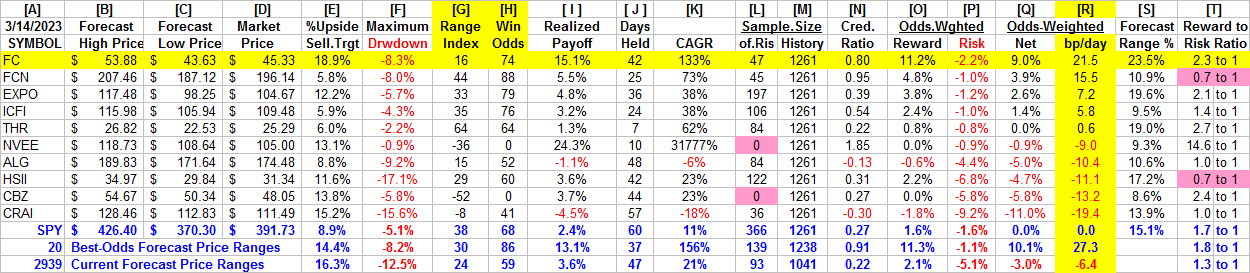
Column headers for Figure 2 define investment-choice preference elements for each row stock whose symbol appears at the left in column [A]. The elements are derived or calculated separately for each stock, based on the specifics of its situation and current-day MM price-range forecasts. Data in red numerals are negative, usually undesirable to "long" holding positions. Table cells with yellow fills are of data for the stocks of principal interest and of all issues at the ranking column, [R].
The price-range forecast limits of columns [B] and [C] get defined by MM hedging actions to protect firm capital required to be put at risk of price changes from volume trade orders placed by big-$ "institutional" clients.
[E] measures potential upside risks for MM short positions created to fill such orders, and reward potentials for the buy-side positions so created. Prior forecasts like the present provide a history of relevant price draw-down risks for buyers. The most severe ones actually encountered are in [F], during holding periods in effort to reach [E] gains. Those are where buyers are emotionally most likely to accept losses.
The Range Index [G] tells where today's price lies relative to the MM community's forecast of upper and lower limits of coming prices. Its numeric is the percentage proportion of the full low to high forecast seen below the current market price.
For NVEE and CBZ the RIs are more extreme than previously encountered, preventing the historic performance measurement explained next.
[H] tells what proportion of the [L] sample of prior like-balance forecasts have earned gains by either having price reach its [B] target or be above its [D] entry cost at the end of a 3-month max-patience holding period limit. [ I ] gives the net gains-losses of those [L] experiences.
What makes FC most attractive in the group at this point in time is its basic strength of reward to risk ratio of 2.3 to 1 in [T], more than the brevity of holdings needed to reach closeout prices..
Further Reward~Risk tradeoffs involve using the [H] odds for gains with the 100 - H loss odds as weights for N-conditioned [E] and for [F], for a combined-return score [Q]. The typical position holding period [J] on [Q] provides a figure of merit [ fom ] ranking measure [R] useful in portfolio position preferencing. Figure 2 is row-ranked on [R] among alternative candidate securities, with IDT in top rank.
Along with the candidate-specific stocks these selection considerations are provided for the averages of some 3000+ stocks for which MM price-range forecasts are available today, and 20 of the best-ranked (by fom) of those forecasts, as well as the forecast for S&P500 Index ETF ( SPY ) as an equity-market proxy.
Current-market index SPY is not competitive as an investment alternative. Its Range Index of 38 indicates 62% of its forecast range is to the upside, but Less than 3/4ths of previous SPY forecasts at this range index produced profitable outcomes, with enough losers to put its average payoff in low single-digit positive result.
As shown in column [T] of figure 2, those levels vary significantly between stocks. What matters is the net profit between investment gains and losses actually achieved following the forecasts, shown in column [I]. The Win Odds of [H] tells what proportion of the Sample RIs of each stock were profitable. Odds below 80% often have proven to lack reliability.
Recent Price Range Forecast Trends for FC
Figure 3
(used with prior permission)
An obvious visual problem is present here where one day’s non-representative forecast forces an undesirable vertical scale on everything else. The visual difficulty can be relieved by Figure 4, where FC’s historical price range forecasts and performance is shown weekly instead of daily, for the past two years rather than six months.
Figure 4
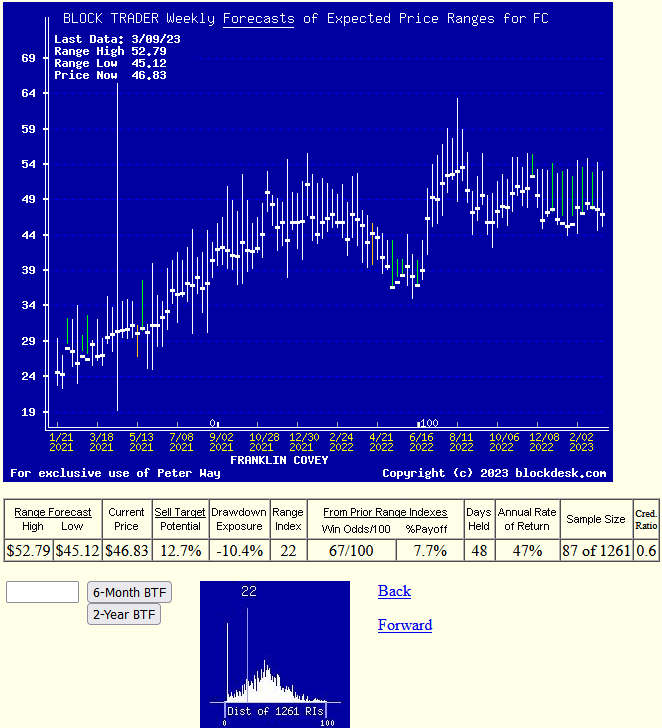
This picture is not a “technical chart” of past prices for FC. Instead, its vertical lines show daily price range forecasts of market actions yet to come in the next few months made weekly during the past 2 years. The only past information there is the heavy dot of the closing stock price on the day of each forecast.
That data splits the price range’s opposite forecasts into upside and downside prospects. Their trends over time provide additional insights into coming potentials, and helps keep perspective on what may be coming.
The row of data in each figure differs slightly due to the dates the forecasts were made, March 9 th and 14 th . The more current date of Figure 3 reflects the stock’s better value of a Range Index of 16 rather than the earlier RI of 22.
The small picture at the bottom of Figure 3 is a frequency distribution of the Range Index’s appearance daily during the past 5 years of daily forecasts. The Range Index [RI] tells how much the downside of the forecast range occupies of that percentage of the entire range each day, and its frequency suggests what may seem “normal” for that stock, in the expectations of its evaluators’ eyes. A RI of 16 means nearly all of the coming price range now considered likely, with only some one sixth may be encountered to the downside. A good value opportunity, compared to most others of its kind.
The Win Odds of 74 tells that percentage (6 of every 8) of all prior forecasts in 5 years like today’s have seen the stock’s price advance above its entry cost, often to its Sell Target.
Conclusion
Among all these alternative investments explicitly compared above, Franklin Covey Co. appears to be a logical buy preference now for investors seeking near-term capital gains.
For further details see:
Franklin Covey: Today's Near-Term Best Buy Management Consulting Services Stock