FSNUF - Fresenius SE Probably Found Its Bottom
2023-09-22 10:37:49 ET
Summary
- Fresenius SE outperformed the S&P 500 in the last few quarters and could have found its temporary bottom.
- While the quarterly results are still not great, Fresenius Kabi is expected to grow with a high pace and Fresenius Helios is back on its way to pre-crisis levels.
- Even when assuming rather low growth rates for Fresenius, the stock is still deeply undervalued and a "Buy" in my opinion.
If I wanted to brag, I would now point to my last two articles about Fresenius SE ( FSNUF ) and highlight the great performance of the stock since the articles were published. My last article was published in April 2023 and Fresenius SE generated a total return of 19% and was therefore outperforming the S&P 500. And the previous article was published in November 2022 resulting in a total return of 69% - clearly outperforming the S&P 500, which increased “only” 14%.
But we should not ignore that I published several more bullish articles about Fresenius SE in the past and most of the previous articles were published at a time when the stock was trading for a higher share price. I personally am holding on to my shares and I am still bullish and think Fresenius SE deserves a higher share price. In the following article I will provide an update on the business, and we start by looking at the mediocre last quarter results.
Quarterly Results
When looking at the second quarter results, Fresenius SE reported at the beginning of August 2023, there is not much to be excited about. The business grew its top line from €10,018 million in sales in Q2/22 to €10,359 million in Q2/23 – resulting in 3.4% year-over-year growth. But while the top line improved, operating income (EBIT) declined from €845 million in the same quarter last year to €543 million this quarter – a decline of 35.7% YoY. And earnings per ordinary share also declined from €0.80 in Q2/22 to €0.67 in Q2/23 – resulting in 16.3% year-over-year decline.
We can also look at the quarterly results excluding Fresenius Medical Care. The picture is similar, but a little better. Revenue increased 5% year-over-year to €5,557 million (in constant currencies, growth was even 7%). Operating income (EBIT) declined only 1% to €555 million and net income declined 17% to €375 million.
Fresenius SE Q2/23 Business Presentation
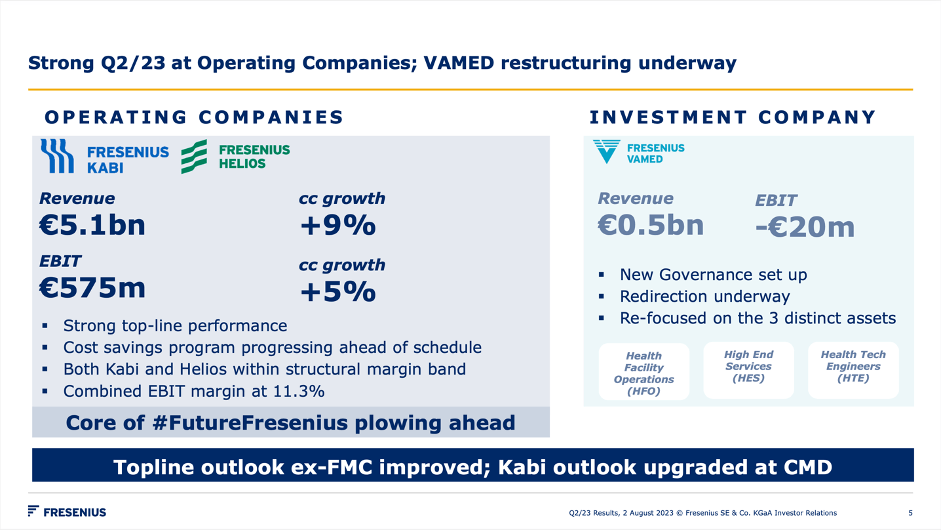
Of course, we can’t just pick the results we like and ignore the negative news. However, when looking at the core business of the restructured Fresenius SE – the two operating companies Fresenius Kabi and Fresenius Helios – we see decent results. It is especially Fresenius Vamed that is generating problems. The two operating companies grew sales 9% year-over-year (in constant currency), and EBIT grew 5% (also in constant currency).
Looking At The Chart
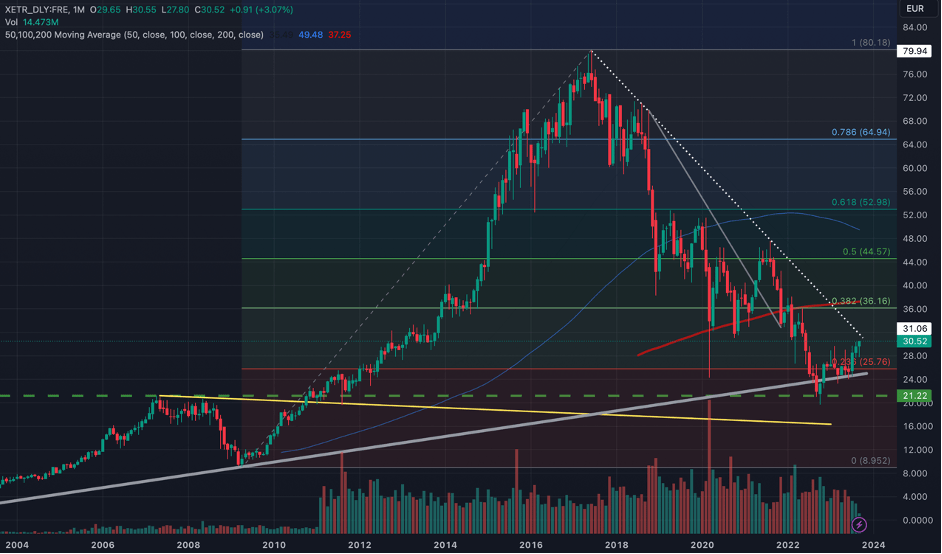
When looking at the chart of Fresenius SE, we can either see an improving picture or a stock that is still in a downtrend – and both seems to be true. On the one hand, several support levels were holding for Fresenius in the last few months – which can be interpreted as rather positive sign. First, the stock bounced off the 2007 high (which the stock set before the decline during the Great Financial Crisis) around €21 (see green dotted line) and the long-term upward trendline (grey trendline) also held. Additionally, Fresenius already corrected most of the previous upward wave and is already at the 23% Fibonacci retracement – this can also be seen as a hint for the correction being over.
Fresenius SE Monthly Chart (TradingView)
On the other hand, Fresenius is still not in an uptrend, and I don’t know how optimistic we should be at this point. Fresenius seems to be at a decisive point right now: If the stock can move above €32-33, it would not only break a declining trendline (dotted white line), but it would also break above the resistance level, which was created by the lows of the years 2020 and 2021. And while this would be a great sign, we should not forget that the 200-month simple moving average (around €38 right now) and the previous highs (around €47) are still two major resistance levels on the way up.
Although we could be slightly optimistic at this point, this could very well just be another correction of the current downward trend. Since Fresenius SE can’t move above €47, it is rather difficult to see the stock in an upward trend.
Growth Potential
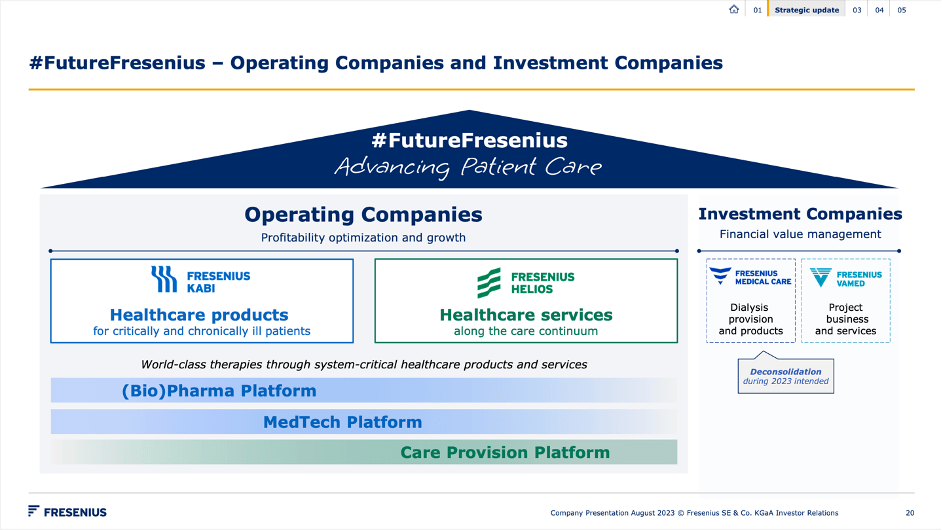
In my last article I already mentioned the new operating structure for Fresenius SE as well as Fresenius Medical Care AG ( FMS ). While Fresenius SE will still keep a stake in Fresenius Medical Care, the business is now allowed to operate by itself and it is no longer controlled by Fresenius SE (despite a 32% ownership). On the other hand, Fresenius Medical Care will be removed from the balance sheet of Fresenius SE.
Fresenius SE Q2/23 Business Presentation
Fresenius SE is now presenting itself in two major parts – on the one side the two operating companies and on the other side the investment companies. I already mentioned above that the two operating companies performed quite well in the second quarter of fiscal 2023.
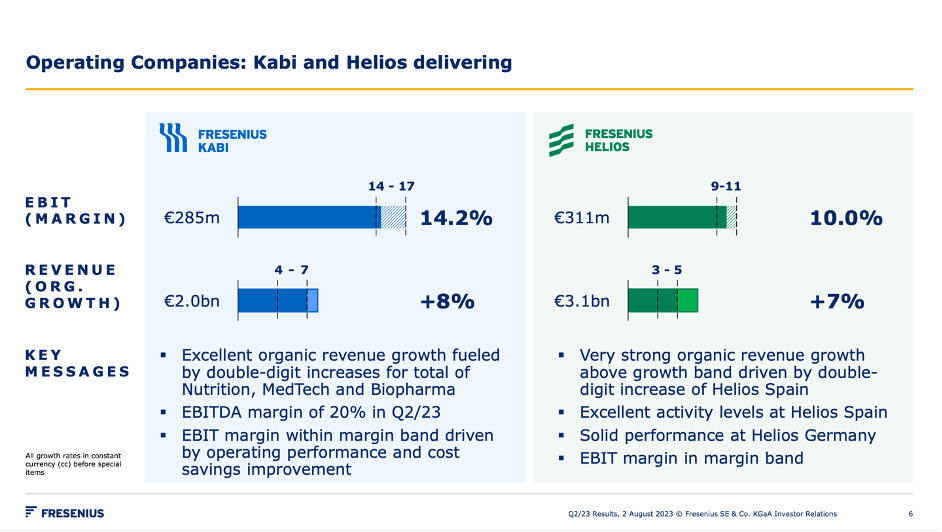
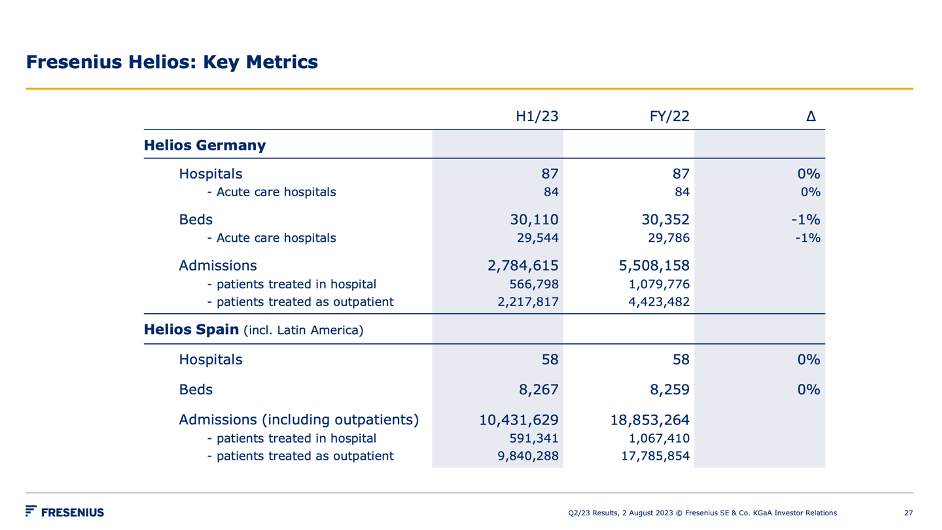
And Fresenius SE will now especially focus on Fresenius Kabi and Fresenius Helios. And for Fresenius Helios, results came in above expectations in the last quarter. Organic revenue grew 7% for Fresenius Helios. And while Helios Germany reported only 4% YoY growth to €1,823 million, Helios Spain grew revenue 12% YoY to €1,223 million and Helios Fertility grew revenue 11% YoY to €68 million (growth in constant currency).
Fresenius SE Q2/23 Business Presentation
And in case of Helios, we can expect the business to constantly improve again. Helios was suffering the last few years due to COVID-19, which had a huge negative effect. But now admissions are increasing again (at least it seems that way). We must compare full-year fiscal 2022 results to first half results for fiscal 2023. Assuming little seasonality for admissions, the number is growing with a low, but solid pace in Germany and a much higher pace in Spain (including Latin America).
Fresenius SE Q2/23 Business Presentation
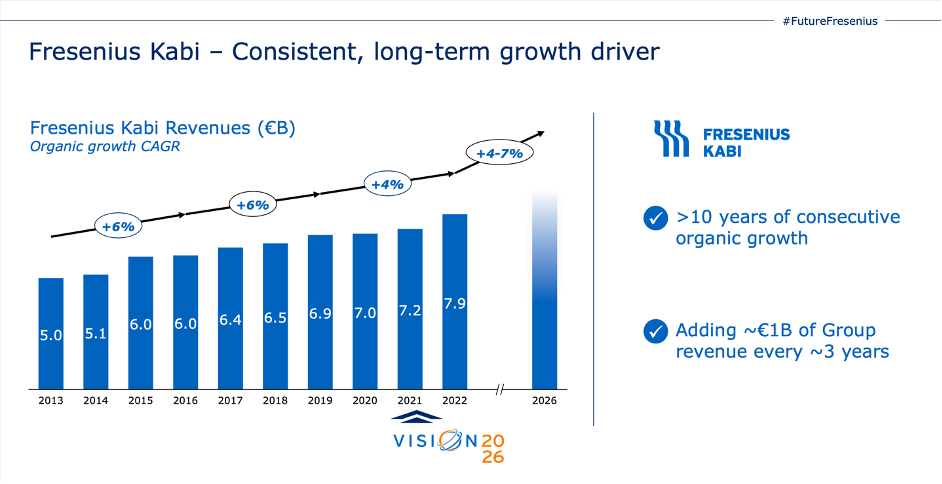
Aside from Fresenius Helios returning to a solid pre-crisis performance, it is especially Fresenius Kabi that should contribute to growth in the years to come. And Fresenius Kabi is specializing on four different segments: Pharma (€3.8 billion in sales), Nutrition (€2.4 billion in sales), MedTech (€1.4 billion in sales) and Biopharma (€0.2 billion in sales). And while the overall business was struggling, Fresenius Kabi reporting very solid results with more than 10 years of consecutive organic growth.
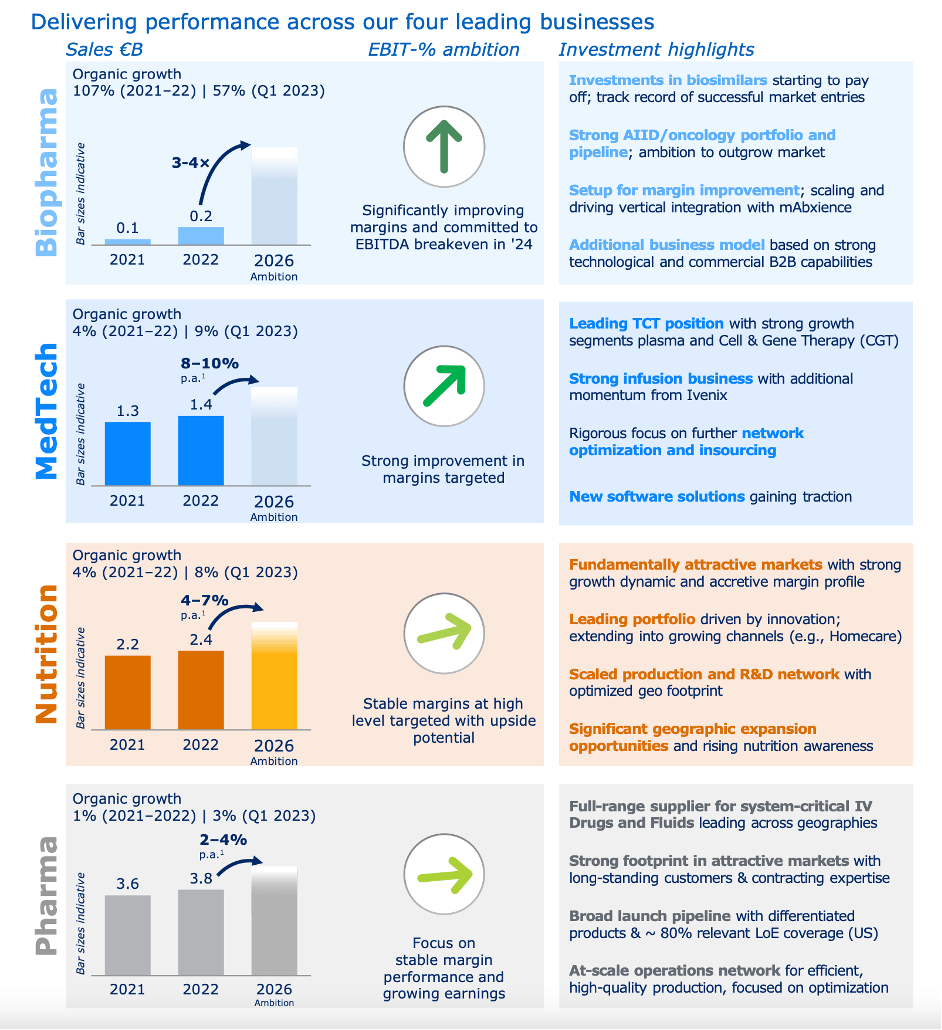
Especially during its recent Investor Day 2023, the company provided a lot of information about Fresenius Kabi and the company has rather high ambitions for Biopharma, MedTech and Nutrition. While the Nutrition business is expected to grow between 4% and 7% annually, MedTech is expected to grow between 8% and 10% annually and for Biopharma Fresenius is even expecting sales to triple or quadruple until 2026. Additionally, Fresenius is also hoping to improve margins significantly for Biopharma and is committed to EBITDA breakeven in 2024. The investments in biosimilars are starting to pay off and Fresenius has more than 10 pipeline assets here.
Fresenius Capital Market 2023 Infographic
For the biggest sub-segment “Pharma”, Fresenius will focus on stable margin performance and is expecting to grow sales about 2% to 4% annually.
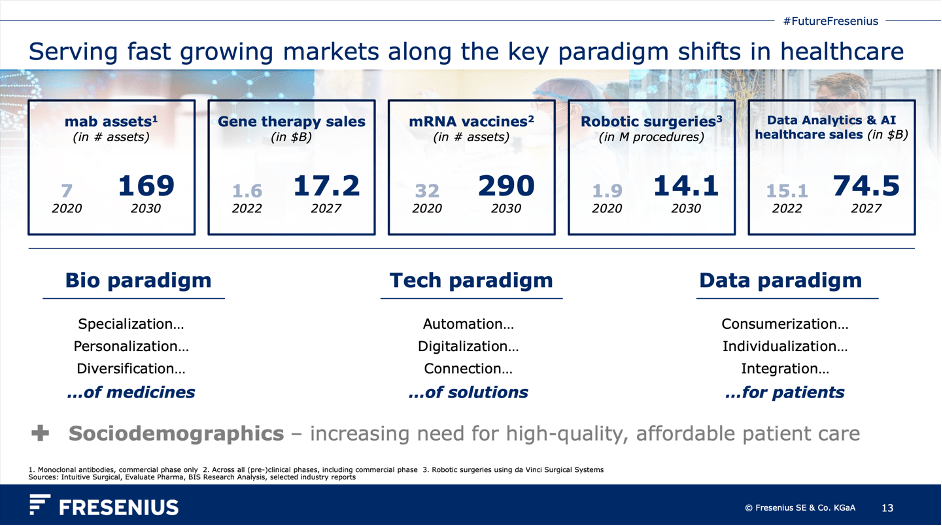
In total, Fresenius seems quite confident that it is serving fast-growing markets along the key paradigm shifts in healthcare. This is including the increasing need for high-quality, affordable patient care (here we are rather talking about Fresenius Helios), but also mRNA vaccines, gene therapy sales, robotic surgeries, and data analytics sales.
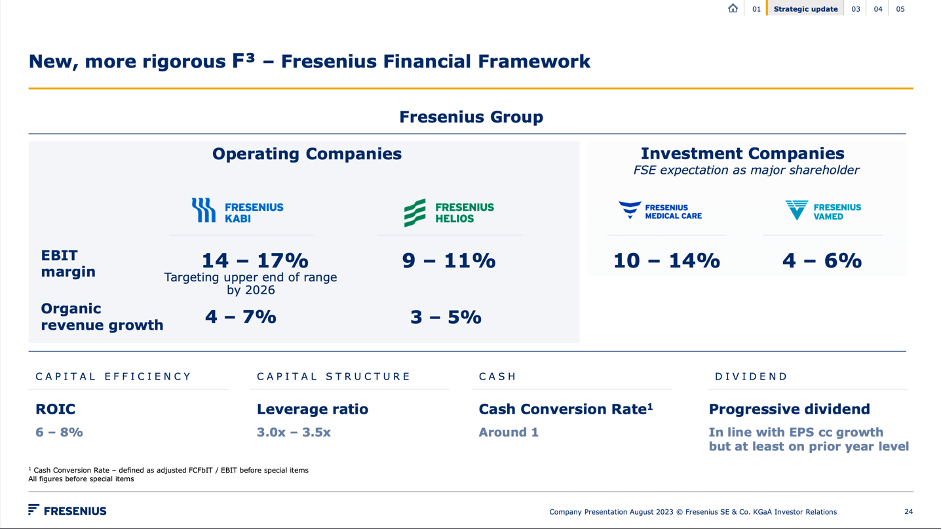
When trying to sum up, Fresenius has its F3 – the Fresenius Financial Framework – with growth targets for the next few years. While Fresenius Kabi is expected to grow revenue organically between 4% and 7% in the next few years, Helios is expected to grow between 3% and 5%. And for its EBIT margin, the company is now also expecting Fresenius Kabi being at the higher end of its 14% to 17% target range.
Fresenius SE Q2/23 Business Presentation
And I mentioned this several times in different articles in the past. Fresenius should be profiting from several long-term opportunities in growing, non-cyclical markets. But despite all optimism about the theoretical trends (aging population, growing healthcare sector, chronically ill patients) that could help Fresenius, we should not ignore that Fresenius was really struggling in the past few years (I also mentioned this in my last article). And it is time that we see real improvement for the top and bottom line and not only new strategies how to make the company better and more efficient.
Balance Sheet
Aside from Fresenius struggling to grow its bottom line, it was especially the company’s balance sheet and high debt levels that were problematic and reason for concern. When looking at the balance sheet on June 30, 2023, Fresenius had a total debt of €28,183 million (and compared to six months earlier, debt even increased 2%). And even when subtracting €2,471 million in cash and cash equivalents, we get a net debt of €25,712 million.
When comparing the total debt to the shareholder’s equity of €31,430 million, Fresenius has a debt-equity ratio of 0.90 and usually numbers below 1.00 are seen as acceptable. However, when comparing the total debt to the operating income we get horrible numbers. Even when taking the higher operating income from fiscal 2021 (€4,158 million) and subtracting cash and cash equivalents it would take more than 6 years to repay the outstanding debt.
Fresenius SE Q2/23 Business Presentation
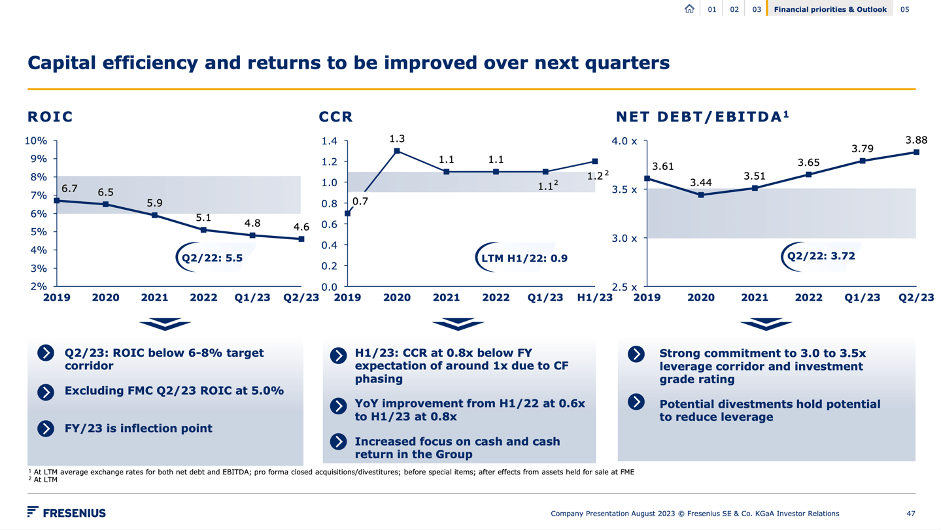
Fresenius is also above its leverage corridor of net debt to EBITDA being between 3.0 and 3.5. Right now, the ratio is 3.88 and I consider the target corridor already as rather high. However, due to the restructuring, debt of Fresenius Medical Care won’t be on the balance sheet in 2024 and going forward. The group net debt excluding Fresenius Medical Care was €14,162 million, which seems to be a more acceptable level.
Nevertheless, I think we should pay close attention to Fresenius SE’s balance sheet and the debt levels were high for several years in a row, which is not a good sign.
Intrinsic Value Calculation
While Fresenius has a horrible balance sheet and has been struggling to grow its bottom line in the last few years, the valuation of Fresenius SE still seems compelling. When using fiscal 2022 earnings per share of €3.08, the stock is trading for a P/E ratio of 9.9 at the time of writing. Usually, a P/E ratio of 10 is seen as acceptable for a business that is not able to grow anymore but is generating a stable free cash flow every year. A stable, non-growing business trading for 10 times earnings would generate a return on investment of 10%.
Aside from the extremely low P/E ratio indicating an undervalued stock, we can use a discount cash flow calculation to determine an intrinsic value for the stock. As basis we often take the free cash flow of the last year (or last four quarters) and Fresenius is reporting a free cash flow after acquisitions and dividends. However, I think we should look at the number before acquisitions and dividends. Acquisitions as well as dividends are just two of the different ways a company can use its free cash flow. In fiscal 2022, the reported free cash flow of Fresenius was only €701 million, but when adding back dividends and acquisitions, we get €2,421 million in free cash flow.
When calculating with 563.2 million diluted outstanding shares and 10% discount rate, we get an intrinsic value of €42.99 for Fresenius and the stock is definitely undervalued. As long as we are talking about shares outstanding, we can point out that the number increased from 559.3 million in the previous year to 563.2 million right now. While this is certainly not the worst dilution we can find out there, it is also not great for a mature business.
We can also be a little more optimistic and assume Fresenius will be able to grow again. And the company has high ambitious (see sections above). Let’s be cautious and assume only 3% growth in the years to come – which is still a rather low growth assumption and in my opinion a realistic and achievable goal for Fresenius. This leads to an intrinsic value of €61.41 and Fresenius SE could potentially double from here based on this.
Conclusion
I my opinion, Fresenius SE is still a deeply undervalued stock, and it seems like the stock could have finally found its bottom as the stock is trading at strong support levels right now. With the new company structure, Fresenius Kabi continuing its strong performance and Fresenius Helios on its way to pre-COVID levels, we can be optimistic. And even if Fresenius is not able to meet its mid-to-high single digits growth targets management has, the stock is still deeply undervalued from a fundamental point of view.
For further details see:
Fresenius SE Probably Found Its Bottom