FSK - FS KKR: 14% Stock Yield Or 8% Bond Yield?
2023-09-25 13:17:02 ET
Summary
- This is a series of articles discussing retirement portfolios using BDCs currently yielding around 12% and their safer notes, baby bonds/preferred shares with yield-to-maturities ranging from 6% to 9%.
- We discuss the interest expense and asset coverage ratios for one of the more popular BDCs as well as its 8 investment-grade bonds.
- I prefer bonds/notes (with CUSIPS) to the Baby Bonds (with tickers) due to the "make-whole premiums," compensating bondholders for the interest they would have earned if they were called/redeemed early.
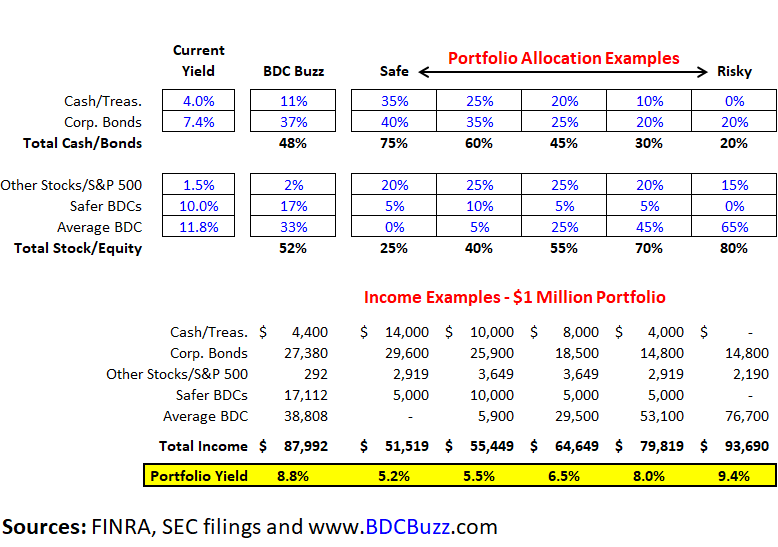
- The following table shows some examples of allocations and my personal portfolio (not exact) with portfolio yields ranging from 5.2% to 9.4%.
Introduction
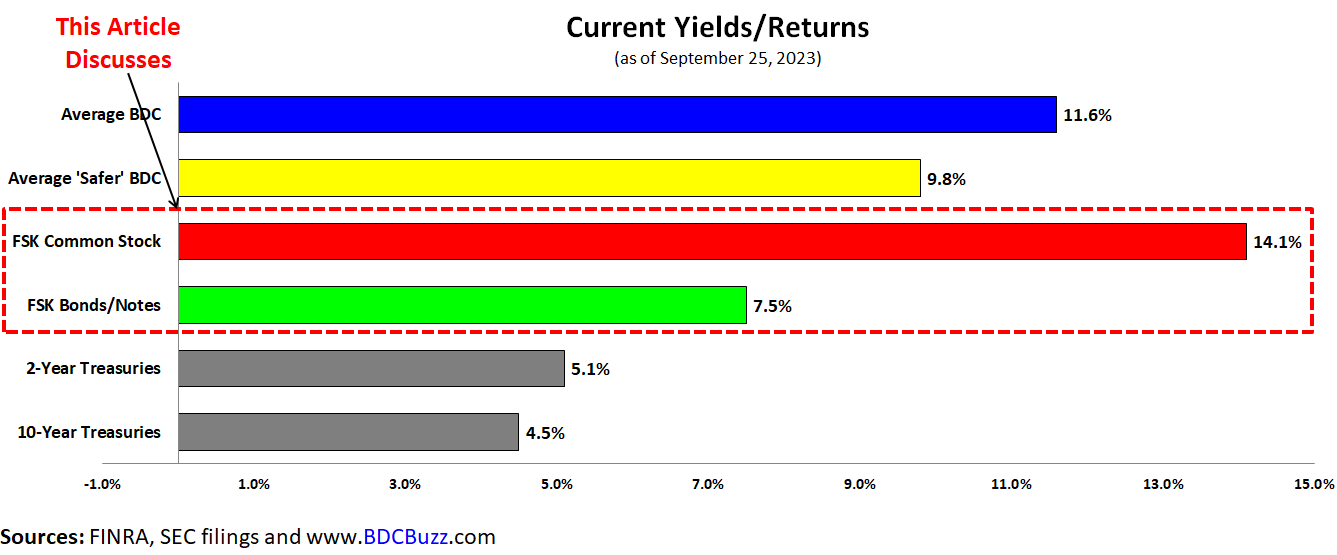
This is part of a series of articles discussing how to build a balanced retirement portfolio using business development company ("BDC") common stocks currently yielding almost 12% and their safer notes - baby bonds/preferred shares with yield-to-maturities ranging from 6.5% to 9.0%. This article discusses FS KKR Capital (FSK) currently yielding around 14% (including supplemental dividends, discussed later), and its investment-grade bonds with yield-to-maturities of around 7% to 8%.
As discussed in " Better High-Yield Buy: FSK or PSEC? " FSK is for higher-risk investors for the reasons discussed at the end of this article.
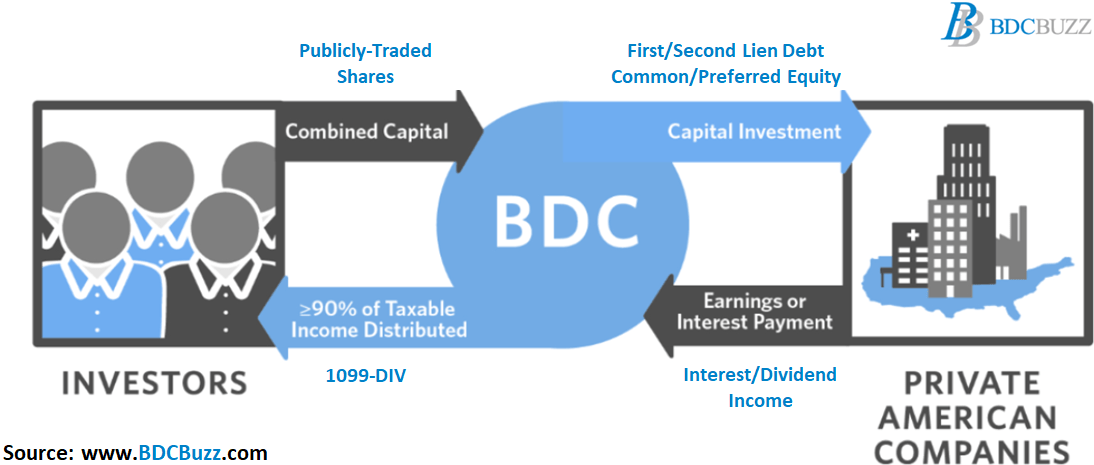
Business development companies invest shareholder capital in privately-owned, small- and medium-sized U.S. companies generating income from secured loans and capital gains from equity positions, much like venture capital or private equity funds.
Many readers ask where BDC stocks and bonds fit into their overall portfolio. Your portfolio allocations depend on a few factors, including your age, overall risk appetite, investment time frame, and need to access capital.
BDCs are for longer-term investors so please allow an investment time frame of at least three years. The following charts use the oversimplified asset classes of cash, treasuries, corporate bonds/notes, other stocks (general market equities), and higher-yield investments (including BDCs) along with some examples of allocations and my personal portfolio (not exact):
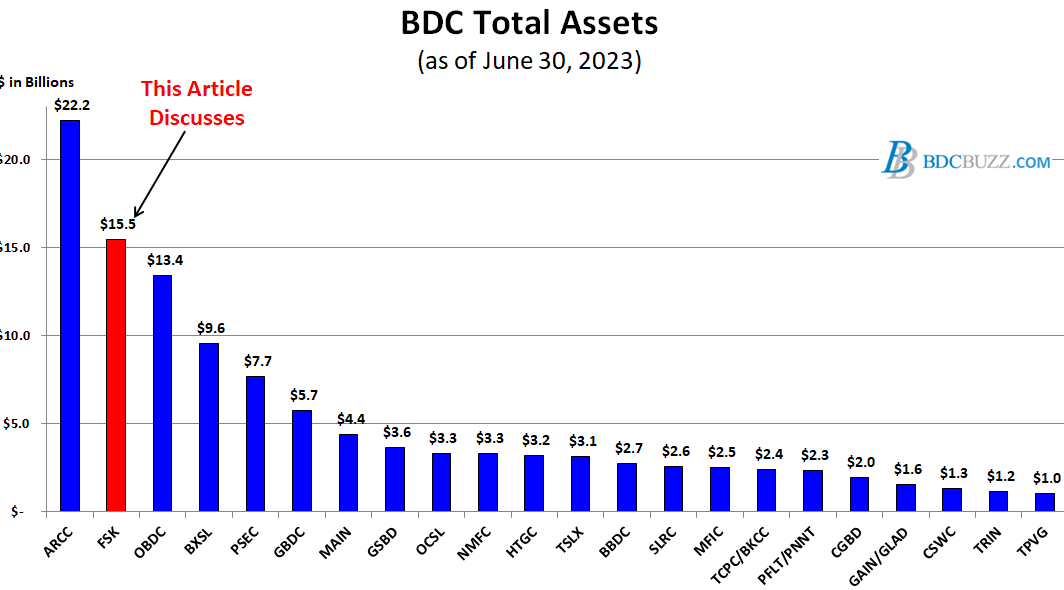
The BDCs in the chart below account for around 90% of the total assets and market capitalization for the sector. Over three months, we discussed the portfolio credit quality and/or dividend coverage for most of them, including Ares Capital ( ARCC ), Blue Owl Capital ( OBDC ), Blackstone Secured Lending ( BXSL ), Prospect Capital ( PSEC ), Golub Capital BDC ( GBDC ), Main Street Capital ( MAIN ), Goldman Sachs BDC ( GSBD ), Oaktree Specialty Lending ( OCSL ), New Mountain Finance ( NMFC ), Hercules Capital ( HTGC ), Sixth Street Specialty Lending ( TSLX ), PennantPark Floating Rate Capital ( PFLT ), PennantPark Investment ( PNNT ), BlackRock TCP Capital ( TCPC ), Gladstone Investment ( GAIN ), Gladstone Capital ( GLAD ), Monroe Capital ( MRCC ), Trinity Capital ( TRIN ), and TriplePoint Venture Growth ( TPVG ) in the following articles:
- ARCC: Assessing The Recent Results For 10% Yield
- BXSL: Building A Balanced Portfolio
- PSEC: Still Arranging The Deck Chairs
- Solid 10% Yield From OBDC or TSLX?
- GBDC: Lower Fees Driving Higher Dividends
- MAIN: Building A Balanced Portfolio
- Safer 12% Yield: GSBD or MRCC
- Solid 10% Yield From GAIN & GLAD
- OCSL or NMFC For Solid 11% Yield?
- PNNT: Big Win From Dominion/Fox Settlement
- Venture Debt Opportunity Yielding 13% To 14%: HTGC or TPVG?
- TCPC or PFLT For Solid 12% Yield?
- TRIN: Initiating Coverage Of This 14% Yielding BDC
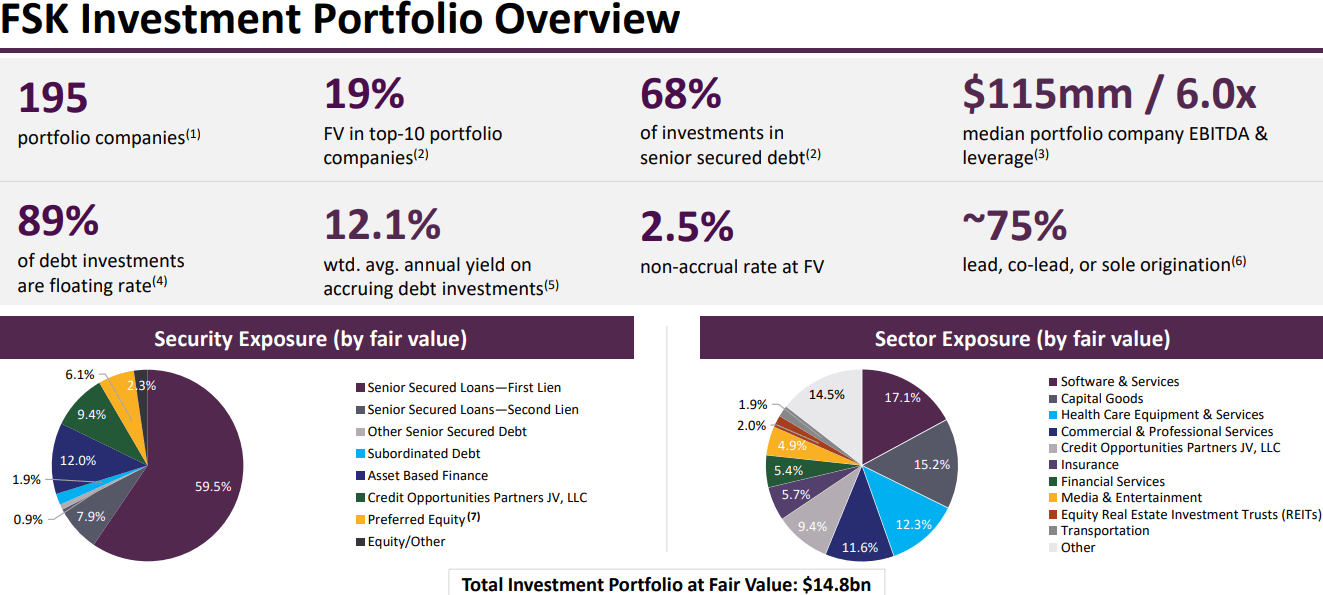
Most BDCs typically do not directly invest in businesses with cyclical exposure such as retail, restaurants, sporting event-related, airlines, oil/energy, etc., and if they do it's a small portion of the portfolio. FSK has a diversified portfolio of 195 portfolio companies across many industry segments:
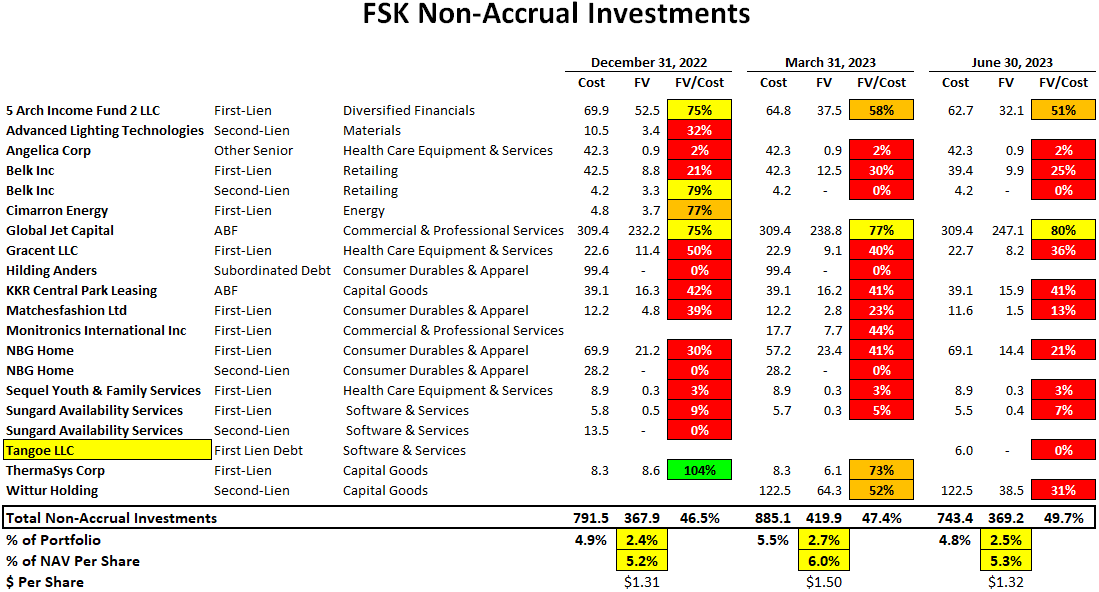
Non-accrual investments recently decreased from 2.7% to 2.5% of the total portfolio at fair value mostly due to exiting/restructuring Hilding Anders , NBG Home (second-lien only), Monitronics International , and ThermaSys partially offset by adding its smaller watch list loan to Tangoe .
It's important to note that FSK has additional loans to many of the portfolio companies listed below that remain on accrual status including the recently added watch list company Tangoe with another $180 million that could be added over the coming quarters.
During Q2 2023, FSK's NAV per share declined by another $0.24 or 1.0% (from $24.93 to $24.69) due to additional markdowns for its watch list investments partially offset by over-earning the dividends (discussed later).
It's important to note that many of the lower-quality BDCs will restructure investments before the end of the quarter to reduce the amount on non-accrual status. However, this drives "realized losses" which should be tracked to help assess historical credit quality (along with changes in NAV).
During Q2 2023, FSK had additional realized losses of $214 million or $0.76 per share of realized losses including the exits of its non-accrual investments. Over the last eight years, FSK has experienced realized losses of almost $1 billion or $3.30 per share which is much more than any other BDC.
As shown below, FSK's NAV per share has declined by over 30% over the last five years which is among the worst performance in the BDC sector.
FSK Dividend Update and Coverage Ratios
For Q2 2023, FSK reported below its base case projections mostly due to a decline in the overall portfolio partially offset by continued higher dividend and other income and another increase in the portfolio yield (from 11.7% to 12.1%). There are many factors to take into account when assessing dividend coverage for BDCs including portfolio credit quality, realized losses, fee structures including "total return hurdles" taking into account capital losses, changes to portfolio yields, borrowing rates, the amount of non-recurring and non-cash income including payment-in-kind ("PIK"). Most BDCs have around 2% to 8% PIK income and I pay close attention once it's over ~5% of interest income. Higher amounts of PIK is typically a sign that portfolio companies are not able to pay interest expense in cash and could imply potential credit issues over the coming quarters. The amount of PIK interest income remains around 15.4% (previously 11.7%) of total interest income.
FSK maintained its base dividend of $0.64 per share plus a supplemental dividend of $0.06 per share for a total of $0.70 per share for Q3 2023, which was my previous base case projection in addition to the previously announced special dividend of $0.05 per share.
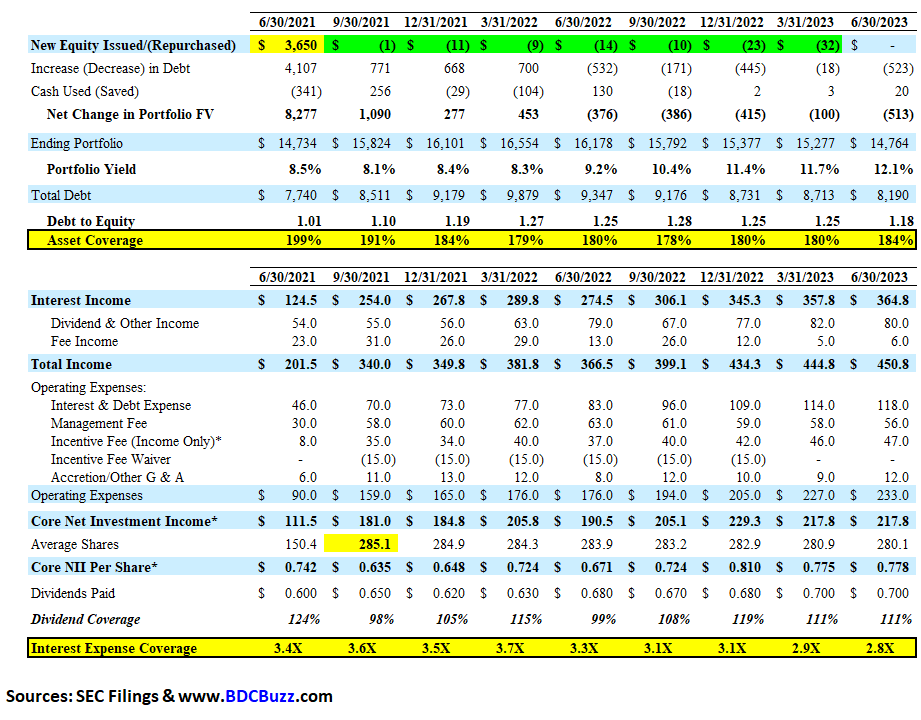
The "Interest Expense Coverage" ratio is used to see how well a company can pay the interest on outstanding debt. Also called the times-interest-earned ratio, this ratio is used by creditors and prospective lenders to assess the risk of lending capital to a firm. A higher coverage ratio is better, although the ideal ratio may vary by industry. When a company's interest coverage ratio is only 1.5 times or lower, its ability to meet interest expenses may be questionable.
The "Asset Coverage Ratio" is a financial metric that measures how well a company can repay its debts by selling or liquidating its assets. The higher the asset coverage ratio, the more times a company can cover its debt. Therefore, a company with a high asset coverage ratio is considered less risky than a company with a low asset coverage ratio. BDCs are required to maintain minimum asset coverage of 150% providing strong protection to bondholders, which is one of the reasons that no publicly-traded BDC has ever filed for bankruptcy nor defaulted on bondholders in the history of the sector.
The following table shows the historical coverage ratios for FSK which are much lower than the ratios for other BDCs (please see previous articles linked above).
FSK Investment-Grade Bonds/Notes
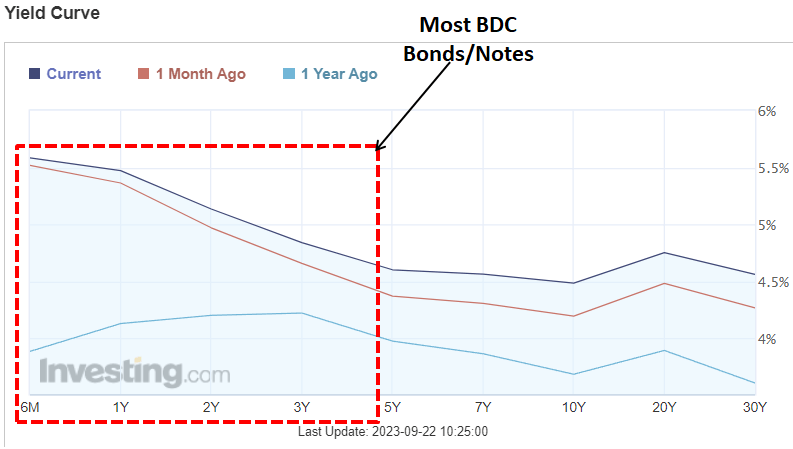
I like BDC bonds partially due to their quality and relatively shorter-term maturities, providing reduced price volatility during market drawdowns, and outperforming other higher-yield assets during market sell-offs. Most BDC bonds mature over the next three to five years which is excellent for investors given the current inverted yield curve (short-term rates higher than longer term).
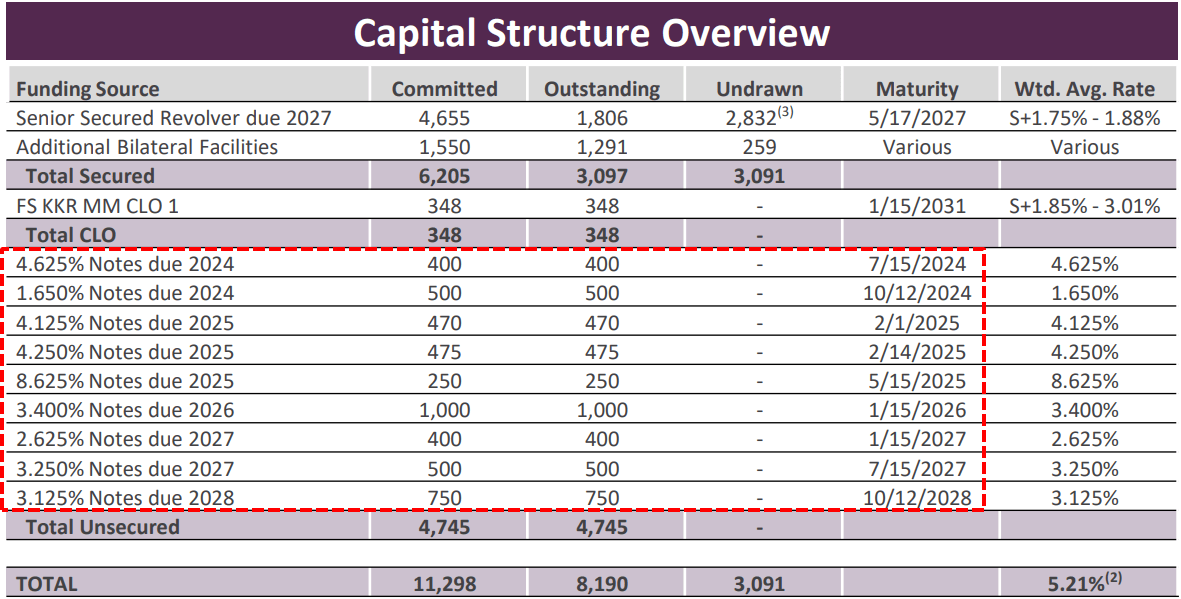
Also, I prefer the bonds/notes (with CUSIPs) to the Baby Bonds (with tickers), mostly related to the "make-whole premiums," which compensate bondholders for the interest they would have earned if their bonds had not been called, or redeemed, by the issuer before the maturity date to ensure that bondholders are receiving fair compensation for the loss of the bond's future coupon payments. FSK has eight investment-grade bonds (CUSIPs: 302635AD9, 302635AJ6, 302635AE7, 30313RAA7, 302635AG2, 302635AH0, 302635AL1, and 302635AK3) that are included in the BDC Google Sheets .
As shown below, the yield-to-maturity ("YTM") for FSK's 2028 bond (CUSIP: 302635AK3) has increased to around 7.5% :
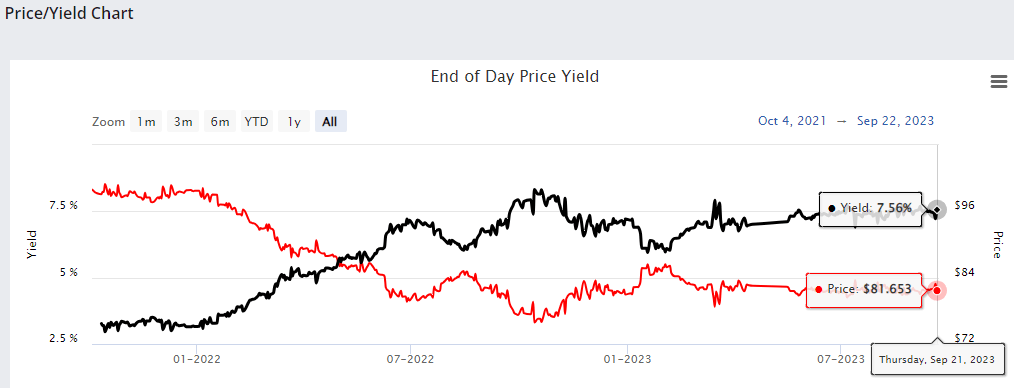
FSK Important Considerations
The following are many of the high-level positive considerations for FSK, some of which are discussed in this article:
- Highest dividend yield in the BDC sector
- Improving dividend coverage without the need for fee waivers
- Potential upgrade if there is improvement in the amount watch list investments
- Previous share repurchases
- Previously increased its quarterly base dividend from $0.61 to $0.64 per share
- Continued supplemental dividends each quarter
- Special distributions totaling $0.15 per share for 2023
- Variable portion of the dividend policy to pay out the excess earnings as rates remain higher and less likely to cut the base dividend if rates/yields trend lower
- Investment grade ratings by Moody's (Baa3) Stable, Fitch (BBB-) Stable & Kroll (BBB)
- Diversified portfolio with 195 portfolio companies
The following are many of the high-level negative considerations for FSK, some of which are discussed in this article:
- The amount of watch list investments remain higher than most BDCs
- $214 million or $0.76 per share of realized losses during Q2 2023, including the exits of its non-accrual investments
- Net realized losses of almost $1 billion or $3.30 per share over the last eight years
- Management removed the "total return" hurdle or "look back" provision that was partially protecting shareholders from additional capital losses
- NAV per share has declined by over 30% over the last five years
- Non-accrual investments remain 2.5% of the total portfolio at fair value
- Recent markdowns of its watch list investments that could potentially be added to non-accrual status
- Its Credit Opportunities Partners (FSK's joint venture) has been continually marked lower
- Relatively lower amounts of first-lien positions
- Lower-than-average historical dividend coverage
- Higher-than-average amounts of non-cash/PIK income
- Reduced its quarterly dividend by 21% in Q2 2020
- Relatively lower amounts of undistributed taxable income ("UTI") due to paying out supplementals but also results in lower excise tax paid (a good thing)
- Lower-than-average total returns to shareholders (dividends paid plus changes NAV per share) over the last five years
Upcoming Articles
Stock market volatility will likely remain elevated, and BDC bonds allow investors to lock in 6% to 9% annualized returns with maturities ranging from one to eight years. Please note that locking in a much safer return is attractive, especially considering the potential for "reinvestment risk" of investing in treasuries/money market funds (if rates go back down eventually).
As mentioned earlier, I will have a series of articles discussing how to build a balanced retirement portfolio using BDC stocks and their safer bonds/notes. The following table shows some examples of allocations and my personal portfolio (again, not exact) with portfolio yields ranging from 5.2% to 9.4%.
The table below uses what I consider to be conservative estimates for annual total returns (dividends plus capital gains) and takes into account current price levels.
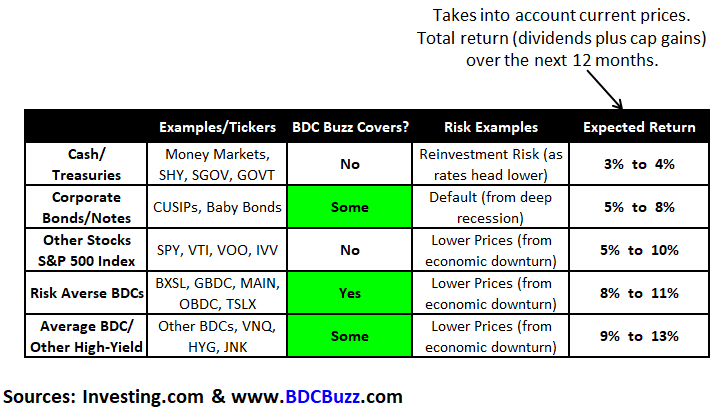
Many other BDCs have tradable Notes, Baby Bonds, and Preferreds including ARCC , BXSL , CCAP , CSWC , FDUS , GAIN , GBDC , GECC , GLAD , GSBD , HRZN , HTGC , NMFC , MFIC , OBDC , OCSL , OFS , OXSQ , PFLT , PNNT , PSEC , RWAY , SAR , SSSS , TCPC , TRIN , TSLX , and WHF . Many of these BDCs have recently issued new bonds/notes providing much higher effective yields earning over 7% to 8% annual cash distributions (paid quarterly) which are much higher than the previous effective yields of 5% to 6%. Each of these bonds has recently been added to the BDC Google Sheets .
For further details see:
FS KKR: 14% Stock Yield Or 8% Bond Yield?