FSK - FS KKR Capital: 20% Discount To Book Value 12.9% Dividend Yield Compensate For Weaknesses
2023-06-12 06:36:15 ET
Summary
- FSK's management fees align with shareholder interests, and its assets are predominantly conservative with a focus on senior secured loans.
- FSK's assets are diversified across industries, with a low cost of liabilities and stable balance sheet leverage.
- The BDC has experienced more NAV volatility in the past, and has exposure to cyclical industries, but its current discount and high dividend yield may compensate for this weakness.
Introduction
A common investing dictum is "beware the sucker yield", however it is all too easy to see a yield and want to wonder if there's something more to be seen behind the ticker symbol. The BDC FS KKR Capital ( FSK ) caught my attention recently with its 12.9% dividend yield, and I couldn't help but wonder about what FSK's insides look like.
FS KKR is an externally managed, non-diversified, closed-end management investment company. FSK's external manager is FS/KKR Advisor LLC.
BDCs are closed end funds that invest in middle market debt, by lending money to companies that are too small to access the bond market but too large for run of the mill small business loans from banks. These loans typically have an attached interest rate of prime plus 2 - 4%. BDCs generally take on a modest amount of debt to lever themselves up, typically a debt to equity ratio of 1. Therefore, a key figure to consider when looking at a BDC is the cost of its liabilities.
There are typically 6 questions I like to ask when I examine a BDC:
- Do the management and incentive fees at FSK align with the interests of shareholders?
- Do FSK's assets predominantly focus on conservatism, emphasizing senior secured debt instruments, preferably with floating rates?
- How has FSK's credit quality performed in recent years?
- Does FSK exhibit extensive diversification across industries, with reduced exposure to cyclical sectors of the economy?
- Is FSK competitive in terms of its debt and leverage costs?
- Are the levels of leverage on FSK's balance sheet relatively close to a debt to equity ratio of 1?
These are the items that I will examine in this article.
Management Fees Aligned With Shareholders
For this section, I will quote relevant small sections of FSK's 2022 10-K Filing, and explain the consequences. I'll also link to my past articles on ARCC and GBDC if you'd like to compare.
Base Management Fee
Pursuant to the investment advisory agreement, the Advisor is entitled to a base management fee calculated at an annual rate of 1.50% of the average weekly value of the Company’s gross assets excluding cash and cash equivalents...
Effective June 15, 2019, in connection with stockholder approval of the modification of the asset coverage requirement applicable to senior securities from 200% to 150%, the Advisor reduced (by permanent waiver) the annual base management fee payable under the investment advisory agreement from 1.5% to 1.0% on all assets financed using leverage over 1.0x debt-to-equity.
The base management fee is 1.5% of gross assets per year. This is typical of BDCs, with GBDC charging 1.375% ( my article here ).
I rather like the step down from 1.5% to 1.0% for assets funded by debt beyond a debt to equity ratio of 1, because this means that more of the reward of taking extra risk with extra leverage goes to the shareholders. This structure is the same as the structure for the base management fee followed by ARCC ( my article here ).
Income Incentive Fee
The prior investment advisory agreement had substantially similar terms as the investment advisory agreement, except that the investment advisory agreement amended the prior investment advisory agreement to
(i) reduce the Company’s income incentive fee rate from 20% to 17.5%; and (ii) remove the total return lookback provision applicable to the subordinated incentive fee on income from the prior investment advisory agreement.
Under the prior investment advisory agreement, the subordinated incentive fee on income was subject to a cap equal to (i) 20.0% of the “per share pre-incentive fee return” for the then-current and eleven preceding calendar quarters
After the base management fee is paid, the next tranche of fees is the income incentive fee, which right now is 17.5% of profits after the base management fee is paid. Notice that there is no step-down provision here, or any structure that bakes in a risk / return target for management to work towards. Considering the amount of risk taken in terms of loan yields in the portfolio, this is roughly in line with other BDCs like ARCC and GBDC.
FSK's management fee structure is generally aligned with shareholder interests, and are largely in line with those of ARCC and GBDC.
Assets Generally Conservative
I will post an excerpt of an exhibit from FSK's 10-K:
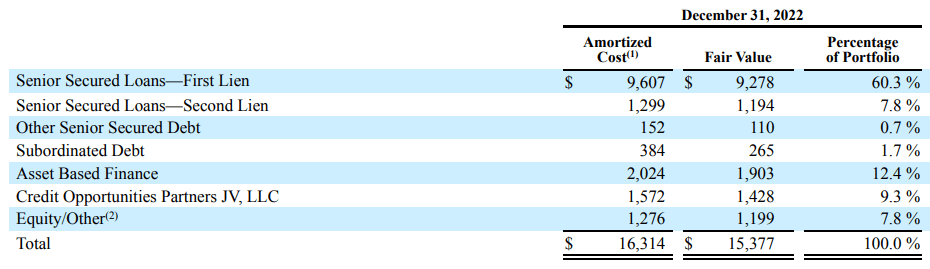
FSK Asset Composition (2022 10-K Filing)
In general, the senior secured loan is the more conservative and lower-risk type of loan for BDCs to invest in. I would take it as a good sign that as of Dec 31, 2022, 68.1% of FSK's portfolio was invested in senior secured loans.
However, possibly due to the recent rate cycle or asset-specific credit performance, the fair value of the portfolio is about 6% lower than the amortized cost of the portfolio across the board. This is a negative brownie point in my book.
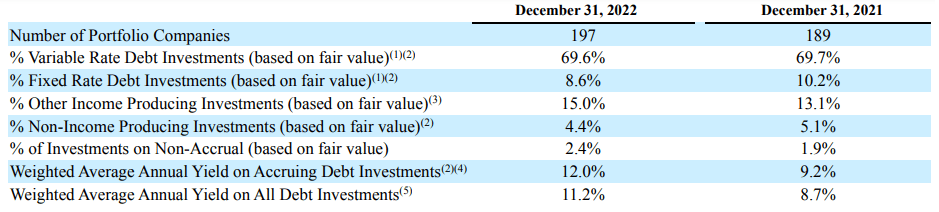
FSK Asset Composition Continued (2022 10-K Filing)
Most of FSK's assets are variable rate, a good sign since variable rate assets tend to have less price volatility relative to interest rate changes. Note that the large jump in the weighted average annual yield reflects the Fed rate-hike cycle that began in 2022.
FSK's assets are formally conservative and largely have floating rates, but have suffered some depreciation relative to their amortized cost.
FSK's Credit Quality & Underwriting
This is where things get a little ugly for FSK. In general, FSK has been able to preserve shareholder capital over a market cycle, but there has been some very substantial NAV volatility along the way:
| Net Realized Unrealized Gain |
| Year End NAV |
| Initial NAV |
| NAV Gain (Loss) Rate |
| 2022 |
| -768 |
| 7012 |
| 7780 |
| -9.87% |
| 2021 |
| 934 |
| 7730 |
| 6796 |
| 13.74% |
| 2020 |
| -736 |
| 3096 |
| 3832 |
| -19.21% |
| 2019 |
| -164 |
| 3866 |
| 4030 |
| -4.07% |
| 2018 |
| 364 |
| 4166 |
| 3802 |
| 9.57% |
| 2017 |
| -22 |
| 2285 |
| 2307 |
| -0.95% |
| 2016 |
| 87 |
| 2297 |
| 2210 |
| 3.94% |
| 2015 |
| -227 |
| 2209 |
| 2436 |
| -9.32% |
| 2014 |
| -47 |
| 2367 |
| 2414 |
| -1.95% |
| 2013 |
| 21 |
| 2641 |
| 2620 |
| 0.80% |
| 2012 |
| 196 |
| 2512 |
| 2316 |
| 8.46% |
| 2011 |
| -18 |
| 1499 |
| 1517 |
| -1.19% |
| Average: |
| -0.84% |
The fluctuations in NAV in 2020 (when BDCs generally booked large amounts of unrealized losses) and in 2021 (when BDCs booked recoveries) are quite large compared with those figures for the BDCs I've analyzed before, GBDC and ARCC:
| NAV Gain / Loss Rate |
| FSK |
| GBDC |
| ARCC |
| 2022 |
| -9.87% |
| -1.63% |
| -4.67% |
| 2021 |
| 13.74% |
| 6.70% |
| 9.80% |
| 2020 |
| -19.21% |
| -3.51% |
| -4,32% |
The reasons for this extra volatility have been rather unclear - perhaps it is due to different fair value computation methods or standards across the three companies.
In general though, the -0.84%/year NAV depreciation on average is worse off performance than that of ARCC and GBDC, so this is a negative brownie point in my book. However, the market does trade FSK at a substantial discount to NAV compared to ARCC and GBDC to compensate:
On the whole, I would not say that FSK is capable of preserving shareholder capital over an earnings cycle, however the extra dividend yield and current discount to book value may compensate for this weakness.
Diversified Across Industries
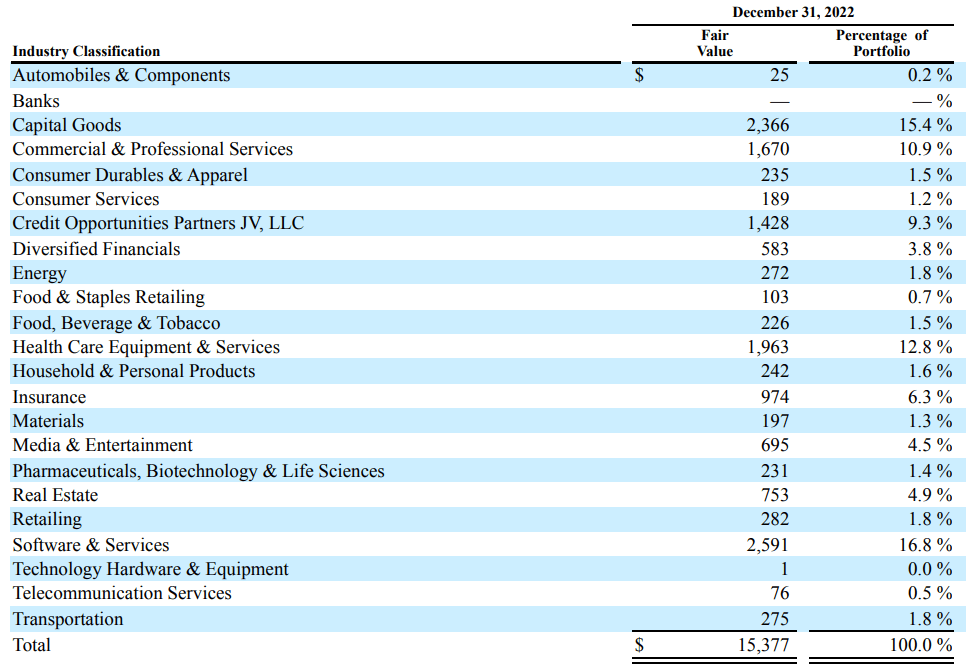
FSK Diversification Across Industries (2022 10-K Filing)
A good sign in a BDC is wide diversification across industries, and in particular diversification away from cyclical sectors such as oil & gas. This is because we don't want there to exist clusters of exposure to single industries that could cause the associated loans to underperform.
In FSK's case, there is generally a wide diversification, however some segments raise red flags for me, in particular the Capital Goods, Energy, Materials, and Real Estate sectors. These could be areas of weakness in future downturns.
FSK is largely diversified across industries, but there exists some exposure to cyclical industries.
Low Cost Of Liabilities
BDCs with low costs of liabilities can pass on those savings to shareholders. I have included the AAA bond yield as a benchmark for just how low a BDC's cost of liabilities can go.
Figures in millions:
| Interest Expense |
| Total Liabilities |
| Cost Of Liabilities |
| AAA Bond Yield |
| 2015 |
| 75.1 |
| 1939.2 |
| 3.87% |
| 3.89% |
| 2016 |
| 74 |
| 1812.7 |
| 4.08% |
| 3.67% |
| 2017 |
| 79 |
| 1819 |
| 4.34% |
| 3.74% |
| 2018 |
| 84 |
| 3539 |
| 2.37% |
| 3.93% |
| 2019 |
| 170 |
| 4350 |
| 3.91% |
| 3.39% |
| 2020 |
| 170 |
| 4141 |
| 4.11% |
| 2.48% |
| 2021 |
| 231 |
| 9498 |
| 2.43% |
| 2.70% |
| 2022 |
| 365 |
| 9112 |
| 4.01% |
| 4.07% |
Over the past few years, FSK's cost of liabilities has been comparable to the AAA bond yield, a good sign, suggesting that there is little room for cost trimmings left.
Balance Sheet Leverage Is Stable
The debt to equity ratio is a fundamentally important ratio for BDCs, as it can have a magnifying effect on asset losses to NAV losses in terms of credit performance. In 2019, BDCs were legally allowed to reach a debt-to-equity ratio of 2 (prior to which the legal limit was 1), and many BDC managements took advantage of the development to raise the amount of leverage their BDCs employed.
| Total Liabilities |
| Total NAV |
| Debt To Equity Ratio |
| 2022 |
| 9112 |
| 7012 |
| 1.299487 |
| 2021 |
| 9498 |
| 7730 |
| 1.228719 |
| 2020 |
| 4141 |
| 3096 |
| 1.337532 |
| 2019 |
| 4350 |
| 3866 |
| 1.125194 |
| 2018 |
| 3539 |
| 4166 |
| 0.849496 |
| 2017 |
| 1819 |
| 2285 |
| 0.796061 |
| 2016 |
| 1812.7 |
| 2297 |
| 0.78916 |
| 2015 |
| 1939.2 |
| 2209 |
| 0.877863 |
FSK is no exception to this development, raising its leverage level to a debt to equity ratio of 1.3. However, it has stabilized at about 1.3 over the past 3 years, indicating that management is not seeking to maximize leverage (and risk).
Conclusions
- FSK's management fees are largely aligned with shareholder interests.
- FSK has seen more volatility in its NAV depreciation / appreciation in the past, which is a negative brownie point for long term income investors. However, it does trade at a discount and sport a higher than usual dividend yield, which is the market's compensation.
- Assets are generally invested in conservative senior secured loans, but the overall portfolio has suffered a little depreciation relative to amortized cost.
- The assets are generally widely diversified, but there do exist large pockets of exposure to cyclical industries.
- FSK exhibits a low cost of liabilities, in line with the AAA bond yield.
On the whole, I personally would prefer to own ARCC over FSK, but those who invest in FSK can know that the market has priced shares at a roughly 20% discount to NAV, and at a dividend yield of ~12.9% as a way of accounting for weaknesses in FSK's profile as a BDC.
For further details see:
FS KKR Capital: 20% Discount To Book Value, 12.9% Dividend Yield Compensate For Weaknesses