FTHI - FTHI: 8.8% Yield Likely To Revert To The Mean
2023-05-10 12:02:09 ET
Summary
- First Trust BuyWrite Income ETF has a portfolio of 200+ stocks and generates income by selling call options on the S&P 500 index.
- Valuation metrics are better than for the benchmark.
- Historical return is consistent with competitors, but underwhelming relative to the S&P 500.
- The current distribution yield is an outlier; it may go down to the historical average.
- Inflation-adjusted price is in 2-digit loss since inception.
This article series aims at evaluating ETFs (exchange-traded funds) regarding the relative past performance of their strategies and metrics of their current portfolios. Reviews with updated data are posted when necessary.
FTHI strategy and portfolio
First Trust BuyWrite Income ETF ( FTHI ) is an actively managed fund launched on 1/6/2014. It holds a portfolio of 203 stocks and 8 call options on the S&P 500 index. The 12-month distribution rate is 8.79% and the total expense ratio is 0.85%. It pays monthly distributions.
As described by First Trust , “ The Fund's primary investment objective is to provide current income. The Fund's secondary investment objective is to provide capital appreciation. ” The fund invests in stocks listed on U.S. exchanges and sells call options on the S&P 500 Index to collect premiums that may be distributed to shareholders. The market value of the option strategy may be up to 20% of the fund's net asset value. As of writing, held options expire in May and June with strike prices between SPX 3950 and 4125.
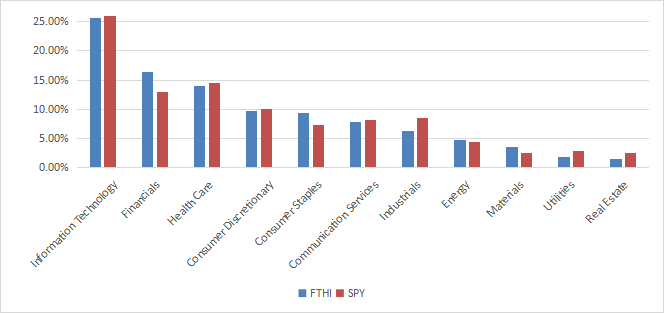
FTHI invests mostly in U.S.-based companies (93% of asset value). The sector breakdown is very close to the S&P 500, as plotted on the next chart. Compared with the broad index, the fund overweights mostly financials, consumer staples and materials. It underweights industrials, real estate and utilities.
Sector breakdown (Chart: author; data: First Trust, SSGA)
FTHI is cheaper than SPY regarding the usual valuation ratios, as reported in the next table.
| FTHI |
| SPY |
| Price/earnings TTM |
| 16.97 |
| 21.21 |
| Price/book |
| 3.09 |
| 3.77 |
| Price/sales |
| 2.06 |
| 2.4 |
| Price/cash flow |
| 11.44 |
| 15.29 |
Data: Fidelity
The top 10 companies, listed below with fundamental metrics, represent 29.8% of asset value. For convenience, the two stock series of Alphabet are grouped in the same line of the table. The top two holdings, Apple and Microsoft, weigh about 14% together. Risks related to other individual companies are low to moderate.
| Ticker |
| Name |
| Weight |
| EPS growth %TTM |
| P/E TTM |
| P/E fwd |
| Yield% |
| Apple, Inc. |
| 7.46% |
| -4.33 |
| 29.18 |
| 28.80 |
| 0.56 |
| Microsoft Corp. |
| 6.76% |
| -3.75 |
| 33.28 |
| 31.95 |
| 0.89 |
| Alphabet, Inc. |
| 3.47% |
| -19.87 |
| 24.24 |
| 19.99 |
| 0 |
| Amazon.com, Inc. |
| 2.77% |
| -80.11 |
| 258.60 |
| 68.21 |
| 0 |
| NVIDIA Corp. |
| 2.09% |
| -54.71 |
| 164.07 |
| 62.84 |
| 0.06 |
| Berkshire Hathaway, Inc. |
| 1.71% |
| -90.67 |
| 93.66 |
| 21.02 |
| 0 |
| Meta Platforms, Inc. |
| 1.42% |
| -39.04 |
| 28.95 |
| 20.00 |
| 0 |
| UnitedHealth Group, Inc. |
| 1.42% |
| 19.66 |
| 22.43 |
| 19.63 |
| 1.35 |
| Unilever PLC |
| 1.39% |
| 12.32 |
| 17.73 |
| 19.47 |
| 3.25 |
| Tesla, Inc. |
| 1.34% |
| 38.35 |
| 49.77 |
| 50.28 |
| 0 |
Historical performance
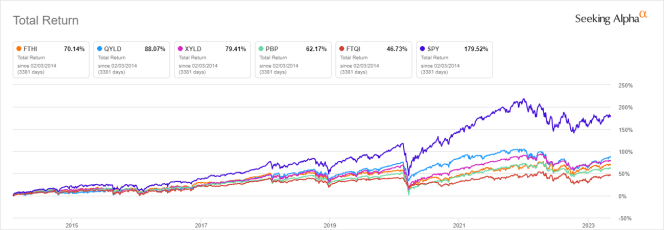
The next chart plots total returns since February 2014 of FTHI, the S&P 500 index ( SPY ) and four other ETFs implementing buy-write strategies (buying stocks and selling call options):
- Global X NASDAQ 100 Covered Call ETF ( QYLD ),
- Global X S&P 500 Covered Call ETF ( XYLD ),
- Invesco S&P 500 BuyWrite ETF ( PBP ),
- First Trust Nasdaq BuyWrite Income ETF ( FTQI ).
FTHI vs competitors and SPY since 2014 (Seeking Alpha)
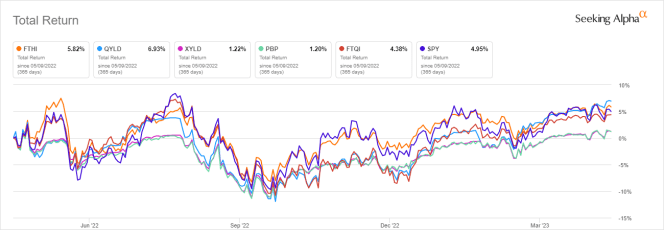
Compared to competitors, FTHI is in the middle of the pack. The five buy-write ETFs have lagged the S&P 500 by a wide margin. However, in the last 12 months, FTHI is on par with SPY (next chart).
FTHI vs competitors and SPY, last 12 months (Seeking Alpha)
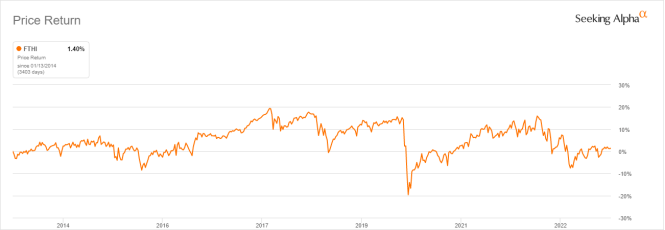
The chart below plots FTHI share price since inception: it is close to break-even (+1.4% in 9 years). In the same time, the cumulative inflation has been about 28%, based on CPI. This represents a significant loss in inflation-adjusted value.
FTHI share price without dividends (Seeking Alpha)
A buy-write strategy's results may vary depending on market conditions. It seems the management tries to keep distributions as constant as possible: they have been stable at about $0.08 per month between 2015 and 2021. Then, they jumped to an average of $0.15 in 2022. However, based on historical data, last year looks like an outlier, and an 8%+ yield is unlikely to be sustainable in the long run. If the management decides to maintain this rate, it may come with some return of capital.
FTHI distribution history (Seeking Alpha)
Takeaway
First Trust BuyWrite Income ETF has a portfolio of 200+ stocks with a sector breakdown close to the S&P 500. It seeks to generate income by selling short-term call options on the large cap index. The fund is in the middle of the pack when compared to competitors. It has lagged the S&P 500 by far since inception, but did a bit better in the last 12 months. The fund has fulfilled its primary objective of providing income, but the current trailing yield of 8.8% is an outlier. Things are more complicated regarding the secondary objective of capital appreciation. The fund has not suffered from capital decay since inception, but it has been unable to keep pace with inflation.
Bonus: how to keep pace with inflation
Many high yield ETFs and closed-end funds suffer from capital and income decay in inflation-adjusted value. However, it may be avoided or mitigated by rotational strategies. I designed a 5-factor ranking system in 2016, and monitored its performance during several years. I started publishing the eight best ranked CEFs in Quantitative Risk & Value ((QRV)) after the March 2020 meltdown. The list is updated every week. It isn’t a model portfolio: trading the list every week is too costly in spreads and slippage. Its purpose is helping investors find funds with a good entry point. In the table below, I give the hypothetical example of starting a portfolio on 3/25/2020 with my initial “Best 8 Ranked CEFs” list and updating it every 3 months, ignoring intermediate updates. Return is calculated with holdings in equal weight and reinvesting dividends at the beginning of every 3-month period.
| since 3/25/2020 |
| Total Return |
| Annual Return |
| Drawdown |
| Sharpe ratio |
| Volatility |
| Best 8 CEFs quarterly |
| 124.06% |
| 29.73% |
| -20.60% |
| 1.27 |
| 20.14% |
| YYY |
| 12.86% |
| 3.98% |
| -22.87% |
| 0.24 |
| 11.91% |
| SPY |
| 76.43% |
| 20.11% |
| -24.50% |
| 0.93 |
| 18.95% |
This simulation is not a real portfolio and not a guarantee of future return
Of course, past performance (real or simulated) is not representative of future return. However, I think a time-tested rotational strategy in CEFs has a much better chance to protect both capital and income stream against erosion and inflation than a high-yield ETF.
For further details see:
FTHI: 8.8% Yield Likely To Revert To The Mean