FUND - FUND: Looking More Tempting As Discount Widens But Not A Bargain Yet
2024-01-02 23:20:28 ET
Summary
- Sprott Focus Trust has a unique tilt towards the materials sector, with significant holdings in energy and financial services as well.
- The fund's discount has widened, making it relatively attractive on a shorter-term relative basis, but on a longer-term basis, it looks to be relatively fairly valued.
- FUND pays out a quarterly distribution based on 6% of its NAV, with net investment income coverage moving materially higher in the latest report.
Written by Nick Ackerman, co-produced by Stanford Chemist.
The closed-end fund space, thanks to its unique structural advantages and active management, can often lead to some interesting funds that can get rather niche. Sprott Focus Trust ( FUND ), with perhaps the greatest ticker in the fund space of all time, is one of those funds. While it is a somewhat diversified fund that allows flexibility for its manager to invest just about anywhere, the fund has taken a unique tilt toward the materials sector in a 'material' weighting. Following that overweight sleeve, the fund has also positioned itself fairly heavily in the energy and financial services sectors.
We covered the fund earlier this year , and it was positioned similarly at that time as well. The fund has also been about flat since our earlier coverage and, on a total return basis, has provided a slightly positive return. That said, the fund's discount has widened meaningfully, helping to keep both of these metrics more muted and making the fund more relatively attractive on a valuation basis.
FUND Performance Since Prior Update (Sprott)
Despite this widening discount, the fund still only looks like a 'Hold' based on its historical range but is getting closer to a more tempting play.
FUND Basics
- 1-Year Z-score: -2.12
- Discount: -10.23%
- Distribution Yield: 6.43%
- Expense Ratio: 1.14%
- Leverage: N/A
- Managed Assets: $245.7 million
- Structure: Perpetual
FUND seeks to "deliver superior performance to investors by investing with a long time horizon in high-quality businesses with strong balance sheets that are trading at attractive valuations." The fund has no limit in terms of the market cap of the underlying portfolio. The average market cap weighting of their underlying holdings comes to around $3.09 billion, down from $3.43 billion earlier this year. That would tilt the portfolio to the lower end of the mid-cap range ($2 to $10 billion.)
FUND is quite small in terms of total managed assets, so liquidity could be an issue for larger investors. Despite being a smaller fund, the expense ratio is fairly average for a CEF. The fund employs no leverage in terms of borrowings, which can be a positive as relatively smaller and cyclical companies that they often invest in can be volatile enough.
Performance - Discount Widens
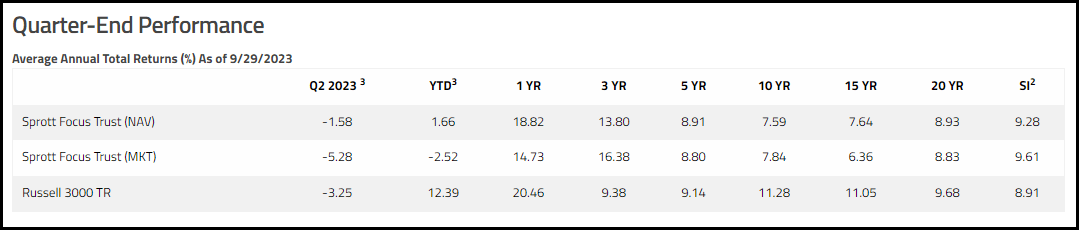
The fund benchmarks itself against the Russell 3000 Total Return Index, and results against that benchmark have been mixed, with some periods showing strong total returns and others are lagging results.
That being said, the Russell 3000 is used as a broad measurement, trying to capture the entire U.S. equity market performance. Therefore, there are material differences between that index and FUND. In this case, it seems more to provide some relevant context rather than an actual benchmark they are necessarily trying to compete with directly.
Similar to the 'problem' with the S&P 500 Index with concentration, FUND's manager also mentioned just how narrow the Russell 3000 Index has become. They noted that 30 names out of the ~3000 came to a 40% weight.
If one looks further into the market’s concentration, the top 1% of all stocks in the Russell 3000 Index (30 names) comprise more than 40% of its weight. For reference, while there is no equal weight calculation for the Russell 3000 Index, the Russell 2000 Index equal weight return was 3.11% and the Russell 1000 equal weight return was 5.28% in the first half of 2023. It has been 50 years since so few securities have been so dominant. In the spring of 1973, five stocks also made up 24% of the S&P 500 Index. AT&T, Eastman Kodak, Exxon, General Motors and IBM were one decision investments by the end of an era known as the Nifty Fifty. What followed soon after was a vicious bear market in 1973 through 1974. While we are hopeful that the current imbalances will work themselves out through a broadening of the equity bull market, we are mindful of the less pleasant lessons of history.
With that being said, one thing an index can't provide (besides literally not being investible directly but generally having to invest via ETF) is a discount that FUND presents to investors. On this front, the fund is showing a negative 1-year z-score of greater than 2, which is often a sign that it could be looking like a good deal.
However, it's merely closing in on its longer-term decade-long average. It's simply that in more recent years, it appears the discount was the anomaly, but a 10% discount would be the appropriate level that it trades at. In fact, running closer to a 15% discount would probably make more sense if we took out the outlier period of the unusually narrow discount.
Ycharts
Of course, if one is more optimistic about the commodities space going forward, this discount could be argued to be attractive enough. The stronger performance of commodities could trump investors willing to be patient to wait for a better deal in terms of the fund's discount.
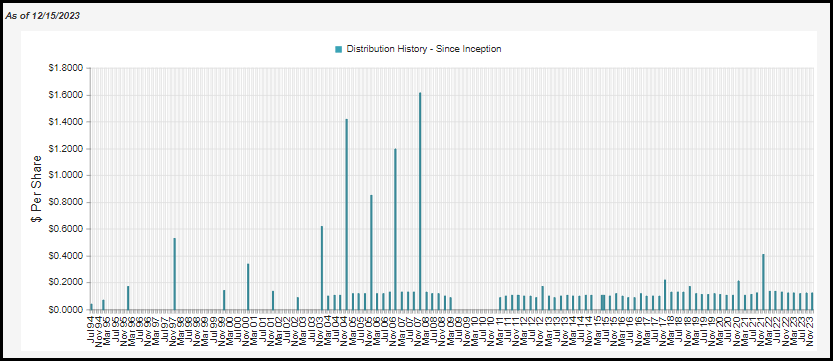
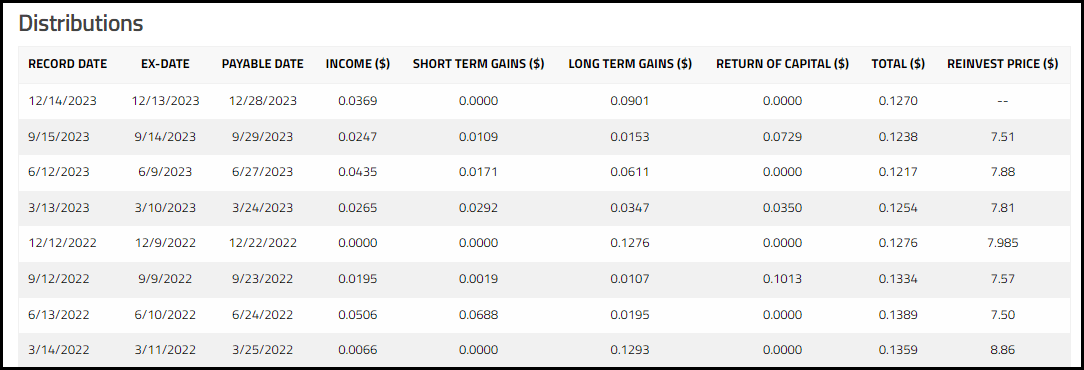
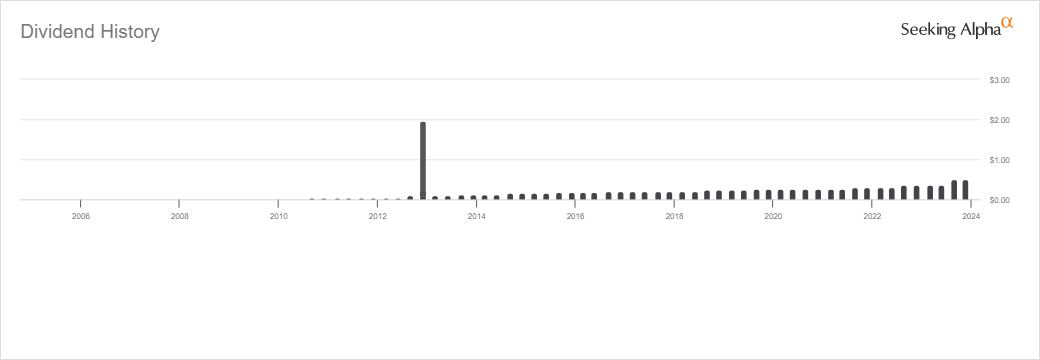
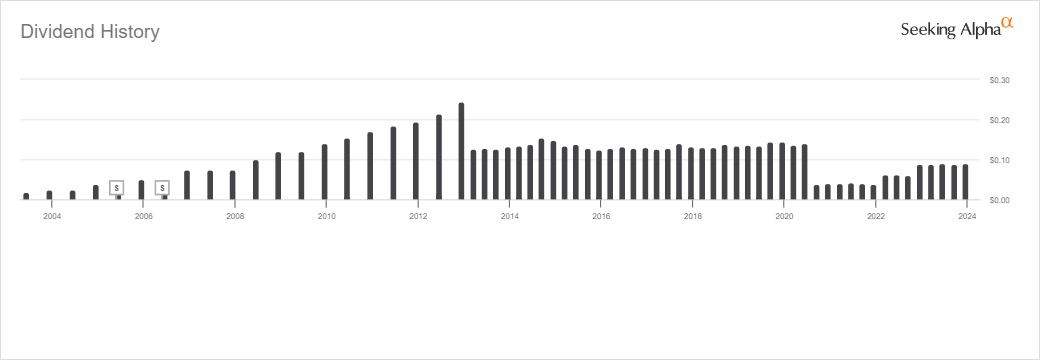
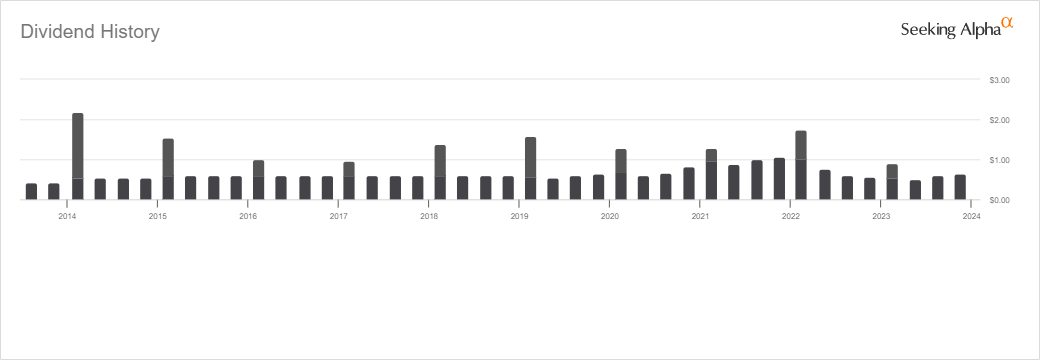
Distribution - 6% Managed Rate
The fund pays out a quarterly distribution, which would appear to be variable at first. However, it is quite predictable because it is based on 6% of the fund's NAV paid out at 1.5% each quarter.
Some investors prefer level distributions, but with a managed distribution policy, especially one that resets quarterly, NAV can be preserved if the fund is not doing well. That can allow more assets to be retained inside the fund to rebound with whenever a market recovery in the space comes along.
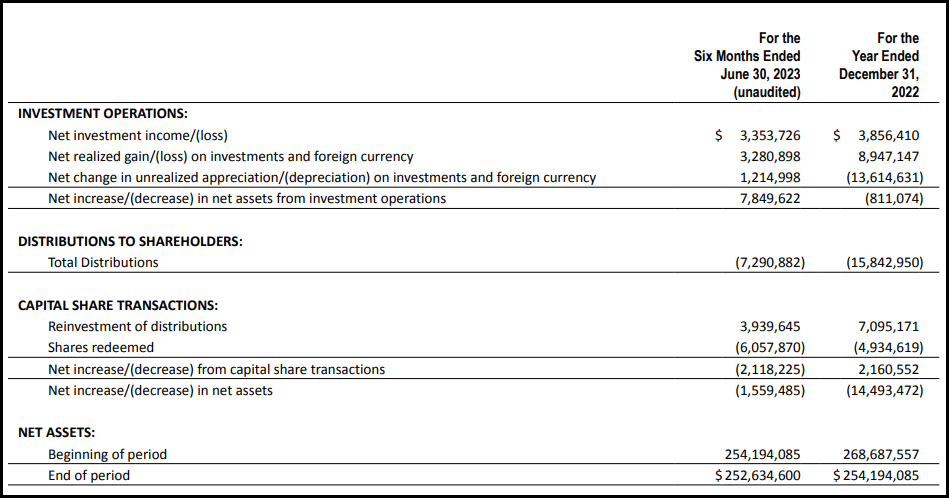
In the latest semi-annual report, while the fund is still relying significantly on capital gains to fund its distribution, just as most equity funds do, net investment income climbed materially. That helped to push NII coverage to around 46% in their latest report, up from 24.3% previously.
NII can be important because it's often going to be the more regular recurring distribution coverage a fund can have. It's simply the dividends and interest received from the underlying holdings, assuming most companies tend to try to keep their dividends steady, the income stream can be fairly steady. This is the case for several of FUND's largest holdings.
On a per-share basis, the entire 2022 year showed NII per share of $0.13. In this six-month period above, the per share NII came out to $0.11. So not quite double the NII generated for the entire year previously but quite close to potentially doubling if this latest figure was annualized.
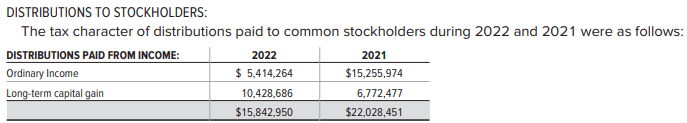
We previously discussed the fund's distribution tax classifications for the prior years.
The distribution tax classifications for the fund in the last two years showed a big difference. [Relative to the fund's NII and capital gains generated.]
Generally, we'd expect long-term capital gains representing most of the tax classifications. In 2021, ordinary income was a large portion of the distribution to shareholders. If you are a tax-sensitive investor, that could have come with a bit of a shock if holding in a taxable account.
The official breakdown for 2023 should be available before too long as we enter 2024. That being said, the fund is estimating some return of capital in its distribution this year. That doesn't always mean there will be once the official breakdown is known; after all, they listed some that would be included in 2022, and the above figures differ.
FUND's Portfolio
The turnover for this fund has been fairly low, coming in at an annualized 13.63% for 2023. That puts it on pace to be below 2022, 2021 and 2020, which came in at 20%, 22% and 30%, respectively. Therefore, we've seen fewer changes this year compared to prior years, but the prior years weren't particularly active ones either. They listed the trailing annual turnover at 11.82% at the end of September 2023, so it has since been even less active relative to prior years.
With that, we haven't seen too much in terms of sector weighting changes since our prior update. The fund still favors the materials sector at a 35.4% weight, followed by energy at 17.4%, financials at 14.9%, and then real estate at an 8.5% allocation. Consumer discretionary comes in at 6.3% and tech at 5.1%, with cash, industrials and consumer staples making up the remainder at all allocations of less than 4.5%.
FUND Sector Allocation (Sprott)
Suffice it to say, this is definitely a value-oriented portfolio, with growth sectors such as tech having a fairly immaterial weight. The average P/E of 9.86x for the fund further reinforces that this is the case. That is up from the 9.48x the fund had listed as the weighted average P/E previously.
FUND Portfolio Stats (Sprott)
In total, the fund lists 34 holdings, with 19 of those holdings being greater than 75% of the invested portfolio. A smaller number of holdings means the manager can often have an easier time outperforming - assuming they are invested correctly. The other side of this is that the managers also have a higher chance of underperforming due to only a few positions being relatively weaker, which can really drag down the results.
That being said, despite such few holdings, in looking at the top ten holdings, we aren't necessarily significantly overweight one holding or another. At least on that basis, the risk of concentration here is more evenly split across its fairly narrow basket of holdings.
FUND Top Ten Holdings (Sprott)
Similar to not seeing a material change in the fund's sector allocation, we naturally see that several of these largest holdings were the same as last time. Though with fairly close weightings, it also doesn't take much in terms of one appreciating over the other to see some gyrations amongst these names. Westlake Corp ( WLK ), for example, was the third largest holding but moved up to the largest holding after it went from a 4.7% to 4.8% weighting.
WLK is one of the fund's material sector holdings and is in the commodity chemicals sector. The company "manufactures and markets performance and essential materials, and housing and infrastructure products" around the world. The company is based in Texas, and the share price has been performing well - which is likely why it saw it climb to the largest holding.
This is also representative of one of the companies that would have helped drive FUND's NII; the dividend for WLK was lifted for the last 19 years. In fact, when we get the next fund report, this will be a particularly strong driver of FUND's NII if they remain in the portfolio. In August of this year, the company lifted its dividend by 40%.
Pason Systems ( OTCPK:PSYTF ) is another name in the fund's portfolio that has seen its dividend increase in the last couple of years. However, they did cut in 2020. Pason Systems is also a Canadian company paying in CAD that gets converted to USD. This is an energy company that provides "data management systems for drilling rigs in Canada."
From there, we have a name such as Artisan Partners Asset Management ( APAM ) that doesn't have a steady dividend. Instead, the company pays a variable dividend plus regular specials that also make it hard to predict. That being said, APAM has seen its dividend increase in the last several quarters. That would have helped drive NII for FUND as well.
Finally, on the dividend front, it could certainly be worth pointing out that the fund holds a position in Berkshire Hathaway ( BRK.B ) in its top ten. Similar to APAM, this would be a position in the fund's financial sector sleeve. Of course, Berkshire pays no dividend at all to its investors. That doesn't mean that it can't still contribute to FUND's distribution - it just comes in the form of potential capital gains rather than a steady flow of cash.
Conclusion
FUND's portfolio hasn't changed materially since we took a look at it earlier this year. However, the fund's discount did widen out fairly materially, and that certainly makes it a more compelling buy at these levels. On the other hand, it still is running only around its historical average discount with periods where it regularly traded below the current discount level. This was the result of the fund experiencing a very narrow discount through the end of 2021 and through a portion of 2022. With that being the case, it looks about fairly valued here or even slightly overvalued. The argument against this would be if one believes that the commodity space is set to perform well going forward, then even an average discount could be compelling enough.
For further details see:
FUND: Looking More Tempting As Discount Widens, But Not A Bargain Yet