FUTY - FUTY Can Be Vulnerable In A Broader Market Selloff
2023-03-13 03:40:15 ET
Summary
- FUTY invests in large-cap utility stocks in the United States.
- Stocks in FUTY’s portfolio have a slower growth profile than the S&P 500 index.
- The fund still has significant downside risk in a market downturn.
ETF Overview
Utilities sector is often perceived as a defensive sector amid a recession. It has indeed performed better than the broader market last year. However, will this trend continue in 2023? We will analyze Fidelity MSCI Utilities Index ETF ( FUTY ) to find out if this sector is really a better choice to own in the possible upcoming recession. We previously covered FUTY in 2020.
FUTY has a portfolio of mostly large-cap utility stocks in the United States. Although it still delivered a negative return since the beginning of 2022, its loss was significantly less than the broader market. However, its valuation is only fair and its fund price can be vulnerable if the economy falls into a recession. Therefore, we think investors may want to patiently wait on the sidelines.
YCharts
Fund Analysis
FUTY "outperformed" the broader market in 2022
Last year was a brutal year for the broader market. Many funds and stocks suffered tremendous decline in the past year. However, the utilities sector has performed better than the broader market. As can be seen from the chart below, FUTY has delivered a total loss of only about 7.22% since the beginning of 2022. This was much better than the total loss of 17.43% of the S&P 500 index.
YCharts
But its performance still trails the S&P 500 index in the long run
Despite FUTY's better performance in a bear market last year, it has trailed the S&P 500 index significantly in the long run. As can be seen from the chart below, its total return of 123.8% since its inception in late 2013 was much lower than the 164.6% of the SPDR S&P 500 ETF ( SPY ) which tracks the S&P 500 index.
YCharts
Slower growth profile than the S&P 500 was the reason
This underperformance in the long run was not difficult to grasp as utility stocks generally have a slower growth profile than the broader market. As the table below shows, stocks in FUTY's portfolio have an average sales growth rate of only about 6.78%. This rate is only 60% of the average growth rate of the stocks in the S&P 500 index. Likewise, FUTY's book value growth rate of 2.25% was less than half of the S&P 500's average book value growth rate of 4.66%. No wonder FUTY trailed the S&P 500 index significantly in the long run.
| FUTY |
| S&P 500 |
| Sales Growth (%) |
| 6.78% |
| 11.41% |
| Book Value Growth (%) |
| 2.25% |
| 4.66% |
Source: Morningstar
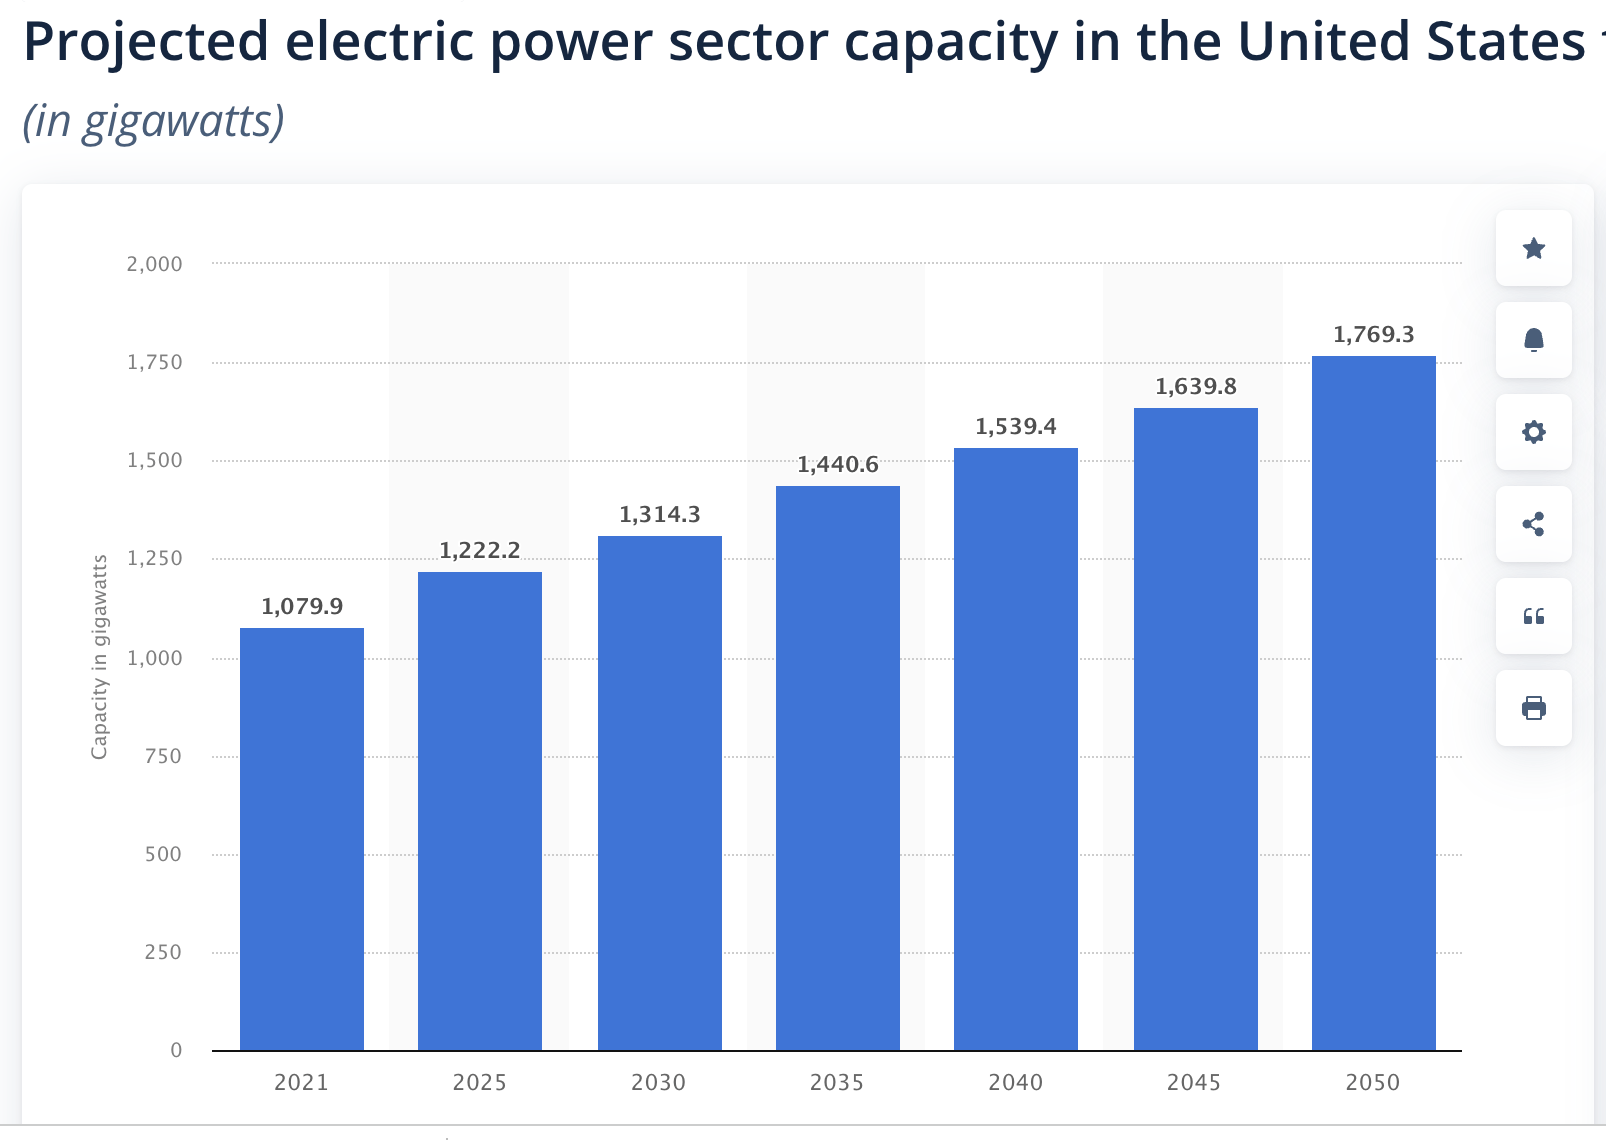
Since electric utility is one of the major components of utility stocks' revenue, we will also take a look at its projected growth rate to better understand this sector's growth profile. One indicator we look at is the projected electric power sector capacity. As can be seen from the chart below, the projected electric power sector capacity in the United States is expected to grow from 1,079.9 gigawatts in 2021 to 1,769.3 gigawatts in 2050. While this growth rate over 60% may sound a lot, but the growth spans nearly 30 years. This means the average growth rate per year is only in the low single digit. Therefore, growth appears to be weak.
Fair Valuation
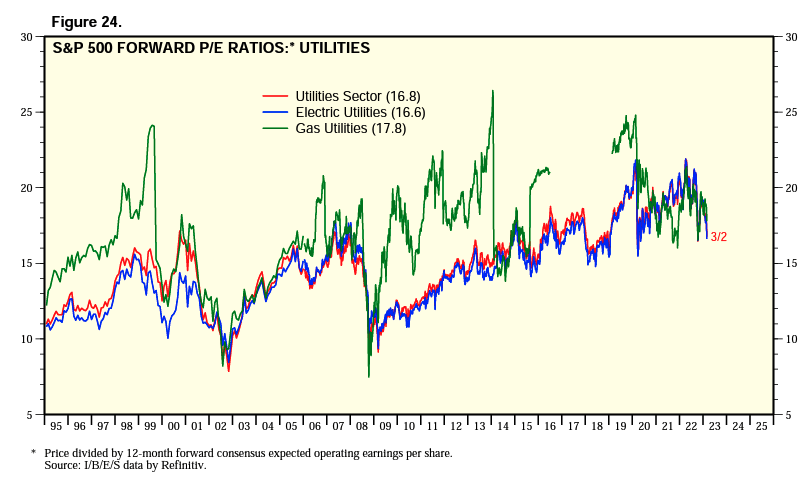
Let us now take a look at FUTY's valuation. Since we do not have the historical average of FUTY's valuation, we will observe the trend of the average valuation of the utility stocks in the S&P 500 index. As can be seen from the chart below, utilities sector in the S&P 500 has an average forward P/E ratio of 16.8x. While this valuation has come down from the cyclical peak of 22x reached in 2022, it is still towards the high end of the historical range since 1995. In previous recessions, this forward P/E ratio has dropped to as low as below 10x in the Great Recession in 2008/2009 and in the aftermath of the Internet-dot-com bubble. Even in the midst of the global pandemic in 2020, the forward P/E ratio of the utilities sector was below 15x. Therefore, FUTY is not currently trading at a discount. Its valuation is only fair.
However, significant downside risk remains
Since the Federal Reserve is expected to set the rate "higher and longer," the economy may eventually be tipped over to a recession. As soon as recession fear mounts, a massive stock market selloff may occur. Therefore, it is important to analyze FUTY's downside risk. As can be seen from the chart below, FUTY's fund price declined by nearly 40% in the recession triggered by the global pandemic in 2020. Although we do not have FUTY's performance in the Great Recessions, we can observe how its peer fund, Utilities Select Sector SPDR ETF ( XLU ) performed during that time. As can be seen from the chart, XLU suffered a decline of slightly over 40% in the 2008/2009 recession. While utilities sector may be perceived as a defensive sector, it can still be a victim in major market selloffs such as in the Great Recession and the global pandemic in 2020.
YCharts
Investor Takeaway
While FUTY may be perceived as a good defensive choice amid a recession, it can still be quite vulnerable in a broader market selloff. Given its weaker growth profile and a valuation that is only fair right now, we think investors should wait on the sidelines.
For further details see:
FUTY Can Be Vulnerable In A Broader Market Selloff