VTV - FVAL: Large-Cap Value ETF Outperforming Its Peers
2023-11-09 16:44:53 ET
Summary
- Fidelity® Value Factor ETF is a large cap value fund with a portfolio of 128 stocks and a total expense ratio of 0.29%.
- It is very close to the S&P 500 regarding the sector breakdown, whereas value funds usually overweigh financials.
- The FVAL ETF has outperformed its competitors in both 5-year and year-to-date total return, likely thanks to a sophisticated value score calculation.
This article series aims at evaluating exchange-traded funds (ETFs) regarding the relative past performance of their strategies and metrics of their current portfolios. As holdings change over time, updated reviews are posted from time to time.
FVAL strategy and portfolio
Fidelity® Value Factor ETF ( FVAL ) is a large-cap value ETF with a portfolio of 128 stocks, a total expense ratio of 0.29% and a trailing 12-month distribution yield of 1.71%. Distributions are paid quarterly. It started investing operations on 09/12/2016 and tracks the Fidelity U.S. Value Factor Index.
According to Fidelity, the underlying index “ is designed to reflect the performance of stocks of large and mid-capitalization U.S. companies that have attractive valuations ”. It is based on a score combining four factors in equal weight:
- Free Cash Flow Yield
- EBITDA to Enterprise Value
- Tangible Book Value to Price
- Forward Estimated 12-month Earnings to Price.
For the banking industry, only the last two factors above are taken into account.
The portfolio turnover rate in the most recent fiscal year was 43%. FVAL invests exclusively in U.S. companies and mostly in the large cap segment (75% of asset value). As expected, FVAL is much cheaper than the S&P 500 index SP500) regarding the usual valuation ratios:
| FVAL |
| SPY |
| Price / Earnings TTM |
| 15.1 |
| 20.79 |
| Price / Book |
| 2.52 |
| 3.69 |
| Price / Sales |
| 1.33 |
| 2.38 |
| Price / Cash Flow |
| 9.84 |
| 14.73 |
Source: Fidelity.
The sector breakdown is very close to the large cap benchmark, keeping technology in first position.
FVAL sector breakdown (Chart: author; data: Fidelity, SSGA)
The top 10 holdings, listed in the next table with valuation ratios, represent 33.5% of asset value. The weight of each of the top two names, Apple and Microsoft, is over 7%. Risks related to other individual companies are moderate.
| Ticker |
| Name |
| Weight (%) |
| P/E TTM |
| P/E fwd |
| P/Sales TTM |
| P/Book |
| P/Net Free CashFlow |
| Yield% |
| Microsoft Corp. |
| 7.41 |
| 35.17 |
| 32.30 |
| 12.41 |
| 12.28 |
| 63.03 |
| 0.83 |
| Apple, Inc. |
| 7.32 |
| 29.84 |
| 27.96 |
| 7.48 |
| 46.12 |
| 33.90 |
| 0.52 |
| Alphabet, Inc. |
| 3.88 |
| 25.28 |
| 22.99 |
| 5.65 |
| 6.13 |
| 21.57 |
| 0 |
| Amazon.com, Inc. |
| 3.52 |
| 74.18 |
| 53.80 |
| 2.71 |
| 8.20 |
| 88.65 |
| 0 |
| Berkshire Hathaway, Inc. |
| 2.15 |
| 8.70 |
| 20.01 |
| 1.90 |
| 1.39 |
| 29.00 |
| 0 |
| UnitedHealth Group, Inc. |
| 2.1 |
| 23.29 |
| 21.51 |
| 1.40 |
| 6.10 |
| 25.28 |
| 1.40 |
| Meta Platforms, Inc. |
| 2.04 |
| 28.23 |
| 22.37 |
| 6.65 |
| 5.91 |
| 22.48 |
| 0 |
| Broadcom Inc. |
| 1.74 |
| 28.12 |
| 21.64 |
| 10.97 |
| 17.62 |
| 39.51 |
| 2.02 |
| Tesla, Inc. |
| 1.71 |
| 71.52 |
| 71.70 |
| 8.09 |
| 14.51 |
| 210.20 |
| 0 |
| JPMorgan Chase & Co. |
| 1.59 |
| 8.64 |
| 8.67 |
| 1.87 |
| 1.46 |
| 4.09 |
| 2.90 |
Ratios: Portfolio123.
Since 10/1/2016, FVAL has underperformed the S&P 500 by about 12% in total return. The difference in annualized return is 87 bps, which is not very significant. Maximum drawdown and volatility (measured as the standard deviation of monthly returns) point to a slightly higher risk.
| Total Return |
| Annual.Return |
| Drawdown |
| Sharpe ratio |
| Volatility |
| FVAL |
| 116.57% |
| 11.50% |
| -37.26% |
| 0.59 |
| 17.83% |
| SPY |
| 128.84% |
| 12.37% |
| -33.72% |
| 0.67 |
| 16.54% |
Data calculated with Portfolio123.
FVAL vs. competitors
The next tables and charts compares FVAL to five other large cap value ETFs:
- Vanguard Value Index Fund ( VTV )
- iShares MSCI USA Value Factor ETF ( VLUE )
- First Trust Large Cap Value AlphaDEX® Fund ETF ( FTA )
- iShares Morningstar Value ETF ( ILCV )
- Invesco Large Cap Value ETF ( PWV ).
| FVAL |
| VTV |
| VLUE |
| FTA |
| ILCV |
| PWV |
| Inception |
| 9/12/2016 |
| 1/26/2004 |
| 4/16/2013 |
| 5/8/2007 |
| 6/28/2004 |
| 3/3/2005 |
| Expense Ratio |
| 0.29% |
| 0.04% |
| 0.15% |
| 0.59% |
| 0.04% |
| 0.55% |
| AUM |
| $564.88M |
| $139.39B |
| $6.12B |
| $1.07B |
| $808.99M |
| $739.42M |
| Avg Daily Volume |
| $4.09M |
| $343.21M |
| $31.17M |
| $3.86M |
| $2.88M |
| $1.66M |
| Holdings |
| 132 |
| 344 |
| 152 |
| 190 |
| 480 |
| 52 |
| Top 10 |
| 33.99% |
| 23.13% |
| 34.80% |
| 9.71% |
| 20.38% |
| 34.30% |
| Turnover |
| 43.00% |
| 5.00% |
| 23.00% |
| 80.00% |
| 27.00% |
| 104.00% |
| Yield ((TTM)) |
| 1.71% |
| 2.68% |
| 3.07% |
| 2.39% |
| 2.36% |
| 2.48% |
Data: Seeking Alpha.
FVAL is the smallest fund in assets under management, but it is in the middle of the pack regarding liquidity in average daily dollar volume. It has the lowest dividend yield of this group.
It is on the expensive side relative to peers regarding price-to-earnings and price-to-book, but shows a high earnings growth, as reported in the next table.
| FVAL |
| VTV |
| VLUE |
| FTA |
| ILCV |
| PWV |
| Price/earnings |
| 15.1 |
| 15.49 |
| 10.75 |
| 11.24 |
| 15.03 |
| 11.17 |
| Price/book |
| 2.52 |
| 2.4 |
| 1.39 |
| 1.5 |
| 2.36 |
| 1.83 |
| Price/sales |
| 1.33 |
| 1.55 |
| 0.84 |
| 1.04 |
| 1.57 |
| 1.11 |
| Price/cash flow |
| 9.84 |
| 10.72 |
| 6.52 |
| 7.48 |
| 10.66 |
| 7.65 |
| Earnings growth % |
| 20.93% |
| 15.47% |
| 16.49% |
| 17.11% |
| 15.91% |
| 21.87% |
FVAL is ahead of the competition in both 5-year and year-to-date total return:
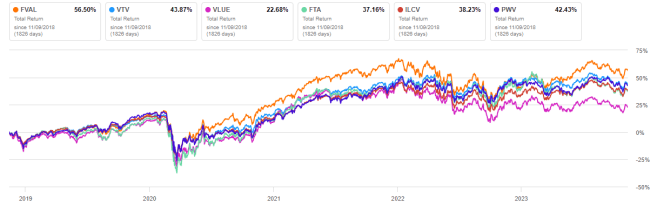
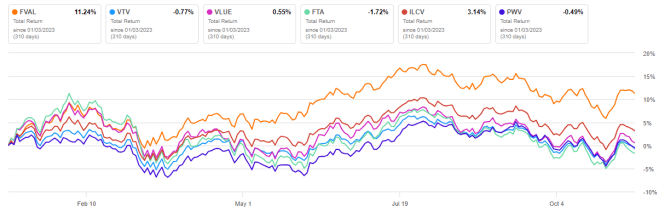
The differentiated ranking system may explain why FVAL beats its peers. Value indexes usually have two shortcomings. The first one is to classify all stocks on the same criteria. It means the valuation ratios are considered comparable across sectors and industries. Obviously, they are not: my monthly dashboard here shows how valuation and quality metrics may vary across sectors. A consequence is to privilege sectors where valuation ratios are naturally cheaper, especially financials. FVAL calculates the value score in a different way for banks. This is not a solution across all industries, but the problem is addressed in the most problematic one.
The second usual weakness of value funds is the price/book ratio (P/B), which adds some risk in the strategy. Historical data show that a large group of companies with low P/B has a higher volatility and deeper drawdowns than a same-size group with low price/earnings, price/sales or price/free cash flow. The next table shows the return and risk metrics of the cheapest quarter of the S&P 500 (i.e., 125 stocks) measured in price/book, price/earnings, price/sales and price/free cash flow. The sets are reconstituted annually between 1/1/2000 and 1/1/2023 with elements in equal weight.
| Annual.Return |
| Drawdown |
| Sharpe ratio |
| Volatility |
| Cheapest quarter in P/B |
| 8.54% |
| -81.55% |
| 0.35 |
| 37.06% |
| Cheapest quarter in P/E |
| 10.71% |
| -73.62% |
| 0.48 |
| 25.01% |
| Cheapest quarter in P/S |
| 12.82% |
| -76.16% |
| 0.47 |
| 34.83% |
| Cheapest quarter in P/FCF |
| 15.32% |
| -74.77% |
| 0.61 |
| 27.03% |
Data calculated with Portfolio123.
For further details see:
FVAL: Large-Cap Value ETF Outperforming Its Peers