LECO - FVD: Dividend Quality ETF Mitigating Downside Risks
2023-05-05 12:59:00 ET
Summary
- First Trust Value Line® Dividend Index Fund ETF holds over 150 stocks in equal-weight.
- First Trust Value Line® Dividend Index Fund ETF is well-balanced across sectors. Utilities, industrials, and consumer staples are the heaviest ones.
- Valuation ratios are a bit cheaper than the S&P 500, quality is similar.
- FVD has lagged the benchmark and its main competitors in the last 10 years.
- The safety screening has provided some downside protection in the last 12 months.
This article series aims at evaluating ETFs (exchange-traded funds) regarding the relative past performance of their strategies and metrics of their current portfolios. As holdings and weights change over time, updated reviews are posted when necessary.
FVD strategy and portfolio
First Trust Value Line® Dividend Index Fund ETF ( FVD ) has been tracking the Value Line Dividend Index since 08/19/2003. FVD has 168 holdings, a 12-month distribution yield of 2.13%, and a total expense ratio of 0.65%. It pays quarterly dividends.
As described on Value Line website:
“ The Value Line Safety Rank measures the total risk of a stock relative to the approximately 1,700 other stocks. It is derived from a stock's Price Stability rank and from the Financial Strength rating of a company, both shown in the lower right-hand corner of each page in Ratings & Reports. Safety ranks are also given on a scale from 1 (Safest) to 5 (Riskiest).”
To be eligible in the underlying index, companies must be listed in the U.S., have more than $1 billion in market capitalization, a higher dividend yield than the S&P 500 (SP500, SPY), and a Value Line Safety Rank of 1 or 2. Investment companies and limited partnerships are excluded from the universe. The fund seeks to rebalance holdings in equal weight on a monthly basis.
FVD holds mostly U.S.-based companies (85.6% of asset value), but it also invests in Canada (7.3%), Switzerland (2.5%) and the U.K. (1.8%). Other countries are below 1%. The portfolio is balanced between large companies (about 53%), and small / mid-caps (about 47%).
The top sectors are utilities (22.4%), industrials (17.9%) and consumer staples (15.9%). Compared to the S&P 500, FVD massively overweight these three sectors, and to a lesser extent, basic materials. It underweights all other sectors, mostly technology, communication services, and energy.
Sector breakdown (chart: author; data: First Trust and SSGA)
Positions are reset in equal weight every month, but they may drift with price action. The next table lists the top 10 holdings as of writing. These are the best performers since the last rebalancing. They represent 6.5% of asset value and no holding weighs more than 0.71% of assets, so the portfolio is well-diversified and risks related to individual stocks are very low.
| Ticker |
| Name |
| Weight% |
| EPS growth %TTM |
| P/E TTM |
| P/E fwd |
| Yield% |
| Hubbell, Inc. |
| 0.71% |
| 10.40 |
| 26.63 |
| 20.04 |
| 1.66 |
| Assurant, Inc. |
| 0.68% |
| -39.42 |
| 29.19 |
| 11.19 |
| 2.15 |
| Comcast Corp. |
| 0.66% |
| -57.53 |
| 30.49 |
| 10.95 |
| 2.88 |
| Broadridge Financial Solutions, Inc. |
| 0.64% |
| 0.18 |
| 32.79 |
| 22.12 |
| 1.89 |
| C.H. Robinson Worldwide, Inc. |
| 0.64% |
| -12.25 |
| 16.56 |
| 24.78 |
| 2.37 |
| The Clorox Co. |
| 0.64% |
| -83.89 |
| 287.95 |
| 38.42 |
| 2.76 |
| Kellogg Co. |
| 0.64% |
| -45.99 |
| 28.99 |
| 17.26 |
| 3.35 |
| Lincoln Electric Holdings, Inc. |
| 0.64% |
| 45.41 |
| 20.84 |
| 18.62 |
| 1.54 |
| Mondelez International, Inc. |
| 0.64% |
| -3.93 |
| 26.99 |
| 24.31 |
| 1.99 |
| NewMarket Corp. |
| 0.64% |
| 90.05 |
| 12.29 |
| N/A |
| 2.27 |
Past performance
Since inception in August 2003, FVD has underperformed SPY and the equal-weight Invesco S&P 500® Equal Weight ETF ( RSP ). It looks a bit less risky in drawdown and standard deviation of monthly returns (“volatility” in the table below).
| Total Return |
| Annual.Return |
| Drawdown |
| Sharpe ratio |
| Volatility |
| FVD |
| 339.90% |
| 7.82% |
| -52.49% |
| 0.57 |
| 13.44% |
| SPY |
| 476.07% |
| 9.31% |
| -55.19% |
| 0.61 |
| 14.87% |
| RSP |
| 523.05% |
| 9.75% |
| -59.92% |
| 0.58 |
| 17.04% |
Data calculation: Portfolio123.
The next chart compares the 10-year total returns of FVD, SPY, RSP, and three dividend ETFs with quality screening:
- Vanguard Dividend Appreciation Index Fund ( VIG )
- WisdomTree U.S. Quality Dividend Growth Fund ( DGRW )
- Schwab U.S. Dividend Equity ETF ( SCHD ).
FVD has been lagging them all.
FVD vs. benchmarks and competitors, 10-year total return ( Seeking Alpha)
In the whipsaw of the last 12 months, the First Trust fund has done better: it is in the middle of the pack and clearly shows shallower drawdowns.
FVD vs. benchmarks and competitors, 12-month total return (Seeking Alpha)
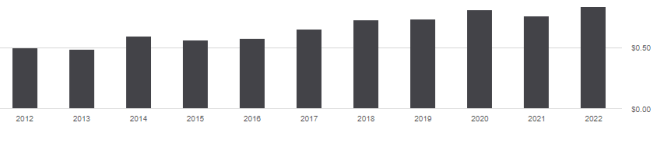
The sum of annual distributions has increased from $0.50 to $0.83 between 2012 and 2022. This is a 66% growth rate in 10 years, whereas the cumulative inflation has been about 29% in the same time (based on CPI). FVD distributions have beaten inflation, but the annualized growth rate of 5.2% is average.
In previous articles, I have shown how three factors may help cut the risk in a dividend portfolio: Return on Assets , Piotroski F-score , and Altman Z-score .
The next table compares FVD since inception with a subset of the S&P 500: stocks with an above-average dividend yield, an above-average ROA, a good Altman Z-score, a good Piotroski F-score and a sustainable payout ratio. The subset is rebalanced annually to make it comparable with a passive index.
| Total Return |
| Annual.Return |
| Drawdown |
| Sharpe ratio |
| Volatility |
| FVD |
| 339.90% |
| 7.82% |
| -52.49% |
| 0.57 |
| 13.44% |
| Dividend & quality subset |
| 890.97% |
| 12.37% |
| -43.13% |
| 0.81 |
| 14.67% |
P ast performance is not a guarantee of future returns. Data calculation : Portfolio123.
FVD underperforms the dividend quality subset by 4.5 percentage points in annualized return. However, the fund’s performance is real and the subset is simulated. My core portfolio holds 14 stocks selected in this subset (more info at the end of this post).
Scanning FVD portfolio
FVD is slightly cheaper than SPY regarding the usual valuation ratios, reported in the next table.
| FVD |
| SPY |
| Price/Earnings TTM |
| 19.2 |
| 20.68 |
| Price/Book |
| 2.66 |
| 3.78 |
| Price/Sales |
| 1.84 |
| 2.4 |
| Price/Cash Flow |
| 13.55 |
| 15.44 |
I have scanned holdings with the quality metrics described in the previous paragraph. I consider that risky stocks are companies with at least 2 red flags among: bad Piotroski score, negative ROA, unsustainable payout ratio, bad or dubious Altman Z-score, excluding financials and real estate where these metrics are less relevant. With these assumptions, 17 stocks out of 168 are risky, and they weigh about 10% of asset value. This is not very good, yet acceptable.
Based on my calculation, the aggregate return on assets, Altman Z-score, and Piotroski F-score are close to S&P 500 values. These metrics point to a portfolio quality similar to the benchmark.
| FVD |
| SPY |
| Altman Z-score |
| 3.16 |
| 3.37 |
| Piotroski F-score |
| 5.63 |
| 5.46 |
| ROA % TTM |
| 6.8 |
| 7.44 |
Takeaway
First Trust Value Line® Dividend Index Fund ETF follows a dividend strategy with an equal-weight methodology. Constituents (currently 168) are screened with a safety score based on technical and fundamental factors. The heaviest sectors in the portfolio are utilities, industrials, and consumer staples.
The First Trust Value Line® Dividend Index Fund ETF portfolio is better diversified across sectors and holdings than the S&P 500. Aggregate valuation metrics are a bit better than the benchmark, and quality is similar. Regarding historical performance since inception, the fund shows a slightly lower risk than the broad index regarding drawdown and volatility, but the total return is underwhelming. The safety screening may provide some downside protection in a bear market, but it has not brought excess return in two decades.
For further details see:
FVD: Dividend Quality ETF Mitigating Downside Risks