GAM - GAM: Might Need A Change In Managers
2023-04-19 13:38:29 ET
Summary
- The GAM fund is an investment fund in operation since 1927.
- It has a long-term track record of outperforming the markets.
- However, its performance has been underwhelming in the past decade.
- Until the fund can string together a streak of outperformance, I believe investors are better served investing in the SPY.
The General American Investors Company ( GAM ) is a closed-end fund with a long-operating history. Historically, GAM has outperformed the markets on a 30/40/50 Yr time horizon. However, results in the past 2 decades have underwhelmed, particularly since the current PM took over the reins.
Until the GAM fund can demonstrate it has regained its outperformance streak against the markets, I believe investors are better served getting their equity exposure from passive ETFs like the SPY.
Fund Overview
The General American Investors Company is a closed-end fund ("CEF") that has been in operation since 1927. The fund was sponsored by Lazard Freres and Lehman Brothers and its first President was Frank Altschul , one of the most successful financiers of his time. The fund focuses on long-term capital appreciation by investing in high quality companies with growth potential trading at reasonable valuations.
Investment decisions by the fund are made by the portfolio manager, who also holds the President & CEO title. The current PM, Jeffrey Priest, has been leading GAM since 2012. Prior to GAM, Mr. Priest ran Amajac Capital Management, LLC, an investment advisory practice he founded.
The GAM fund has $1.0 billion in net assets and may utilize leverage from preferred shares to enhance returns. The fund has $190 million in preferred shares outstanding for 15% effective leverage.
For fiscal 2022, the GAM fund charged a 1.13% net expense ratio.
Portfolio Holdings
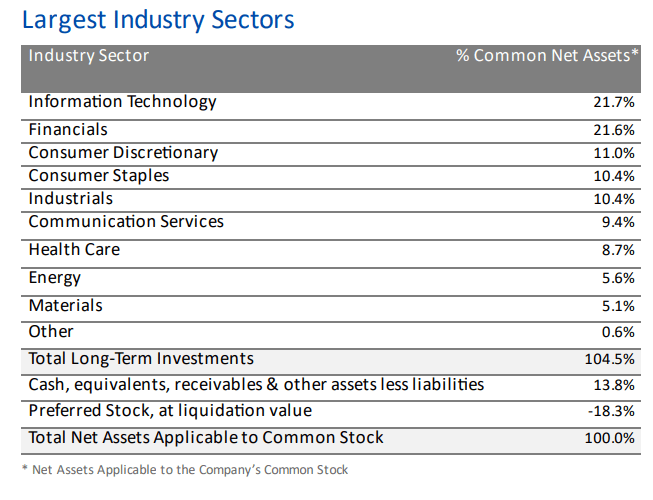
Figure 1 shows GAM's sector allocation as of December 31, 2022. GAM's portfolio is built bottoms-up from individual security selection, which results in a portfolio that may differ materially from the market.
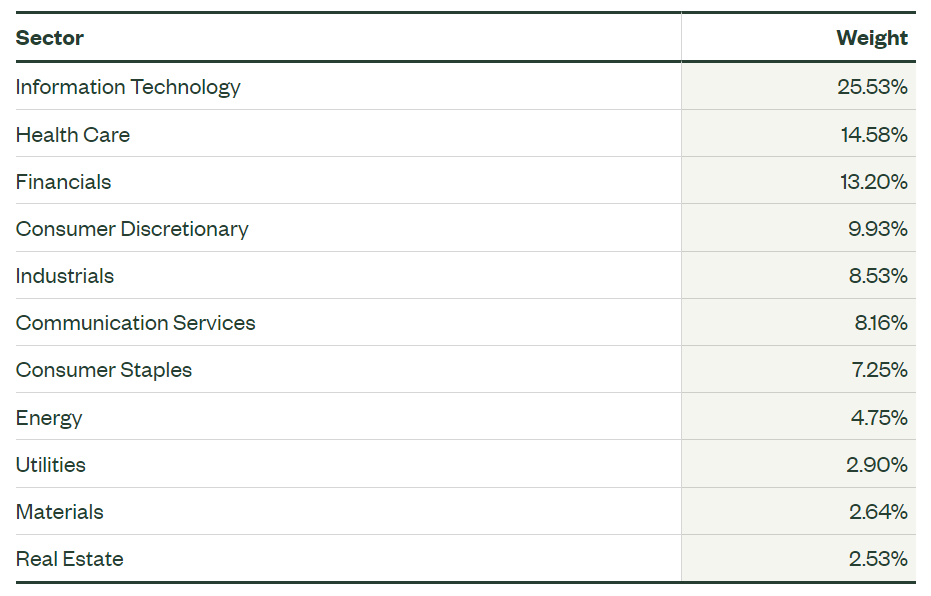
For example, Figure 2 shows the sector allocation of the SPDR S&P 500 Trust ETF ( SPY ) for comparison. Relative to the market as represented by the SPY ETF, GAM is overweight Financials (21.6% vs. 13.2%), Consumer Staples (10.4% vs. 7.3%), Industrials (10.4% vs. 8.5%) and Consumer Discretionary (11.0% vs. 9.9%). It is underweight Health Care (8.7% vs. 14.6%), Information Technology (21.7% vs. 25.5%), and Utilities (not listed vs. 2.9%).
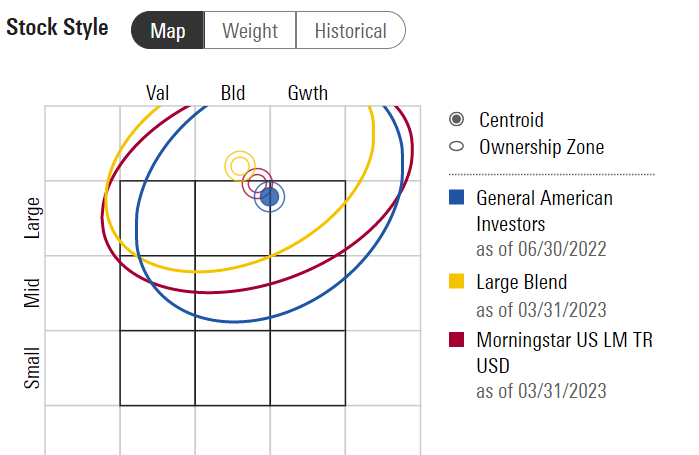
According to Morningstar, GAM's portfolio skews towards Large-Cap Growth stocks, which is consistent with its investment policy statement of growth at a reasonable price ("GARP") (Figure 3).
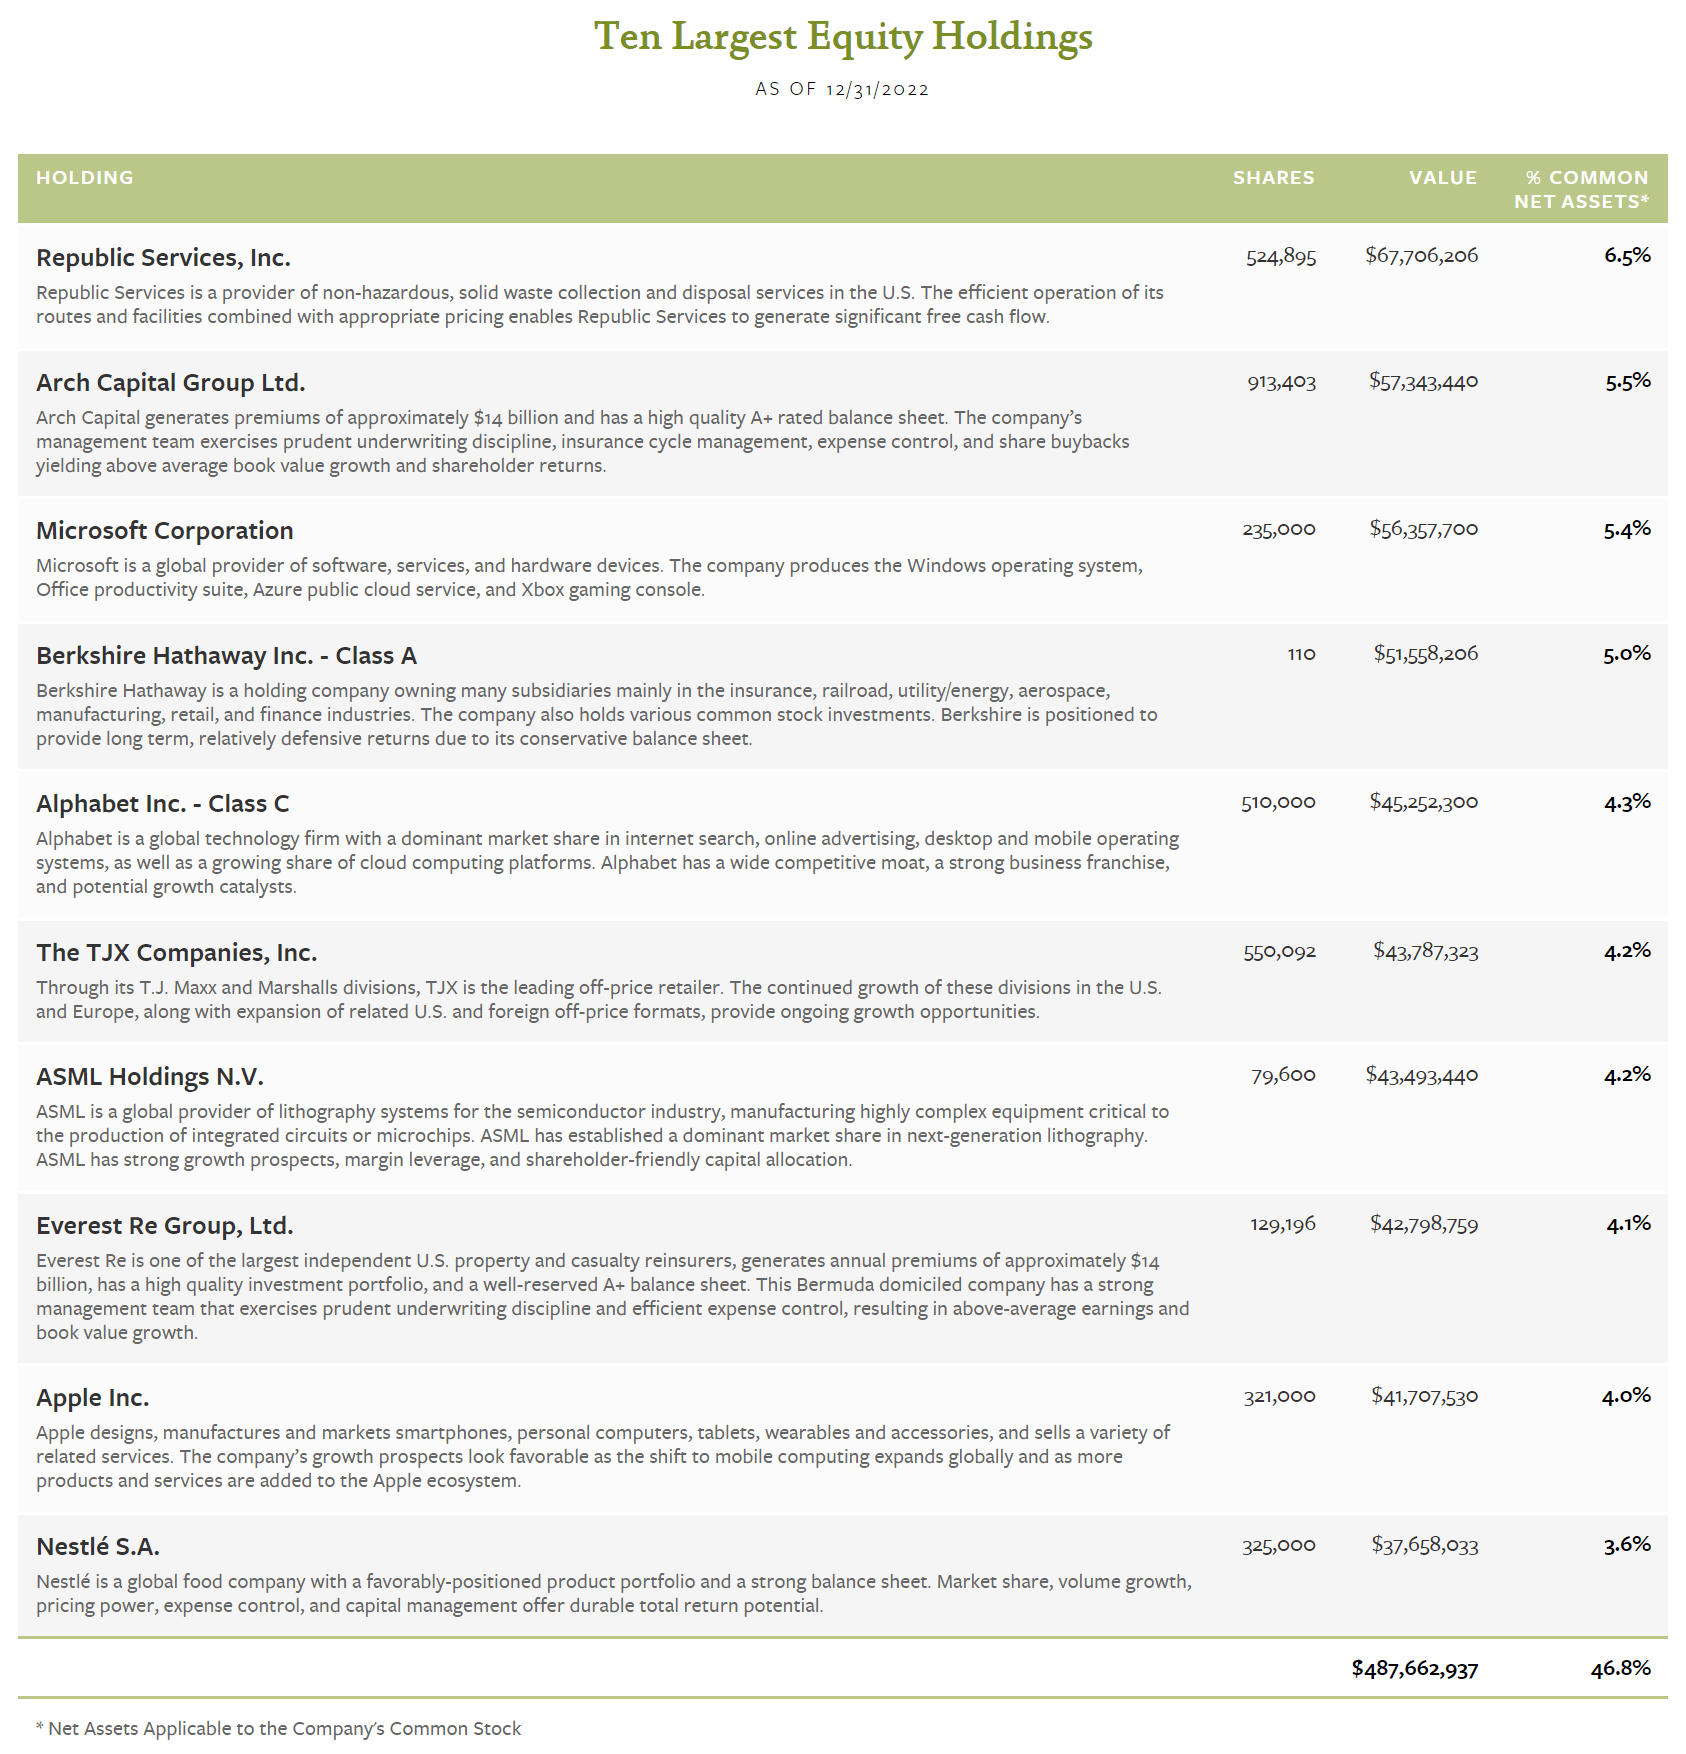
The GAM fund is fairly concentrated, with its top 10 holdings comprising 46.8% of the portfolio (Figure 4).
Figure 4 - GAM top 10 holdings (generalamericaninvestors.com)
Distribution & Yield
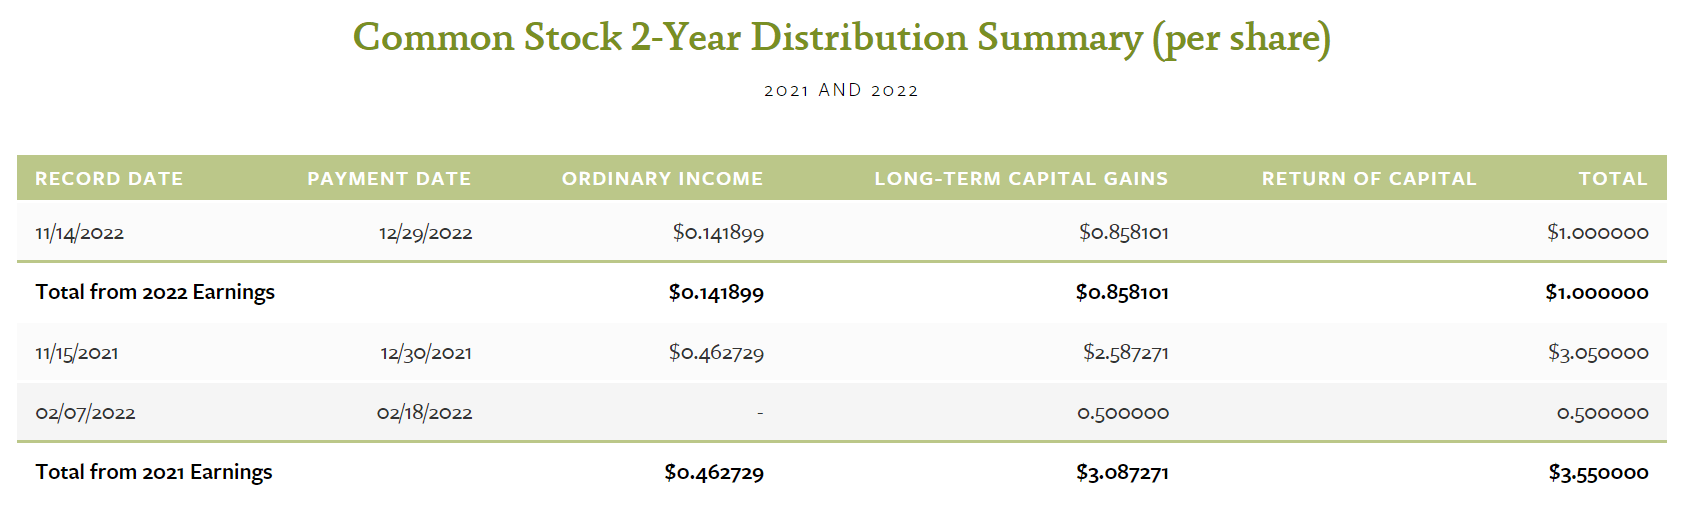
The GAM fund has continuously paid a distribution since 1939. The fund's distribution policy is to distribute ordinary income and realized gains to stockholders.
In 2022, the fund paid $1.00 / share in distributions vs. $3.55 / share in 2021 (Figure 5).
Distributions on the GAM fund are paid in shares unless the stockholder specifically requests payment in cash.
Returns
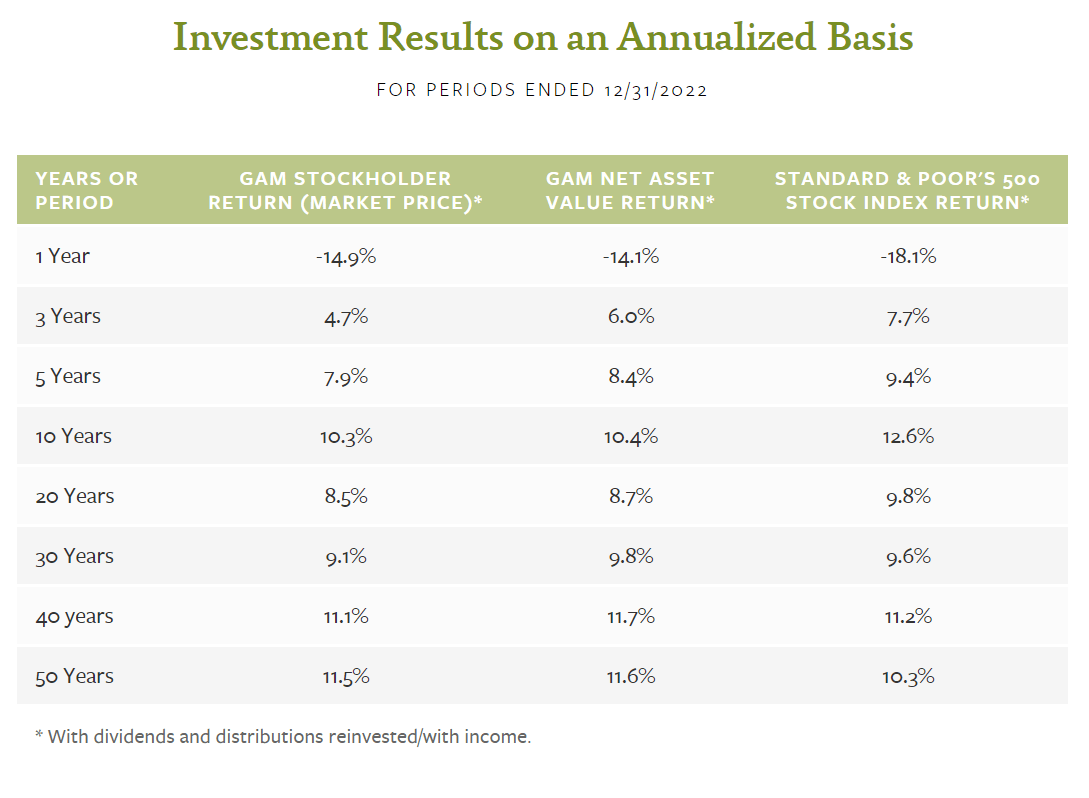
The GAM fund is one of the longest-operating investment funds in the marketplace with operations since 1927. Historically, the fund has outperformed the S&P 500 Index, with 30/40/50Yr annual returns of 9.8%/11.7%/11.6% respectively to December 31, 2022 compared to 9.6%/11.2%/10.3% for the S&P 500 (Figure 6).
Figure 6 - GAM historical returns (genralamericaninvestors.com)
A Fund Is Only As Good As Its Manager
However, results in the past 2 decades have been lagging, with 3/5/10/20Yr annual returns all lagging the S&P 500. In particular, results in the past decade have lagged the markets by 100-200 bps p.a. Investors should note that the current portfolio manager, Mr. Priest, took over management duties in 2012.
While investment results can vary from year-to-year, it is notable that in 6 of the past 10 years, the GAM fund has underperformed the S&P500, with particular underperformance in 2014 (6.5% vs. 13.7%) and 2020 (7.5% vs. 18.4%) (Figure 7). GAM's streak of underperformance suggests poor security selection by the current manager.
Furthermore, with a 1.13% net expense ratio, investors start off each year with a 100+ bps hurdle they must overcome.
Conclusion
Although the GAM fund's long-operating history is commendable, recent results have been underwhelming, particular since the appointment of the current portfolio manager. Until the fund can show it can consistently outperform the S&P 500 again, I believe investors are better served getting their equity exposure from a diversified ETF like the SPY ETF.
For further details see:
GAM: Might Need A Change In Managers