STLA - GCOW: Excellent Value And Dividend Growth But Average Return
2023-07-03 05:12:12 ET
Summary
- Pacer Global Cash Cows Dividend ETF holds dividend stocks with superior free cash flow in developed markets.
- Energy is the heaviest sector with about 25% of asset value.
- The yield, valuation metrics, and dividend growth rate are very attractive.
- However, it is not the best among peers for total return.
This article series aims at evaluating ETFs (exchange-traded funds) regarding past performance and portfolio metrics. Reviews with updated data are posted when necessary.
GCOW strategy and portfolio
Pacer Global Cash Cows Dividend ETF ( GCOW ) started operations on 2/22/2016 and tracks the Pacer Global Cash Cows Dividend Index. It has 101 holdings, a 12-month distribution yield of 4.76% and a total expense ratio of 0.60%. Distributions are paid quarterly.
As described by PACER ETFs , constituents must be in the FTSE All-World Developed Large Cap Index, excluding REITs, financials, and companies with negative projected free cash flows or earnings for the next 2 years. The 300 remaining companies with the highest free cash flow yield are ranked by dividend yield. Then, the 100 companies with the highest dividend yield are included in the index. Constituents are weighted based on total dividends distributed in the trailing 12 months, with a maximum weight of 2% for any individual company. The index is reconstituted twice a year in June and December.
The fund invests mostly in large companies (93% of asset value). The heaviest countries are the U.S. (16.2%) and the U.K. (14.4%), followed by Germany and Japan (about 13% each). Other countries are below 9%. The next chart lists the top 10 countries, representing an aggregate weight of 86%.
GCOW top 10 countries (chart: author; data: PACER ETFs)
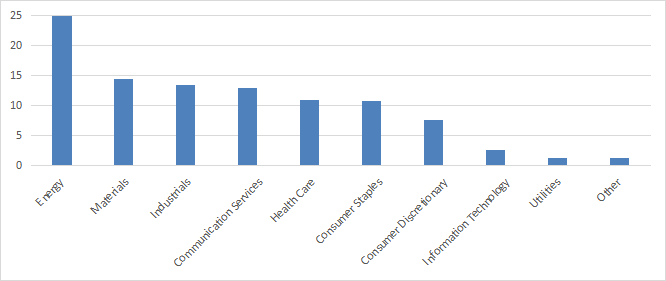
Energy is the heaviest sector (24.9%), followed by materials, industrials and communication (each between 13% and 15%). The portfolio is well-diversified across sectors, but technology and utilities are underweight.
GCOW sector breakdown in % (chart: author; data: Fidelity)
The top 10 holdings, listed below, represent 20.4% of asset value. The top name weighs 2.14%, so risks related to individual companies are low.
| US Ticker* |
| Name |
| Weight |
| EPS growth %TTM |
| P/E TTM |
| P/E fwd |
| Yield% |
| FSUGY |
| Fortescue Metals Group Ltd. |
| 2.14% |
| -33.73 |
| 7.81 |
| N/A |
| 8.79 |
| BMWYY |
| Bayerische Motoren Werke AG |
| 2.10% |
| -47.58 |
| 6.82 |
| 6.90 |
| 7.52 |
| VZ |
| Verizon Communications, Inc. |
| 2.06% |
| -0.20 |
| 7.25 |
| 7.97 |
| 7.02 |
| PM |
| Philip Morris International, Inc. |
| 2.04% |
| -3.12 |
| 17.44 |
| 15.65 |
| 5.20 |
| GLNCY |
| Glencore Plc |
| 2.03% |
| 252.07 |
| 4.24 |
| 16.03 |
| 6.19 |
| MBGYY |
| Mercedes-Benz Group AG |
| 2.02% |
| -39.30 |
| 5.53 |
| N/A |
| 7.15 |
| T |
| AT&T, Inc. |
| 2.01% |
| -157.72 |
| N/A |
| 6.62 |
| 6.96 |
| UPS |
| United Parcel Service, Inc. |
| 2.01% |
| 1.02 |
| 14.49 |
| 16.72 |
| 3.62 |
| STLA |
| Stellantis NV |
| 2.00% |
| 4.78 |
| 3.12 |
| 3.43 |
| 8.35 |
| BHP |
| BHP Group Ltd. |
| 1.99% |
| 19.47 |
| 7.60 |
| 10.49 |
| 8.88 |
Aggregate valuation ratios are very cheap relative to its parent index, represented in the next table by Vanguard FTSE Developed Markets ETF ( VEA ).
| GCOW |
| VEA |
| P/E ttm |
| 5.83 |
| 12.89 |
| P/book |
| 1.17 |
| 1.53 |
| P/sales |
| 0.72 |
| 1.14 |
| P/cash flow |
| 4.03 |
| 8.81 |
Source: Fidelity
Past performance
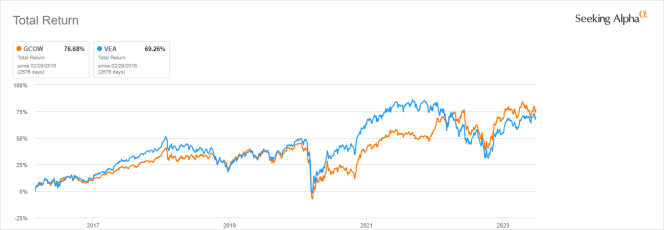
Since inception, GCOW has outperformed VEA. However, the difference in annualized return is below 1%.
GCOW vs benchmark since inception (Seeking Alpha)
Foreign equities have lagged the U.S. market: in the same period, the S&P 500 shows a total return of 158.65%.
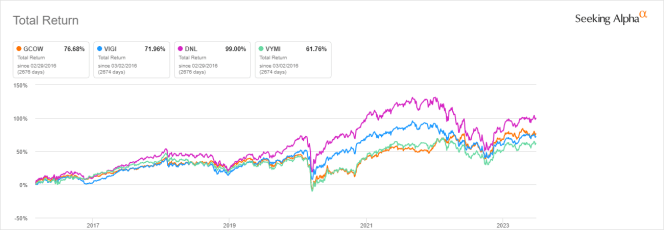
The next chart compares GCOW since inception with 3 non-hedged international dividend ETFs:
- Vanguard International Dividend Appreciation ETF ( VIGI ), reviewed here ,
- WisdomTree Global ex-U.S. Quality Dividend Growth Fund ( DNL ), reviewed here ,
- Vanguard International High Dividend Yield ETF ( VYMI ).
These funds exclude the U.S., which is a handicap relative to GCOW.
GCOW vs competitors since inception (Seeking Alpha)
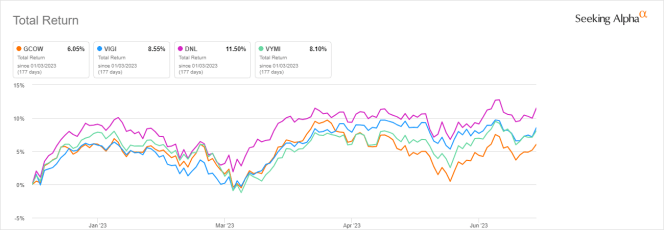
The best performer is DNL. GCOW has lagged in 2023 to date.
GCOW vs competitors year-to-date (Seeking Alpha)
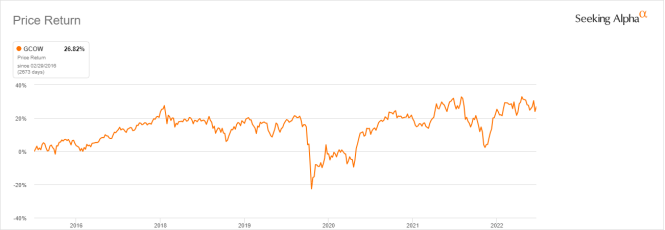
The share price has gained 26.8% since inception (next chart). In the same time, the cumulative inflation has been 27.7%, based on CPI. Therefore, the fund has almost preserved the inflation-adjusted capital of shareholders, excluding distributions.
GCOW share price history (Seeking Alpha)
The sum of annual distributions has increased from $0.88 to $1.39 per share between 2017 and 2022. This is a total dividend growth rate of 58%, far ahead of inflation. In this regard, it beats by a short margin the ProShares S&P 500 Dividend Aristocrats ETF ( NOBL ), which shows a dividend growth rate of 57% for the same period.
GCOW distribution history (Seeking Alpha)
Takeaway
Pacer Global Cash Cows Dividend ETF holds 100 large and mid-cap dividend stocks with superior free cash flow in developed markets. Energy is the heaviest sector, but the fund is well diversified across countries, sectors and holdings. Valuation ratios and the dividend growth rate are very attractive. GCOW beats its parent index in total return since 2016, and it is shortly ahead of Vanguard International Dividend Appreciation ETF ( VIGI ). However, it has been lagging WisdomTree Global ex-U.S. Quality Dividend Growth Fund ( DNL ).
For further details see:
GCOW: Excellent Value And Dividend Growth, But Average Return