WELL - Get An 8.3% Yield From Secure High-Quality REITs: RQI
2023-08-30 17:35:37 ET
Summary
- There has been a lot of trouble from high-yielding REITs. But there might be another way.
- Cohen & Steers Quality Income Realty Fund offers an 8.3% yield on its current price and provides exposure to safer low and mid-yielding REITs.
- I take a deep dive into this investor favorite closed-end fund.
Written by Sam Kovacs.
(Authors note: This report was initially prepared for our investment group, but we decided after the fact to share it with the entire Seeking Alpha community.)
Introduction
We usually do not invest in closed-end funds ("CEFs"), because I usually argue that I am good enough at picking stocks myself, and I most likely disagree with some of the picks which will be suggested by a fund manager.
In fact, with the closed-end fund I'm going to present today, this is once again the case.
The fund's biggest holding is Prologis ( PLD ). For those of you who have been following closely, my favorite industrial pick is Rexford ( REXR ), which is much smaller and has exposure to select geographies which have better supply and demand dynamics than the market at large.
However, this isn't the topic of today's article ( you can read more about this here ).
The topic of today's article is the Cohen & Steers Quality Income Realty Fund ( RQI ).
So why would I consider this CEF and not another?
RQI uses leverage to invest in real estate investment trusts, or REITs. It currently has a 29.5% leverage ratio, which means that for $1 in assets, it invest $1.295 in REITs (along with some preferred and corporate bonds).
As these securities pay dividends, this increases the yield on the portfolio by 30%, minus the cost of leverage.
This allows RQI to pay out a $0.08 monthly distribution, which is an 8.3% yield on its current $11.46 price.
As such, it is an interesting vehicle to generate a high yield while maintaining exposure to safer low and mid-yielding REITs, as we'll see later.
Leverage is a double-edged sword. On the way down, a leveraged fund will see NAV erode faster.
I believe now is an interesting time to initiate exposure to RQI because of my outlook for REITs over the next 6-18 months, which I have shared in the past (I think REITs have witnessed most of the pain they were going to endure, and will soon swing back up).
Analyzing a CEF is somewhat different than analyzing an equity. We start our work with the prospectus, which gives us everything we need to understand about the fund. From there we of course need to do some cursory analysis of underlying holdings, especially the larger ones, and check diversification. We compare the price to the NAV and historical discounts. Finally, we analyze distribution metrics, making sure that the distribution isn't just a return of capital. Ready to dig in?
Key elements from prospectus & fact sheet.
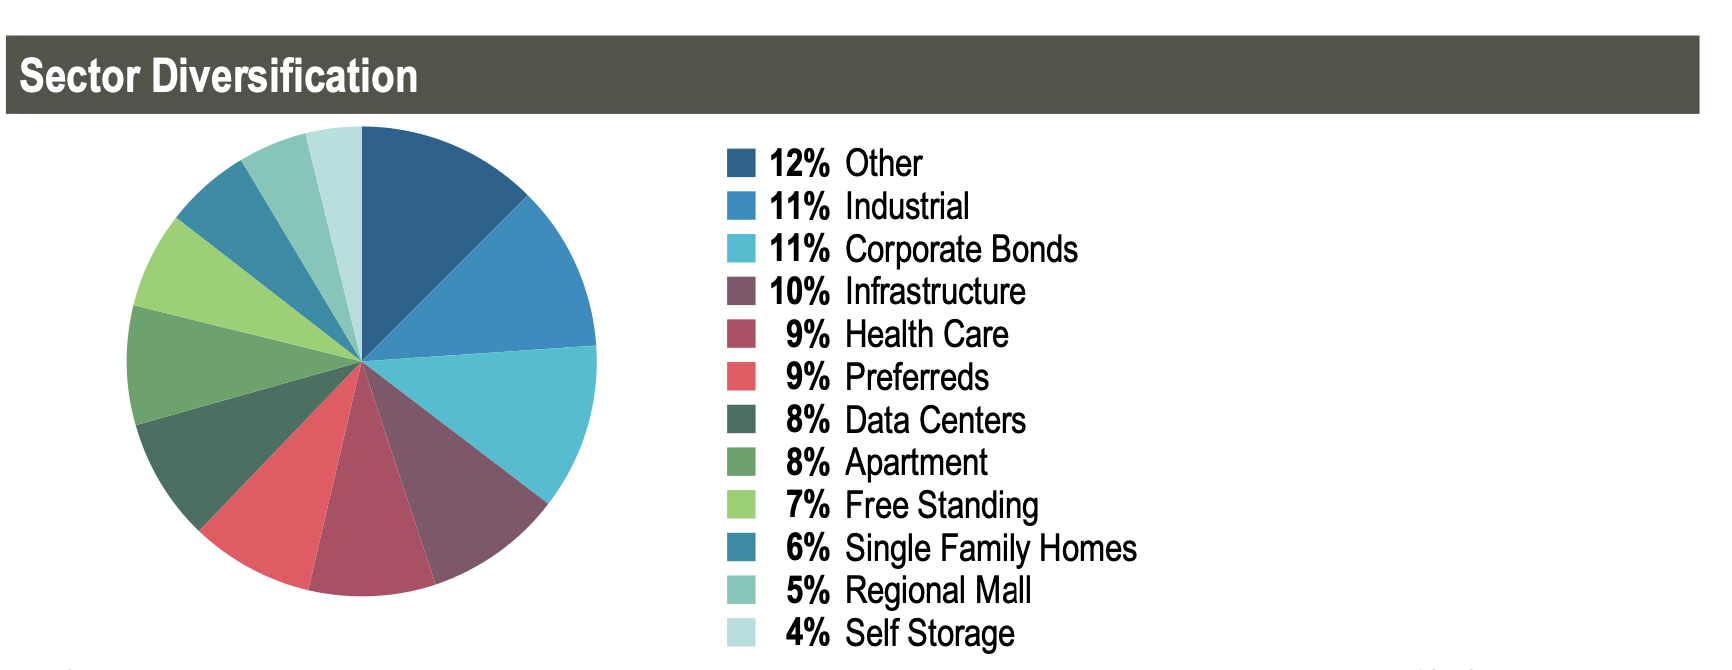
RQI commits to investing at least 80% of its total assets in income-producing equity securities issued by high-quality REITs. These are REITs which show prospects for above-average revenue and earnings growth, and are identified based on criteria like earnings growth history, debt to capital ratio, and quality of management.
The balance is invested in corporate bonds and preferred shares of real estate companies.
Investment Restrictions:
- Debt securities issued by real estate companies: Up to 10%
- High-risk securities (junk bonds): Not more than 20%
- Foreign securities: Up to 25%, with 15% maximum in emerging market countries
- Any single issuer: A cap of 10% of the fund's total assets.
Leverage Facts:
| Criteria | Percentage/Figure |
|---|---|
| Prologis, Inc. ((PLD)) | |
| Industrial | |
| $206,484,271.37 | |
| 8.58% | |
| American Tower Corporation ( AMT ) | |
| Infrastructure | |
| $152,969,399.24 | |
| 6.36% | |
| Welltower Inc. ( WELL ) | |
| Health Care | |
| $143,935,180.66 | |
| 5.98% | |
| Invitation Homes Inc. ( INVH ) | |
| Single Family Homes | |
| $117,563,100.80 | |
| 4.89% | |
| Digital Realty Trust, Inc. ( DLR ) | |
| Data Centers | |
| $116,257,512.29 | |
| 4.83% | |
| Realty Income Corporation ( O ) | |
| Free Standing | |
| $113,189,824.17 | |
| 4.70% | |
| Simon Property Group, Inc. ( SPG ) | |
| Regional Mall | |
| $112,935,398.20 | |
| 4.69% | |
| Equinix, Inc. ( EQIX ) | |
| Data Centers | |
| $86,643,400.62 | |
| 3.60% | |
| Mid-America Apartment Communities ( MAA ) | |
| Apartment | |
| $79,487,320.50 | |
| 3.30% | |
| Crown Castle International Corp. ( CCI ) | |
| Infrastructure | |
| $76,081,384.08 | |
| 3.16% | |
| UDR, Inc. ( UDR ) | |
| Apartment | |
| $61,387,348.32 | |
| 2.55% | |
| Extra Space Storage Inc. ( EXR ) | |
| Self Storage | |
| $59,766,252.00 | |
| 2.48% | |
| Sun Communities, Inc. ( SUI ) | |
| Manufactured Home | |
| $57,146,959.32 | |
| 2.37% | |
| Healthcare Realty Trust Inc. ( HR ) | |
| Health Care | |
| $55,538,211.32 | |
| 2.31% | |
| Americold Realty Trust ( COLD ) | |
| Industrial | |
| $53,766,741.50 | |
| 2.23% | |
| Kimco Realty Corporation ( KIM ) | |
| Shopping Center | |
| $48,720,685.56 | |
| 2.02% | |
| Camden Property Trust ( CPT ) | |
| Apartment | |
| $38,606,826.18 | |
| 1.60% | |
| Spirit Realty Capital (SRC) | |
| Free Standing | |
| $33,833,602.66 | |
| 1.41% | |
| Public Storage ( PSA ) | |
| Self Storage | |
| $33,429,892.04 | |
| 1.39% | |
| Host Hotels & Resorts, Inc. ( HST ) | |
| Hotel | |
| $27,617,323.14 | |
| 1.15% | |
| American Homes 4 Rent-CL ( AMH ) | |
| Single Family Homes | |
| $25,632,583.35 | |
| 1.07% | |
| Legacy Gateway JV, LLC | |
| Private Real Estate | |
| $25,114,391.82 | |
| 1.04% | |
| VICI Properties Inc. ( VICI ) | |
| Specialty | |
| $24,778,877.69 | |
| 1.03% | |
| Interest Rate Swap 6 Yr Usd 2027 Sept 15 Ms v1 Apartment Income Reit Co | |
| Derivatives | |
| $20,861,749.20 | |
| 0.87% | |
| W. P. Carey & Co. LLC ( WPC ) | |
| Apartment | |
| $18,336,715.47 | |
| 0.76% | |
| Interest Rate Swap 4 Yr Usd 2025 Sept 15 Ms V2 Bg Llh Llc | |
| Diversified | |
| $17,660,994.72 | |
| 0.73% | |
| Cousins Properties Inc. ( CUZ ) | |
| Derivatives | |
| $16,819,270.00 | |
| 0.70% | |
| Netstreit Corp. ( NTST ) | |
| Industrial | |
| $15,283,737.56 | |
| 0.64% | |
| Interest Rate Swap 5 Yr Usd 2026 Sept 15 Ms Highwoods Properties Inc. | |
| Office | |
| $13,310,617.20 | |
| 0.55% | |
| Medical Properties Trust, Inc. ( MPW ) | |
| Free Standing | |
| $12,745,348.62 | |
| 0.53% |
The concentration of its top positions is quite similar to concentration within our model portfolios.
It is also worth mentioning that while the DFT covers 8 of the top 30 positions, their weight within the fund represents no more than 20% of total assets.
This is actually quite good, as it suggests that adding RQI would actually add diversification to our real estate exposure rather than creating leveraged redundancy.
It is also interesting to note that they own MPW, demonstrating that they are as able as we are to make mistakes.
Furthermore, the risk section of the prospectus was quite good in summarizing the different risks of various real estate industries.
Here's a short summary below:
-
Healthcare Facilities :
- Regulatory Risks : These properties often operate under stringent regulations that can necessitate capital expenditures or limit profits.
- Dependency on Government Payments : Some of these properties rely on Medicare and Medicaid payments, which are subject to changes in governmental budgets and policies.
-
Hotels and Resorts :
- High Capital Expenditure : These properties often require more capital spending than other types of commercial real estate.
- Economic Sensitivity : Their financial performance is closely tied to general economic conditions and travel industry dynamics. Economic downturns can hit hospitality REITs disproportionately hard, as they basically have tenants with daily leases.
-
Shopping Centers or Retail Properties :
- Consumer Behavior : These properties can be impacted by shifts in consumer spending habits.
- Tenant Risks : Bankruptcies of major retail firms can result in vacancies and rejected leases.
-
Rental Housing
- Home Financing : The value of such properties can decline when mortgage financing for single-family homes becomes more accessible at low rates.
- Economic Conditions : A slowdown in job creation and household formations can negatively impact these REITs.
-
Warehouse and Industrial Properties :
- Trade Patterns : Changes in global or regional trade patterns can adversely affect these properties. Near-shoring in Mexico is one example of this.
-
Office Buildings :
- Tenant Relocation Risks : These properties can suffer if certain types of tenants, like call centers, move their operations to cheaper locations, including overseas, or if companies adopt work from home policies, and no longer need as much office space.
-
Net Lease Properties :
- Tenant Health : The value of properties leased to single tenants (where the tenant covers most property expenses) depends on the financial health and business prospects of those tenants.
The sheer variety of industries within REITs and their own idiosyncratic risks and opportunities shows why it is silly for the media to lump all real estate together when making assessments.
While all REITs have in common that they are spread businesses on the cost of capital, and therefore impacted by higher interest rates, the micro of each industry is just as important.
With RQI you get their management's preferences of being overweight or underweight certain industries.
Let's now look at how good a job they've done in the past.
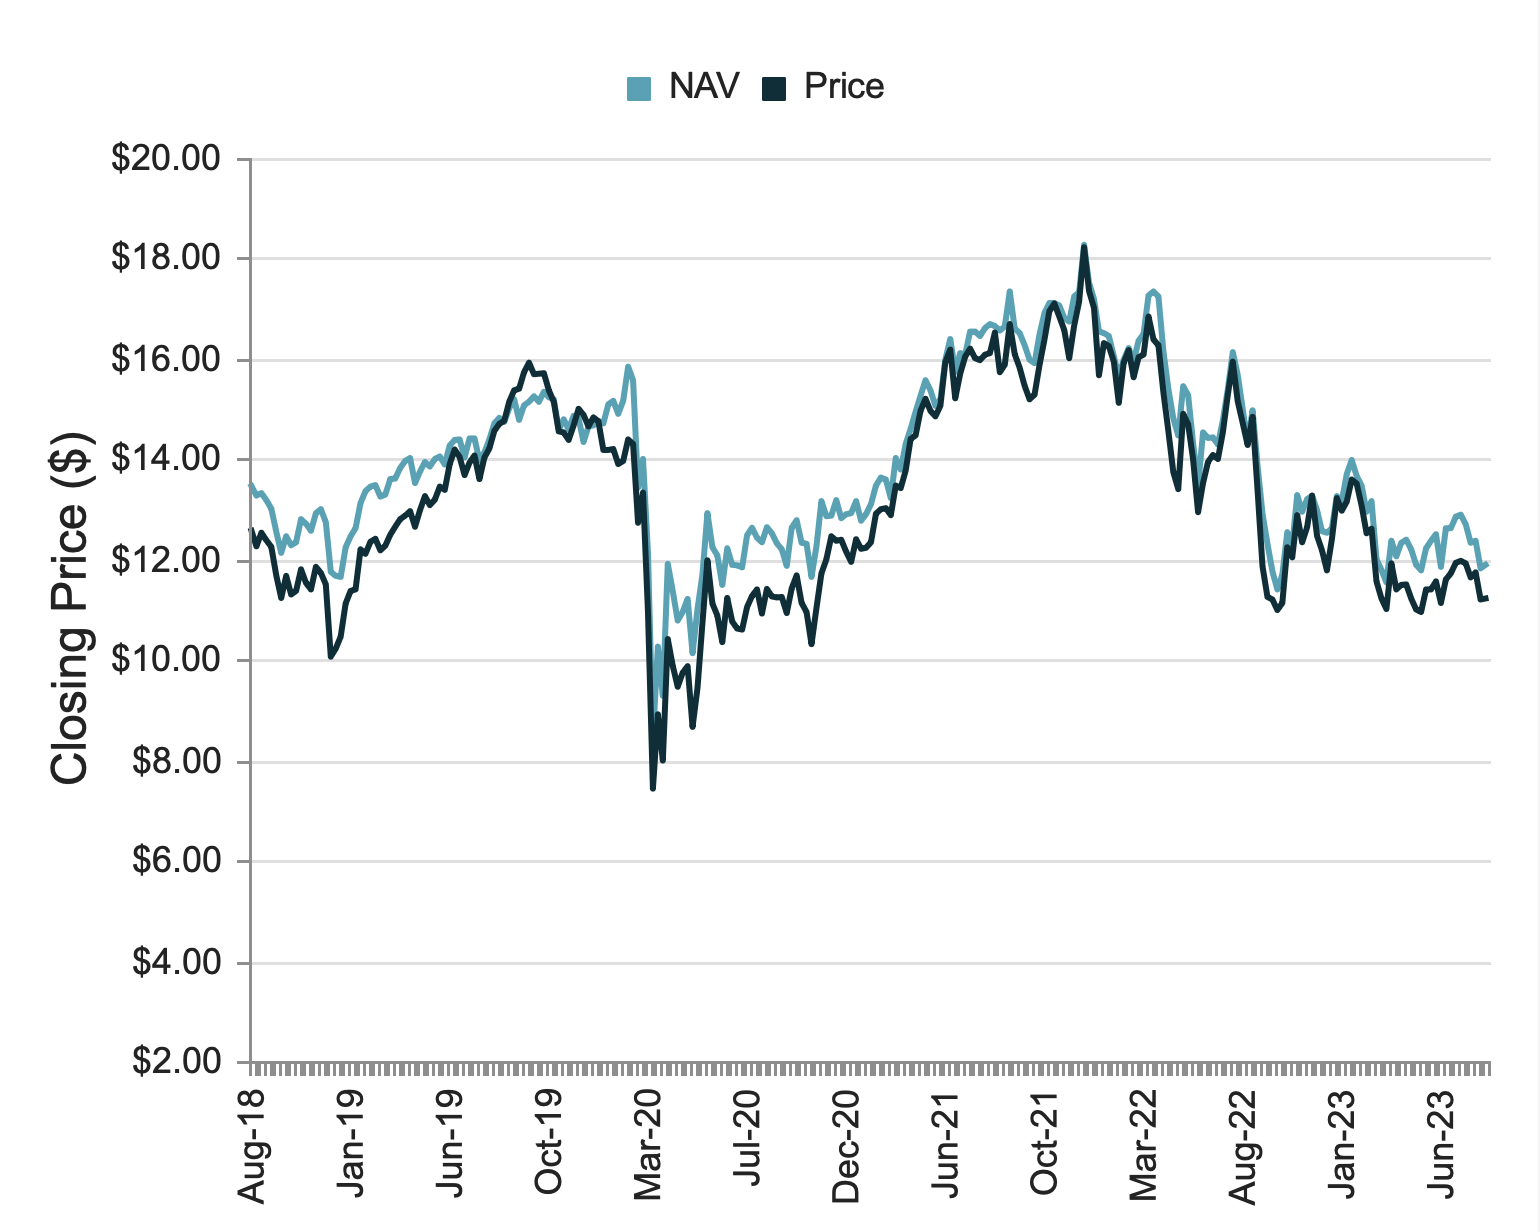
NAV and price
Below are the key current details concerning price and NAV:
- Net Asset Value : $12.14
- Share Price : $11.46
- Discount to NAV : 5.6% (compared to a 52-week average discount of 4.7%).
The 5.6% discount is greater than the one-year average, and looking at the chart below, it is clear that it is a discount which is within a standard range for RQI, but at the higher end. Historically, the price has been at a slight discount, but as REITs have increased, it has converged with NAV.
This creates an extra 5% share price increase in upcoming years.
Since inception in 2002, NAV has grown at a 9.16% CAGR, beating its blended benchmark and the S&P 500 (SP500).
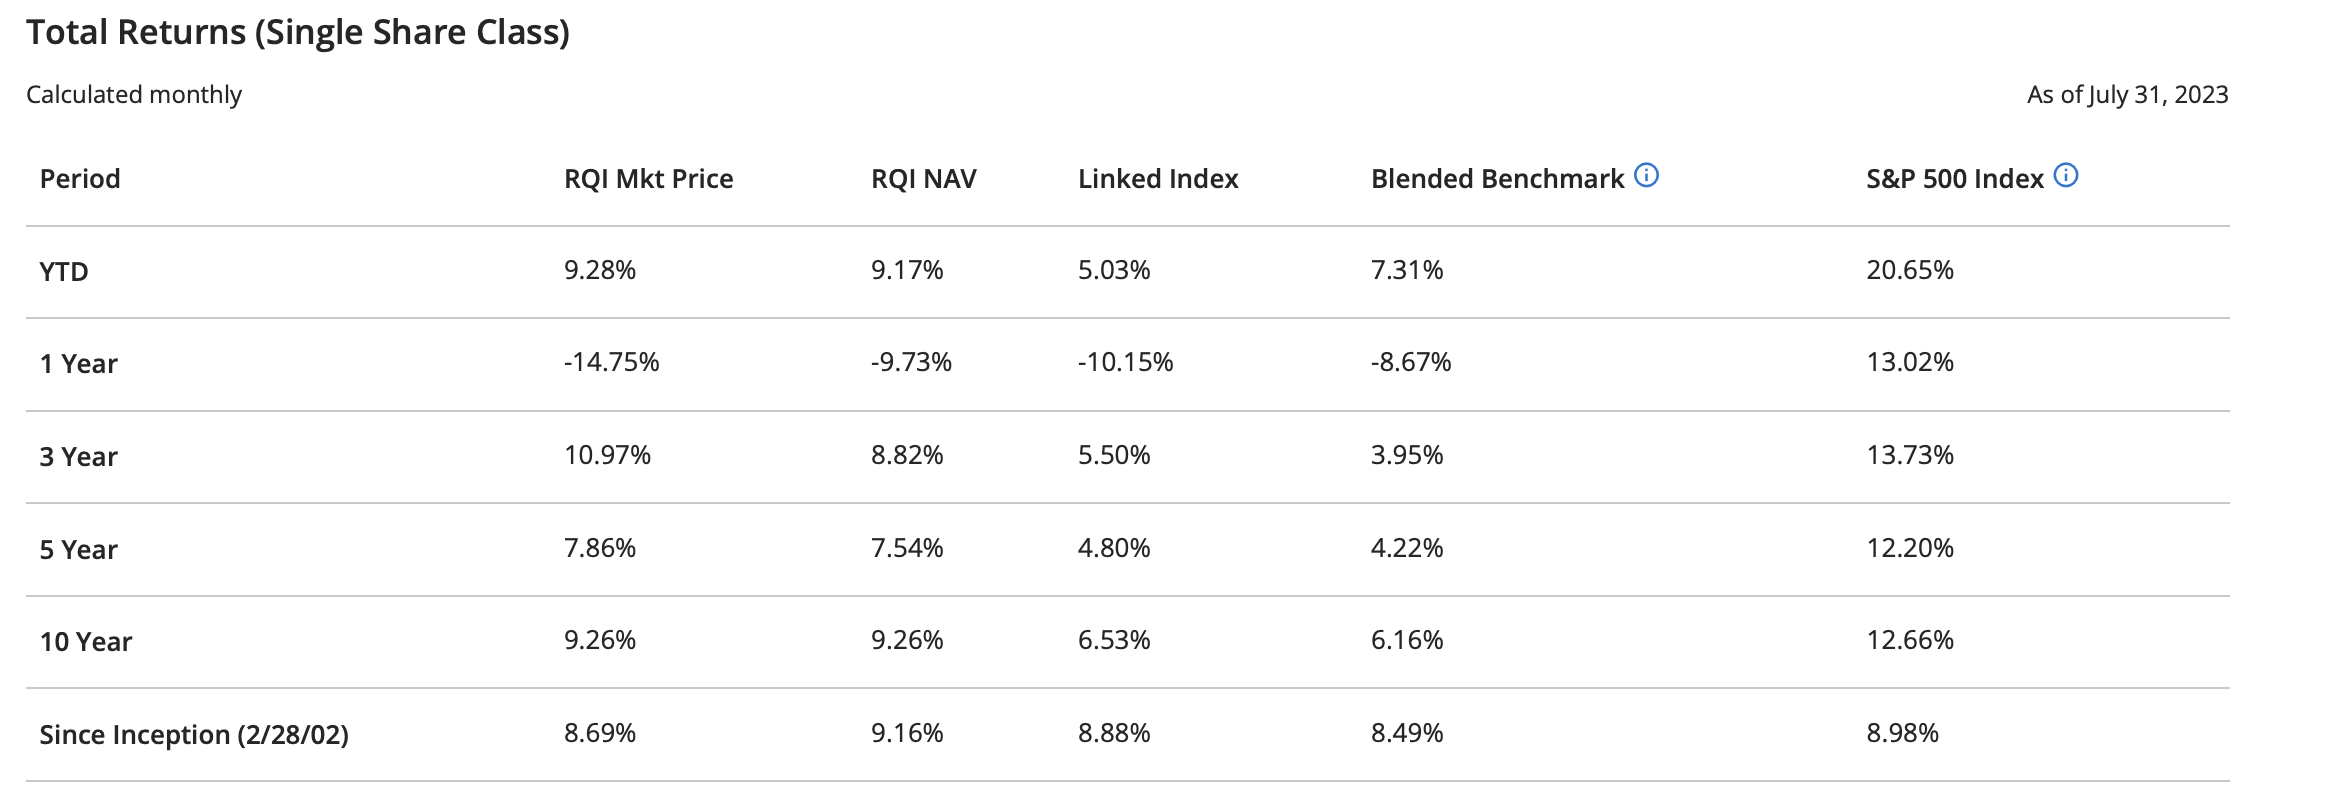
The share price has somewhat lagged, but this is mostly a function of the NAV and share price disconnecting somewhat.
What is clear is that RQI, through over two decades, has performed extremely well, as these returns are net of management's fees.
Distributions
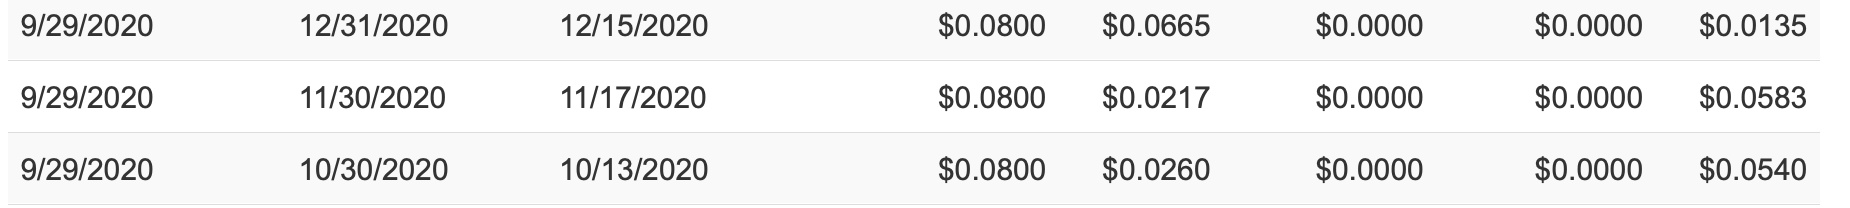
Finally, what we want to make sure of, is that the distributions aren't frequently returns of capital.
Short stints of capital returns have to be endured with CEFs when performance is below expectations, but we do not want them to be the norm.
Since 2010, only 3 months saw a return of capital from the distributions, in the 4th quarter of 2020.
(In the table below, the 5 last columns are distribution, and then the share from income, long returns, short returns, and return of capital respectively)
This is encouraging.
It means that RQI is able to engineer its 8.3% yield through investing in very high quality REITs, which yield a lot less, thanks to an astute inclusion of leverage, preffereds, and bonds.
I've included the top 10 positions in a watchlist, and as you can see, none of them are very high yielding REITs.
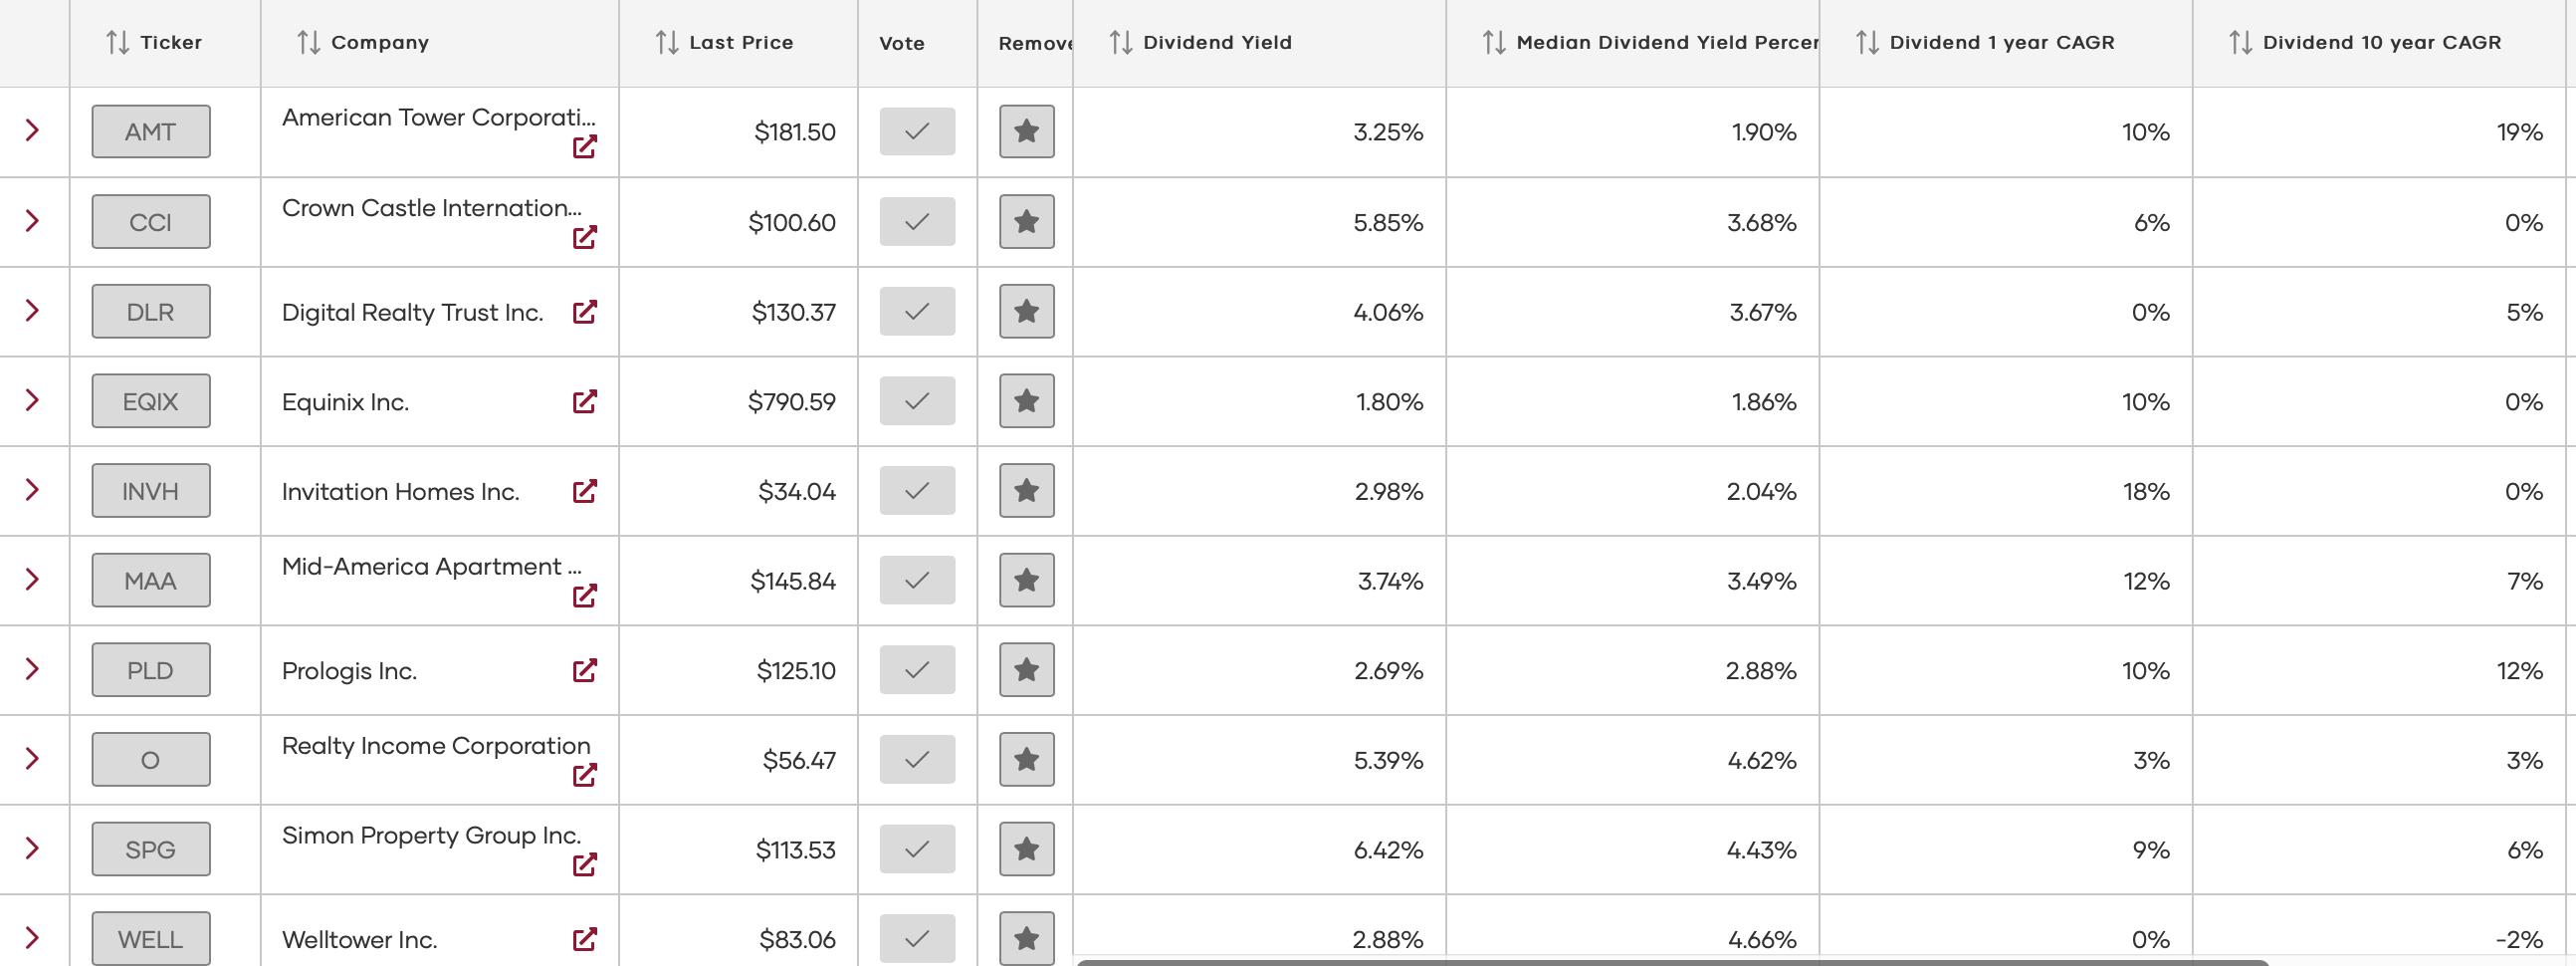
Conclusion
Cohen & Steers Quality Income Realty Fund seems to be a very well managed CEF.
If, like me, you are bullish on REITs, the extra leverage offers a great opportunity if REITs soar over the next 24 months, as I expect them to do.
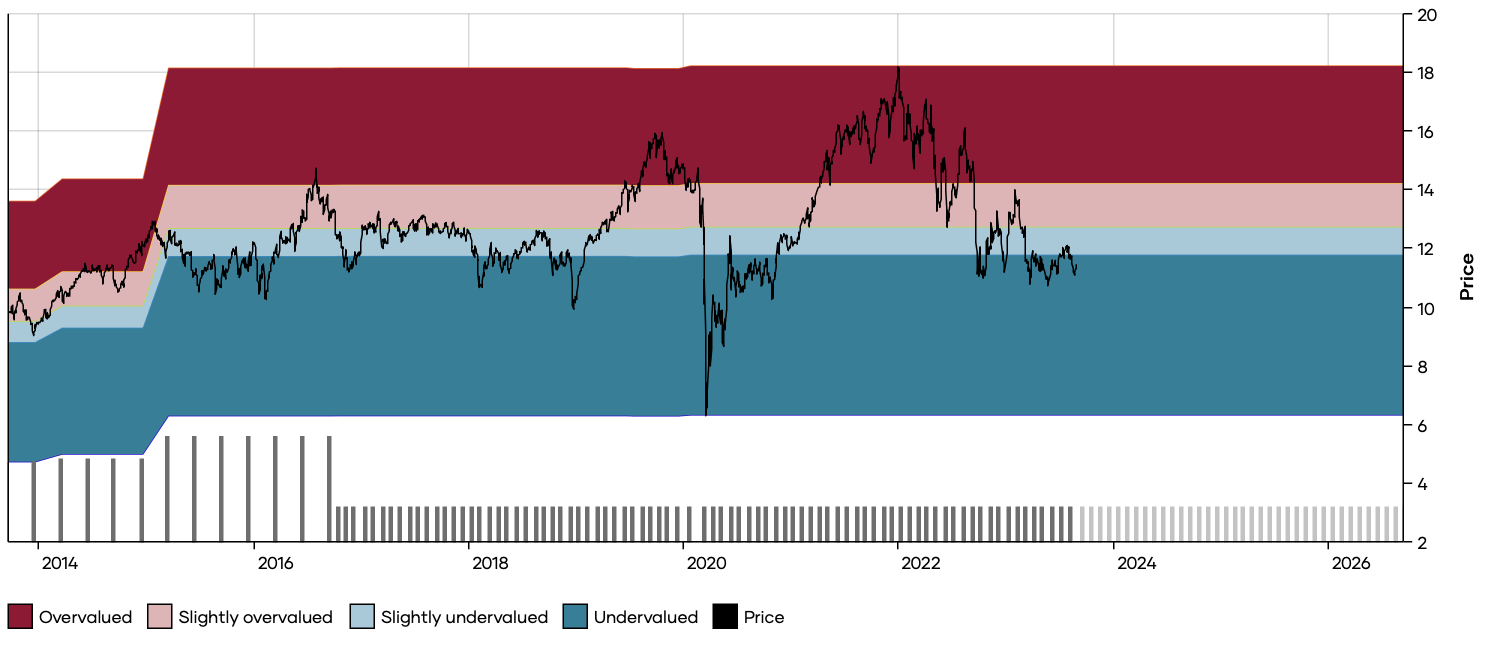
RQI DFT Chart (Dividend Freedom Tribe)
We are setting a buy for Cohen & Steers Quality Income Realty Fund below $13.7, which ensures a yield above 7%, and a sell above $18, which was the previous high and would be a good time to review the position.
For further details see:
Get An 8.3% Yield From Secure High-Quality REITs: RQI