LAND - Gladstone Land: Better Investment Than Farmland Partners
2023-08-22 07:30:00 ET
Summary
- Farmland REITs have been hit by lower crop yield, lower crop prices, and higher interest rate expenses, and share prices have suffered accordingly.
- Farmland remains a compelling investment, as world population continues to rise, while arable land per capita shrinks.
- There are only two U.S. Farmland REITs. We examine growth, balance sheet, dividend, and valuation metrics for the larger of the two, Gladstone Land.
- We also include extensive data comparing Gladstone Land to its smaller peer, Farmland Partners Inc., to illustrate a profound difference in the two companies' footing.
If you want to invest in Farmland REITs, there are only two games in town:
- Gladstone Land (LAND) and
- Farmland Partners Inc. (FPI)
Of these, one is arguably a decent investment at this time, and the other is most distinctly NOT .
This article focuses on Gladstone Land, but includes a great deal of data on FPI, by way of comparison and contrast.
As a sector, Farmland REITs were among the hottest in the REIT world last year, but this year stand near the bottom of the barrel, at an average total return of (-12.73)%.
Hoya Capital Income Builder
In their recent review of REIT earnings , Hoya Capital writes,
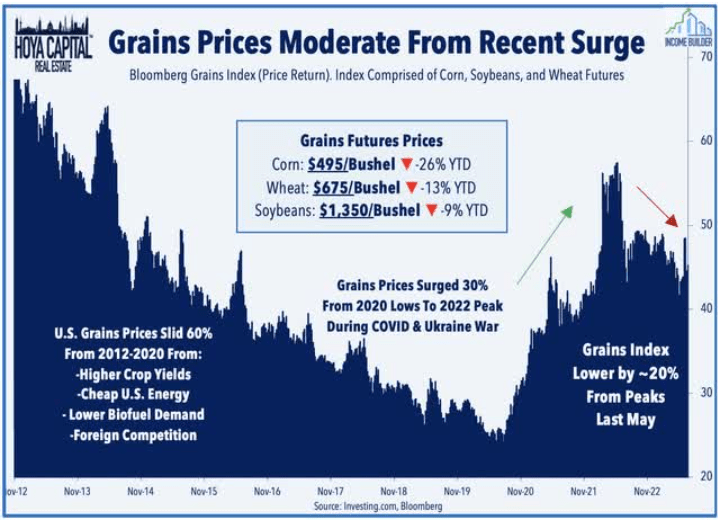
One of the hottest inflation-hedges last year, farmland REITs have been slammed over the past nine months amid a "triple whammy" of headwinds - lower crop yield due to extreme weather, lower crop prices, and significantly higher interest rate expense.
In general, almost 90% of all the farms owned by REITs are rented by small family farmers, accounting for nearly half the total acreage.
FPI investor presentation
Prices for corn, wheat, and soybeans, which account for about 75% of the total acreage in the U.S., have fallen significantly since the peak last May, a peak driven primarily by supply shortages resulting from the war in Ukraine.
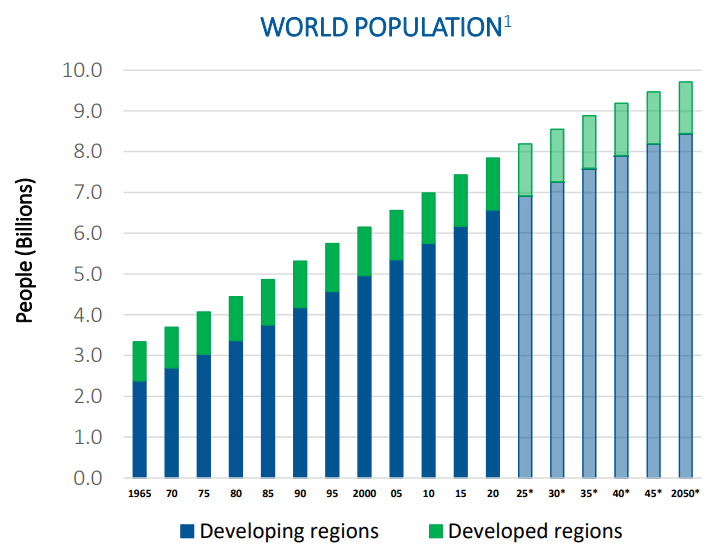
Nevertheless, the world's population continues to grow,
United Nations, Department of Economic and Social Affairs, Population Division
while the amount of arable land continues to shrink.
World Bank
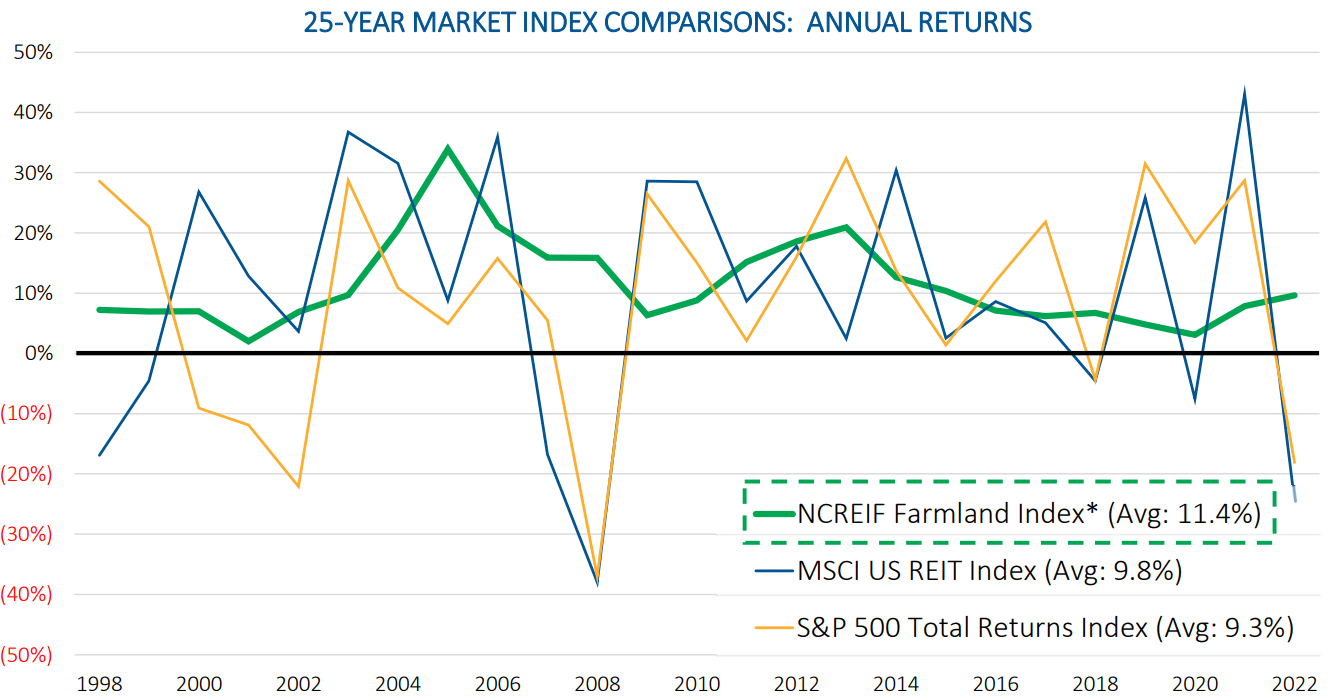
Therefore, farmland itself is increasingly valuable. Over the past 25 years, farmland has increased in value (annual average 11.4%) faster than the S&P 500 (9.3%), and faster than the MSCI Reit Index (9.8%), with less volatility than either.
This article is for investors who want to increase their exposure to farmland, and focuses on the slightly larger of the two Farmland REITs.
Meet the company
Gladstone Land
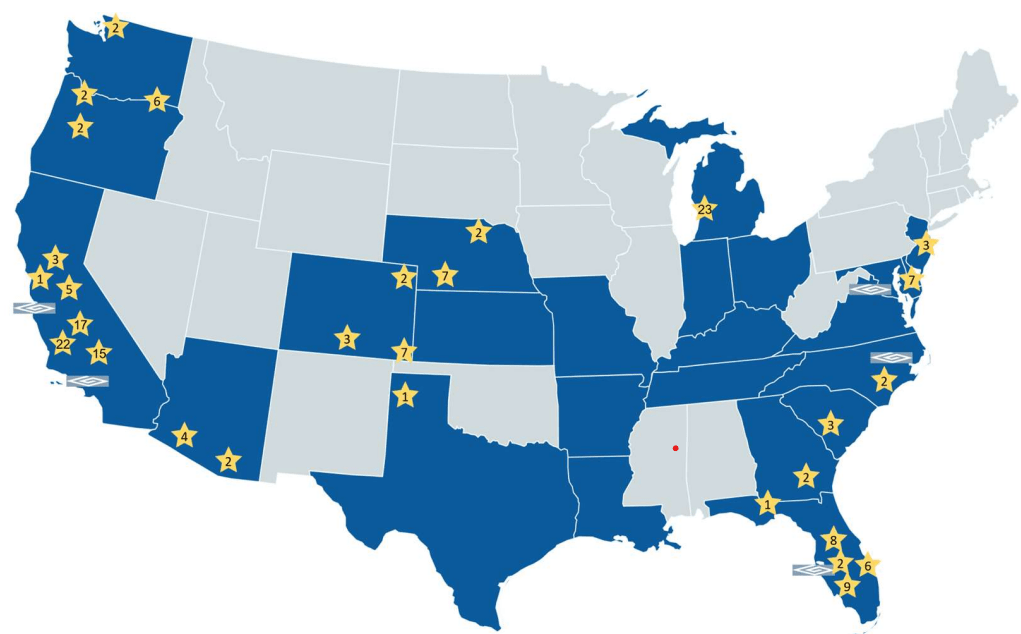
Founded in 1997 and headquartered in Virginia, Gladstone Land owns 169 farms totaling 116,000 acres across 15 U.S. states, leased to independent and corporate farmers, usually on a triple-net basis, plus 45,000 acre-feet of banked water in California. The weighted average remaining lease term is 6.5 years. The total value of LAND's portfolio is about $1.6 billion, and the company's market cap is approximately $556 million.
The heaviest concentrations of LAND holdings are in California (63 farms totaling 34,844 acres), Colorado (12 farms totaling 32,773 acres), and Florida (26 farms totaling 22,606 acres). These three states account for 60% of LAND's farms and 78% of the company's acreage.
The company focuses on farmland that grows fresh produce, such as fruits and vegetables, because if offers:
- higher profitability and rental income,
- lower volatility, storage cost, and government dependency, and
- closer proximity to major urban areas
than land growing commodity crops like corn, wheat, and soy. The closer location to major cities also means greater development potential for higher and better use.
Over the past 25 years, fresh produce has increased in price faster than the Consumer Price Index, and faster than the food and beverage index.
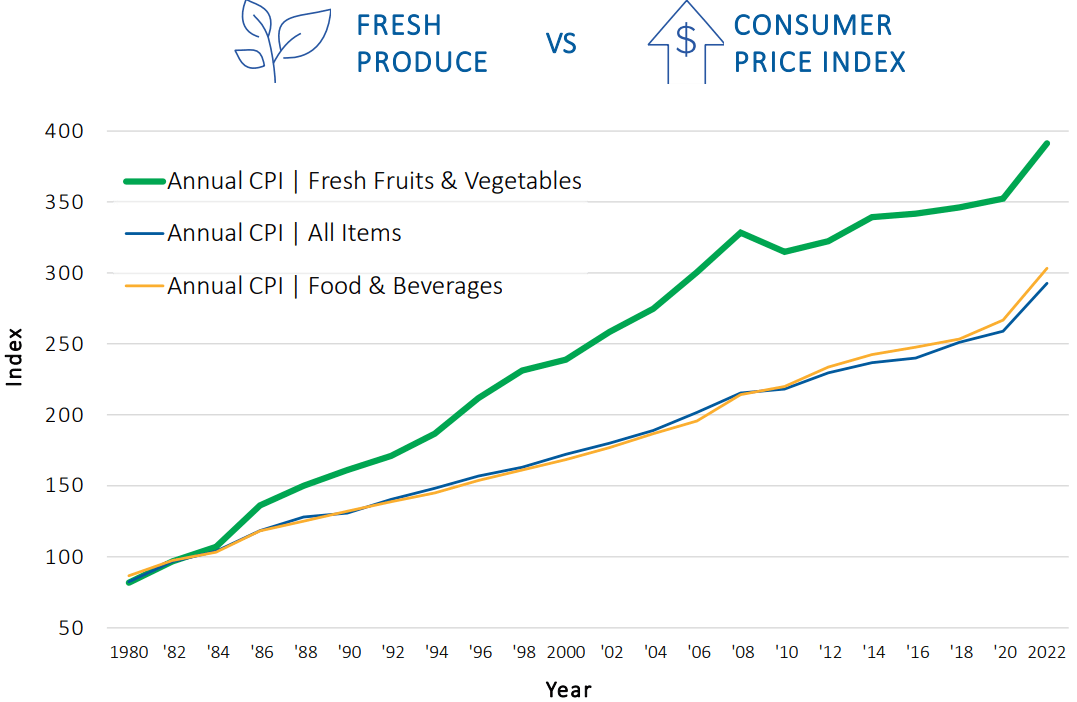
There is ample room for external growth through acquisitions. There is almost $3 trillion worth of U.S. farmland, and 86% of it is under family ownership.
Company investor presentation
However, acquisitions by this company will not be rapid in the near future, according to LAND CEO David Gladstone, who said this on the quarterly earnings call .
Costs to finance new acquisitions have continued to increase, but farm owners have not yet reduced the price at which they are willing to sell their farms. Given the continued high farmland prices, it has become more challenging to find acquisitions that yield enough to cover our rising cost of capital.
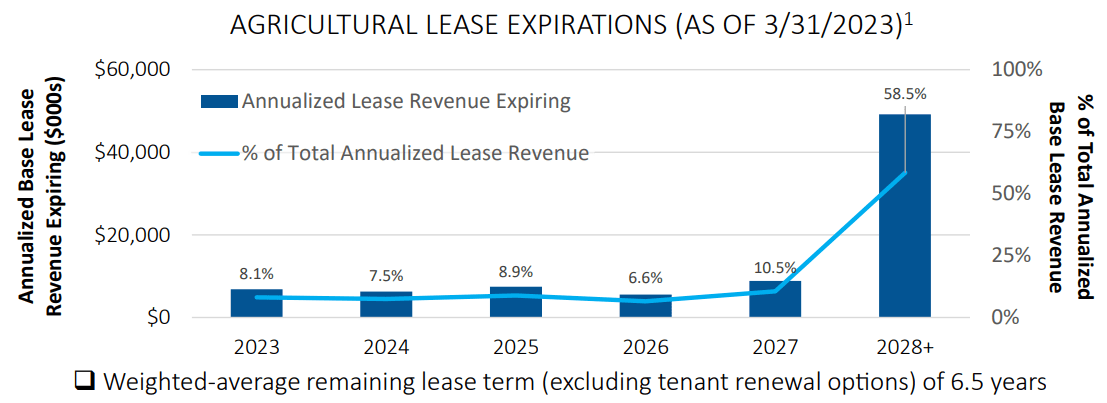
Meanwhile, LAND's lease expirations over the next 5 years are very even, averaging about 8.3%.
Quarterly results
Gladstone reported mixed results for Q2. Net income of $0.05 per share was up from an 11-cent loss in Q2 2022. AFFO was down (-15.0)% YoY (year-over-year), at $0.11 per share, and FFO was down (-8.7)%. Cash lease revenues were up 2.5%. Cash from operations leapt 51% YoY, to $17.9 million. The company issued another 1.16 million shares, upping the share count by just 3.3% YoY, and reduced its indebtedness by a whopping 9.5%.
By contrast, Farmland Partners significantly lowered its full-year FFO outlook, as a result of rising interest expense from their variable-rate exposure (see below). FPI now expects its full-year FFO to dive more than 50% this year, but to levels that are still about 12% above its pre-pandemic level.
Growth metrics
Here are the 3-year growth figures for FFO (funds from operations), and TCFO (total cash from operations) for LAND.
| Metric |
| 2019 |
| 2020 |
| 2021 |
| 2022 |
| 3-year CAGR |
| FFO (millions) |
| $10.6 |
| $14.5 |
| $21.0 |
| $24.2 |
| -- |
| FFO Growth % |
| -- |
| 36.8 |
| 44.8 |
| 15.2 |
| 31.7% |
| FFO per share |
| $0.54 |
| $0.65 |
| $0.69 |
| $0.74 |
| -- |
| FFO per share growth % |
| -- |
| 20.4 |
| 6.2 |
| 7.2 |
| 11.1% |
| TCFO (millions) |
| $21.4 |
| $25.0 |
| $32.4 |
| $43.8 |
| -- |
| TCFO Growth % |
| -- |
| 16.8 |
| 29.6 |
| 35.2 |
| 27.0% |
Source: TD Ameritrade, Hoya Capital Income Builder, and author calculations
LAND is that rare REIT that kept FFO growing steadily, right through the pandemic, posting FROG-worthy stunning double-digit revenue growth across the board.
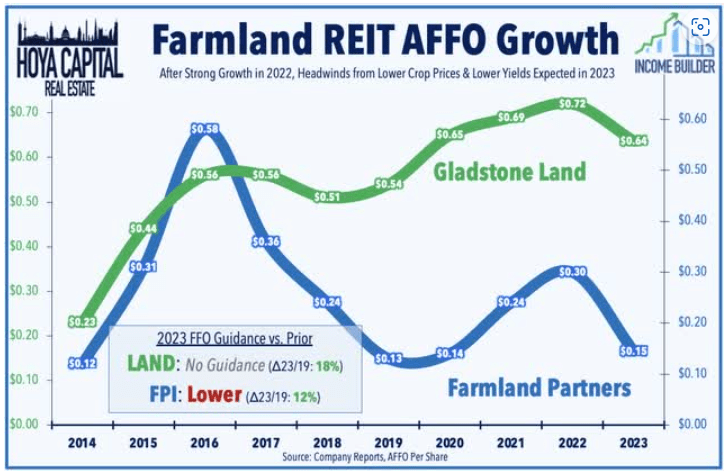
By contrast, FPI's AFFO dived from $0.58 per share to $0.13 per share in the three years prior to the pandemic, and after booming to $0.30 per share last year, have plummeted back to $0.15 this year. The trailing 3-year CAGR for FPI's growth in AFFO is just 4.89%.
Meanwhile, here is how the stock price has done over the past 3 twelve-month periods, compared to the REIT average as represented by the Vanguard Real Estate ETF ( Vanguard Real Estate Index Fund ETF Shares (VNQ) Stock Price Today, Quote & News).
| Metric |
| 2020 |
| 2021 |
| 2022 |
| 2023 |
| 3-yr CAGR |
| LAND share price Aug. 18 |
| $15.93 |
| $23.38 |
| $24.90 |
| $15.52 |
| -- |
| LAND share price Gain % |
| -- |
| 46.8 |
| 6.5 |
| (-37.7) |
| (-0.9)% |
| VNQ share price Aug. 18 |
| $81.42 |
| $105.55 |
| $100.58 |
| $80.44 |
| -- |
| VNQ share price Gain % |
| -- |
| 29.6 |
| (-4.7) |
| (-20.0) |
| (-0.4)% |
Source: MarketWatch.com and author calculations
Both the VNQ and shares of LAND have been essentially flat over the past 36 months at (-0.4)% and (-0.9)% respectively, but with considerable volatility.
By contrast, FPI shares have leapt from $6.92 to $10.87 over the same period, an average annual increase of 16.25%, presenting an excellent opportunity to take profits.
Balance sheet metrics
Here are the key balance sheet metrics. LAND has a strong Liquidity Ratio of 2.06 compared to a slightly sub-par 1.86 for FPI. While LAND's Debt/EBITDA of 7.6 is not good, FPI's mark of 14.2 is atrocious.
| Company |
| Liquidity Ratio |
| Debt Ratio |
| Debt/EBITDA |
| Bond Rating |
| LAND |
| 2.06 |
| 39% |
| 7.6 |
| -- |
| FPI |
| 1.86 |
| 36% |
| 14.2 |
| -- |
Source: Hoya Capital Income Builder, TD Ameritrade, and author calculations
LAND has no exposure to variable rate debt, whereas 12.4% of FPI's debt is held in variable-rate loans. This represents a significant drain on FFO for FPI.
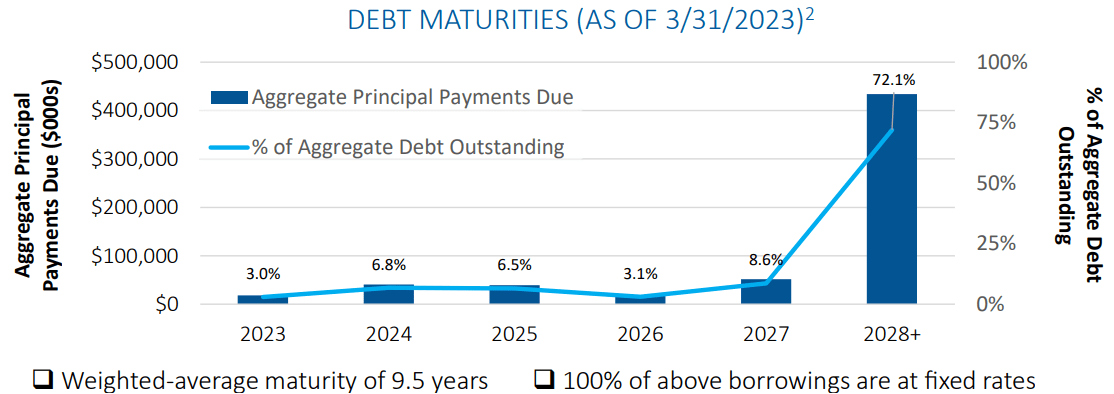
LAND's debt maturities are very favorable. Only 3% of the debt comes due this year, and over the next 5 years, a total of only 28%. Weighted average debt maturity is 9.5 years, at a low 3.34% interest rate. Total indebtedness of $657 million accounts for 35% of the company's capitalization.
Dividend metrics
While both companies pay below-REIT-average dividends, LAND is a much better dividend payer than FPI, with a Dividend Score of 3.47 versus 2.40.
| Company |
| Div. Yield |
| 5-yr Div. Growth |
| Div. Score |
| Payout |
| Div. Safety |
| LAND |
| 3.39% |
| 0.80% |
| 3.47 |
| 70% |
| D+ |
| FPI |
| 2.15% |
| 3.71% |
| 2.40 |
| 80% |
| -- |
Source: Hoya Capital Income Builder, TD Ameritrade, Seeking Alpha Premium
Dividend Score projects the Yield three years from now, on shares bought today, assuming the Dividend Growth rate remains unchanged.
There is some danger of a dividend cut for both companies.
Valuation metrics
Valuation is another area in which LAND has a clear edge, selling for 22.9x FFO '23, while FPI's price multiple remains absurd, at 72.7x. I wrote an article in January, arguing that FPI was grossly overvalued. The company's share price has lost 17% since then, but remains far too high, in my view. LAND, while not a great dividend payer, still pays better and costs less than FPI.
| Company |
| Div. Score |
| Price/FFO '23 |
| Premium to NAV |
| LAND |
| 3.47 |
| 22.9 |
| (-5.9)% |
| FPI |
| 2.40 |
| 72.7 |
| (-9.4)% |
Source: Hoya Capital Income Builder, TD Ameritrade, and author calculations
The company calculates its NAV as $19.15 per share, as shown in its latest quarterly earnings release . If this is accurate, the current discount to NAV of 19.0% is much more substantial than the analyst consensus shown in the table above.
Value of Farmland
Thus, from an operational standpoint, LAND is clearly a better choice than FPI at the moment. Given the metrics we have just reviewed, the only conceivable reason for preferring FPI over LAND would be if you think FPI's land holdings are intrinsically more valuable that LAND's, or are likely to gain in value more rapidly.
According to the US Dept. of Agriculture, farmland values averaged $3,800/acre for 2022, up $420/acre (12.4%) from 2021. Crop and farmland in California is the most valuable at over $10k/acre, followed by the Midwest at $6-8k per acre and the Southeast at $4-5k/acre.
Let's see how the two Farmland REITs are situated geographically. LAND is more heavily concentrated on the West Coast, with 28% of its acreage in California, 30% in midwestern Colorado, and 29% in the former Confederate states.
Hoya Capital Income Builder
By contrast, FPI's holdings are much more concentrated in the Midwest, with 51% in the high plains and the corn belt, and another 43% in the Old South, and only 6% in the comparatively more valuable California acreage.
FPI owns more land, at 163,000 acres versus LAND's 116,000, but the book value of that land is less. FPI's portfolio is worth $1.1 billion, according to the company's own calculations , while LAND's portfolio is worth $1.6 billion.
So with a more valuable portfolio, positioned better to capture increases in the value of the land itself, LAND has the edge here too.
What could go wrong?
Extreme weather remains a threat to the viability of farmer tenants and their crops. A "higher for longer" interest rate environment constrains Farmland REITs' ability to acquire new land. Crop prices are subject to extreme volatility. The average age of tenant farmers is somewhat advanced, at 58 years old, raising the risk of tenant default due to death or ill health.
Investor's bottom line
In their recent review of REIT earnings season, Hoya Capital had this to say:
Beyond their utility as the most direct "land play," we remain optimistic about the long-term value-creation for ... farmland REITs on the expectation of continued global market share gains for North American agricultural commodities producers. After trading at steep premiums for much of 2021 and 2022, downward pressure on Farmland REITs in recent months has brought valuations to reasonable levels for long-term investors.
Clearly, that author was not referring to FPI, whose valuations based on anticipated revenues remain absurd. In the Farmland REIT sector, he can only be referring to LAND, whose price he considers to be 11% undervalued.
Of the two Farmland REITs, only one is a reasonable investment as of today, and that is Gladstone Land. Farmland Partners remains a clear Sell. While I rate LAND a Hold, it is clearly the better choice for investors wanting to increase their exposure to Farmland REITs.
Professional opinions on both companies are almost identical, with Wall Street analysts covering the companies recommending Buy, the Seeking Alpha Quant ratings system recommending Sell, and both TipRanks and The Street showing Hold. Only Zacks differentiates, with a Hold rating on LAND, and a Sell on FPI.
As always, however, the opinion that matters most is yours.
For further details see:
Gladstone Land: Better Investment Than Farmland Partners