IAUM - GLD: Buy The Market Corrections
Summary
- Inflation is also aided by a tight labour market, and Federal Reserve is expected to maintain interest rates higher for an extended period.
- Central banks continue to add gold reserves, and 2022 was the strongest year for gold demand in over a decade.
- The gold market is on track to rise significantly, and market corrections are viewed as buying opportunities.
SPDR Gold Trust ( GLD ) is a favourite gold market investment due to its convenience, liquidity, and accessibility. GLD is one of the largest ETFs, with high liquidity and easy to trade, regardless of market volatility. In recent weeks, GLD demand has increased as a result of robust buying from central banks and the decline of the US dollar over the past few months. However, the spot gold price ( XAUUSD:CUR ) has reached the $1,975 target and a correction is underway.
This article discusses the fundamental and technical aspects of the gold market in light of recent employment data, central bank activities, price action analysis, and the weakness of the U.S. dollar. Despite interest rates exceeding 4%, the unemployment rate is extremely low and inflation remains high. The employment data indicate a tight labour market in the United States, which increases the likelihood of further inflation and higher interest rate. The recent recovery of the U.S. dollar index from significant support level forces the gold market drops back towards the significant support level of $1,820 to $1,830. A correction in the gold market to strong support is viewed as a strong buying opportunity for gold investors.
Employment Data Analysis
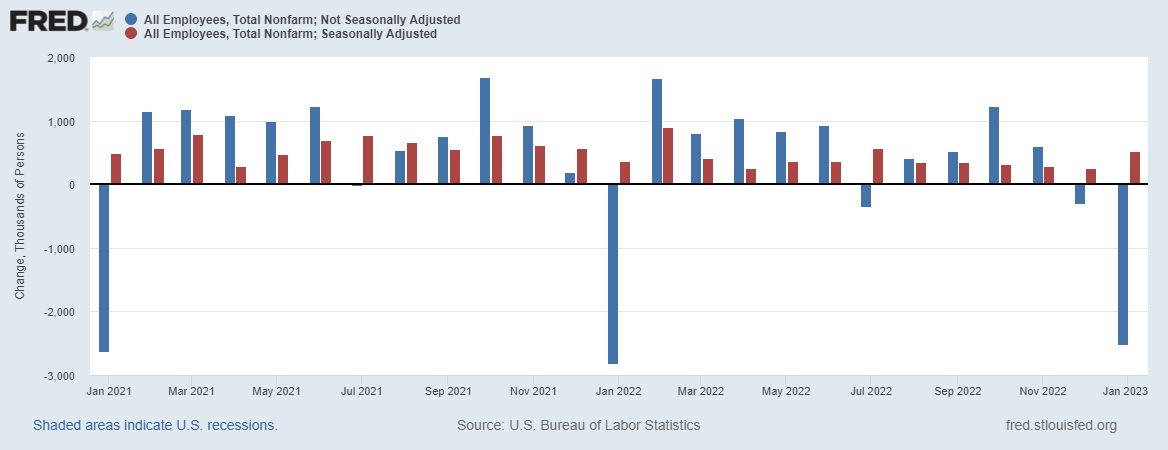
The chart below presents the total nonfarm of seasonally and without seasonally adjusted data. A gain of 517,000 jobs is observed in January 2023, whereas the unadjusted number indicates a seasonal loss of 2.5 million jobs. The total nonfarm without seasonally adjusted is the unadjusted number of jobs in the nonfarm sector of the economy, excluding seasonal adjustments. This number is more volatile and subject to short-term fluctuations in hiring, but it provides a clearer picture of the current employment situation in the nonfarm sector. According to " The Challenger Report ", US-based employers eliminated 102,943 jobs in January 2023, a 136% increase over the previous month's job losses. The adoption of automation and technological advancement has resulted in a large number of job losses in certain industries. A large number of job losses lead to increased uncertainty and market volatility, which causes investors to flock to safe-haven assets such as gold.
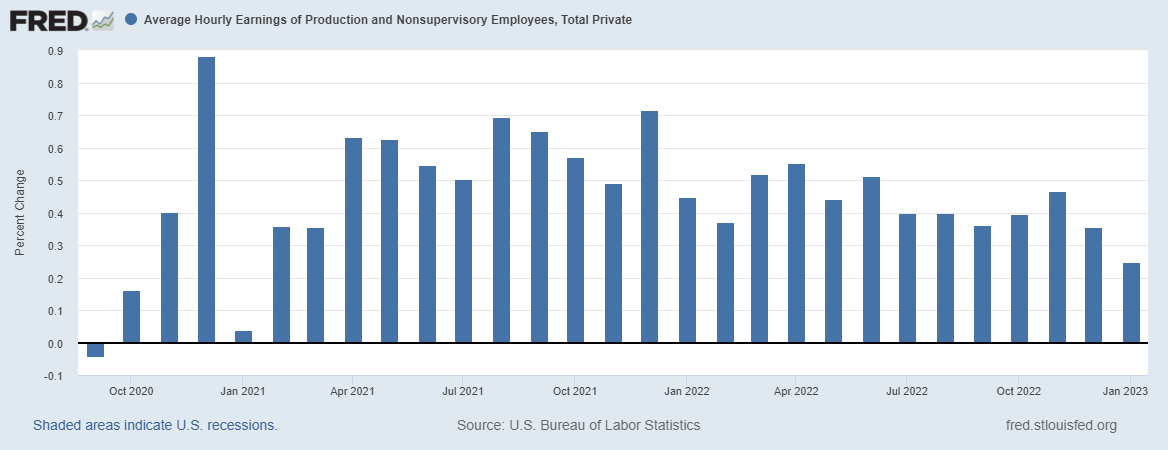
Typically, the average hourly earnings tend to rise with the increase in employment, as there is great demand for labour and employers are willing to pay higher wages to attract workers. However, average hourly earnings also fell to 0.25% or 3.0% annualized, as seen in the chart below. In general, moderate wage growth is viewed as consistent with a healthy economy. On the other hand, rapid wage growth is a sign of overheating and may lead to inflation, which the Federal Reserve attempts to prevent from escalating to dangerous levels. Therefore, I think that the Federal Reserve may encourage a decline in the average hourly wage.
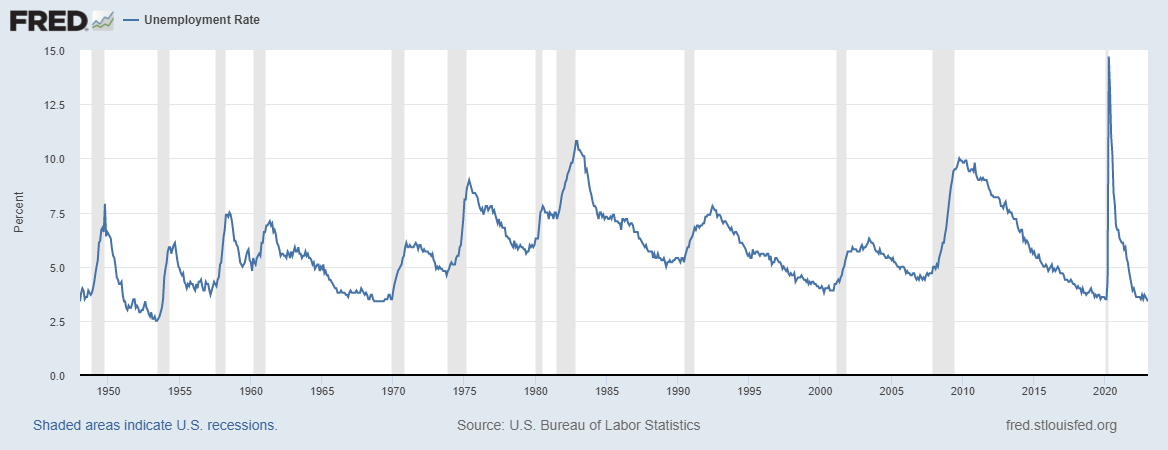
The seasonally adjusted unemployment rate, on the other hand, falls below 3.4%, the lowest level since 1969 as seen in the chart below. The low unemployment rate is indicative of a tight labour market and leads to wage and price inflation. Employers compete for workers in a tight labour market, which results in higher wages and prices for goods and services. If the unemployment rate remains low, it will be difficult for the Fed to control inflation, which will lead to economic instability. While the Consumer Price Index ((CPI)) remains at 6.42% despite an increase in interest rates above 4%, the Fed will likely keep the interest rates higher for a longer period.
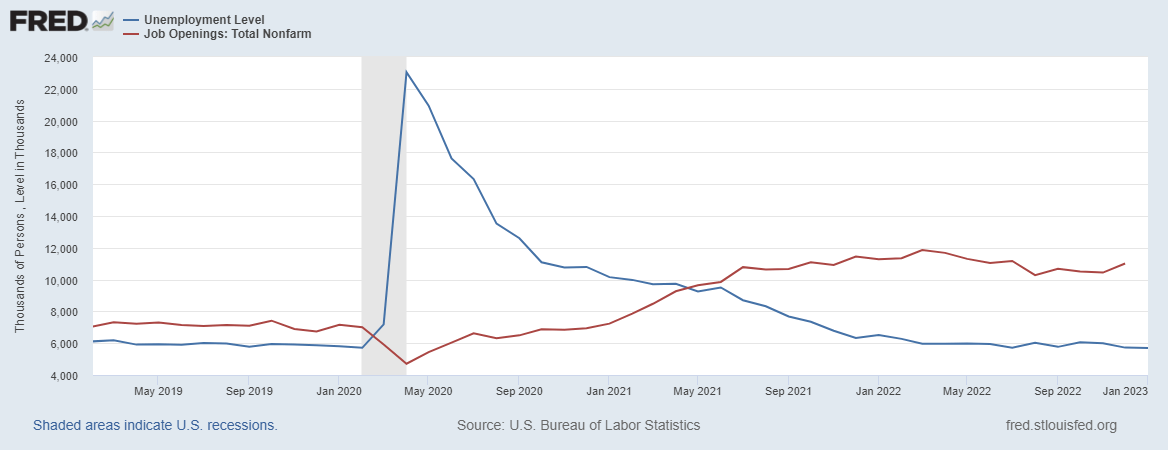
Another indicator of a tight labour market is depicted in the chart below. The gap between the number of job openings and the unemployment level has grown to 5.3 million. When the gap between the number of job openings and the unemployment rate is large, it indicates that there are a large number of job openings and a severe lack of qualified applicants. Employers typically offer higher wages and benefits to attract and retain workers in a more competitive labour market. This is an indication of a strong economy and a tight labour market, which, if sustained, can lead to higher inflation.
On the basis of the above discussion, it is found that the tight labour market and low unemployment rate also contribute to inflation, which remains out of control despite interest rate hikes above 4%. Therefore, inflation is uncontrollable and will persist for the foreseeable future, and the Fed is likely to raise interest rates further in 2023. The higher interest rates may increase the demand for gold as a hedge against uncertainty.
Central Banks Buy Gold Reserves
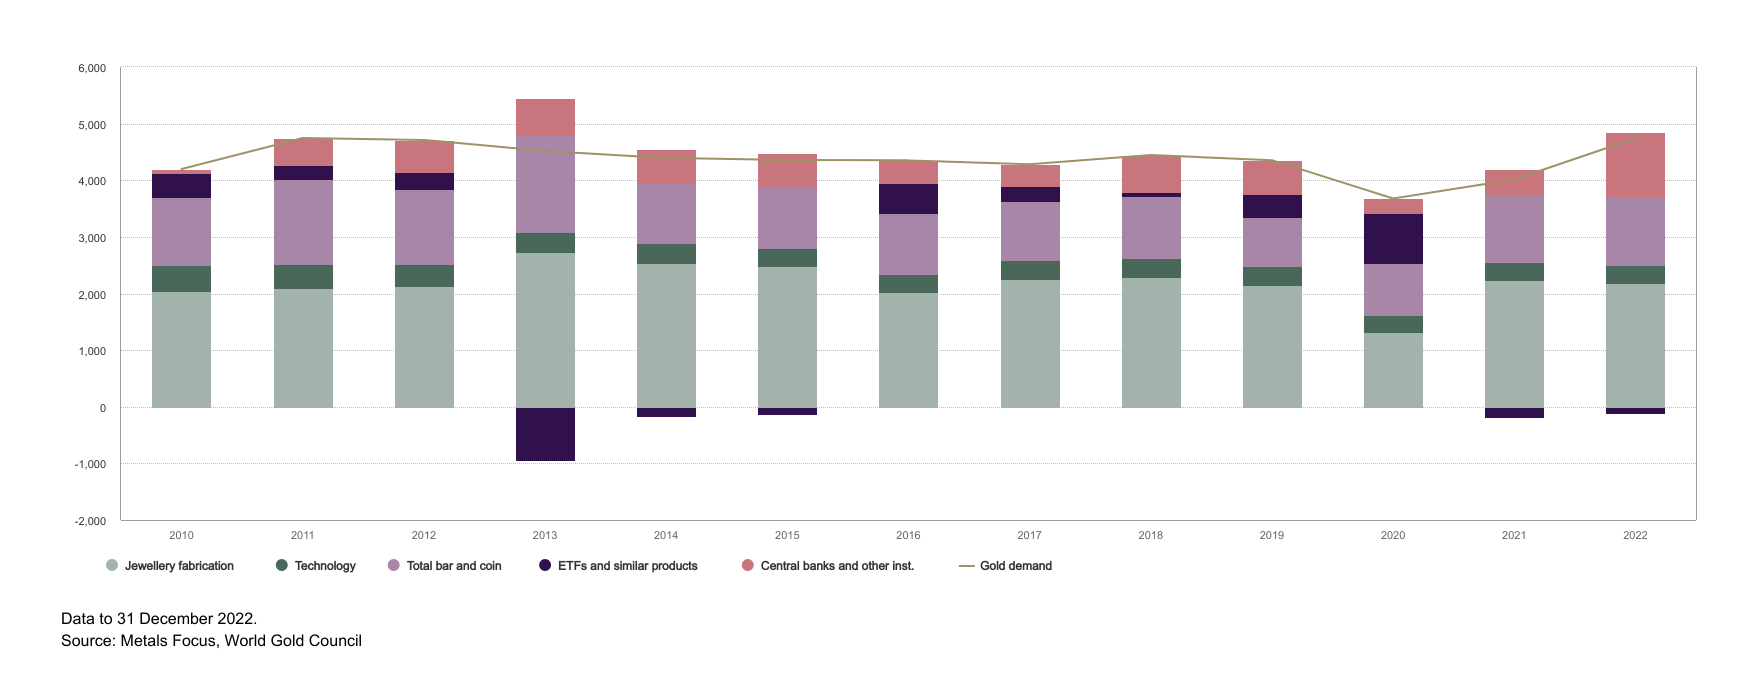
Central banks continue to buy gold, which is excellent news for gold investors. It has been observed that 2022 was the strongest year for gold demand in over a decade. According to "World Gold Council", annual gold demand increased by 18% to 7,741 tonnes, which is very close to the demand in 2011. Due to high inflation and high gold prices, jewelry consumption fell by 3% in 2022. Similarly, gold demand in technology fell by 7% as a result of the global economic conditions that reduced demand for consumer electronics. Despite a drop in demand in some sectors, gold demand is increased by central bank purchases, which exceed 400 tonnes in each of the last three quarters of 2022. Central banks are likely to increase gold reserves further in order to protect balance sheets from the depreciation of the Dollar and Euro. The chart below presents the gold demand in tonnes which shows a significant improvement in 2022.
Gold Correction Is Bullish Sign
As discussed in the previous article of GLD , the gold market is preparing for the next upswing, and consequently, prices are contracting within a wide range. The consolidation range lies between $1,680 and $2,075, with both figures serving as pivots. Based on the previous article, the formation of the cup and handles and the projection of the next rally, spot gold prices are expected to surpass $8,000/ounce, if the pivot of $2,075 is broken. Since the price is trading in a wide range, this rally requires patience, as prices typically move in both directions to clear stops on both sides of the trade before the primary move. The recent drop in the gold market is a result of the strong rebound in the US dollar index from the solid support. Due to the strength of the $2,075 pivot point, it will be difficult for the market to breach it.
US Dollar Weakness
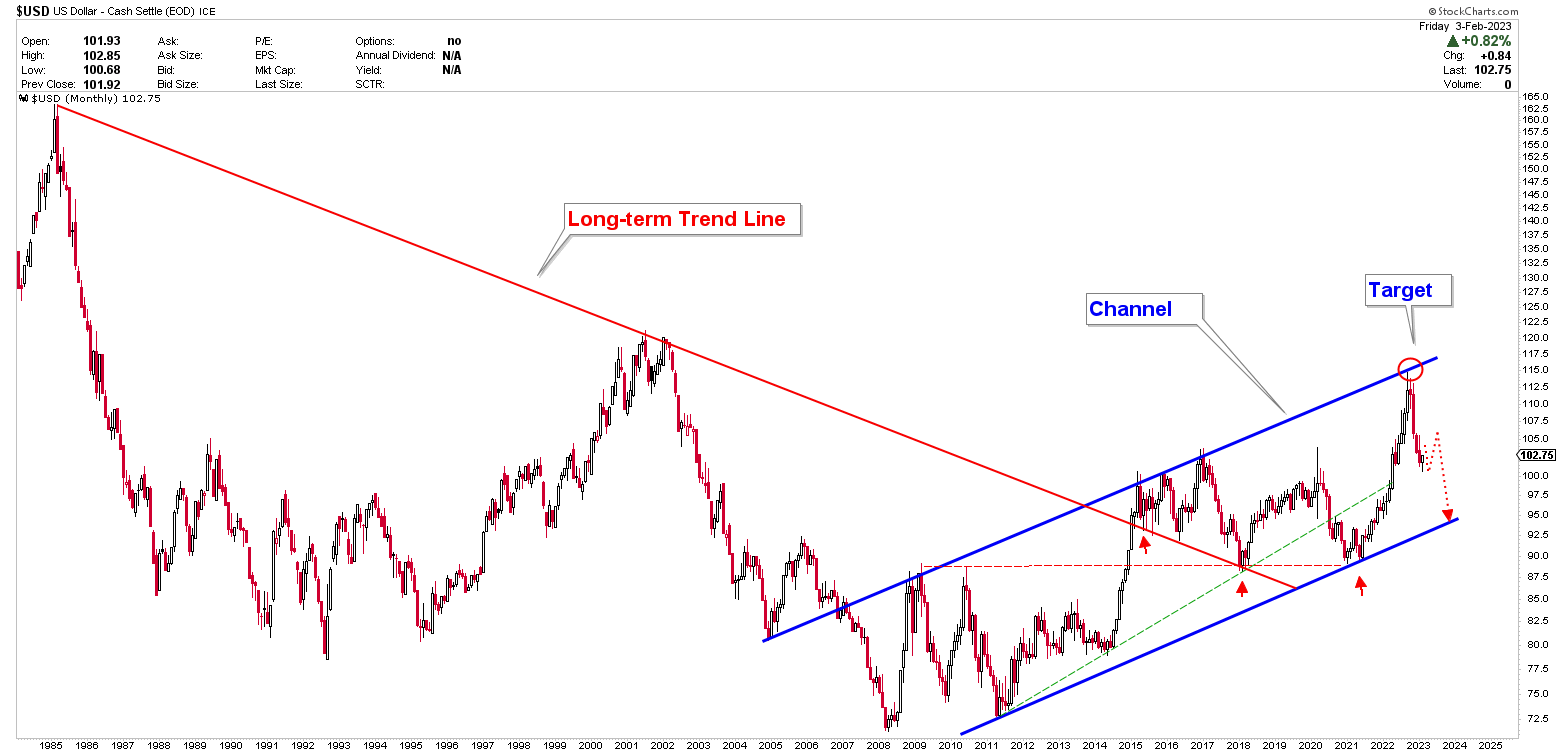
The chart below depicts the long-term view of the US dollar index, demonstrating that the US dollar index's long-term objective was fulfilled. Currently, the US dollar is declining from the long-term objective and remains extremely bearish. The decline in the U.S. dollar index is interpreted as gold market strength. Currently, gold is correcting lower due to the short-term strength in the US dollar index.
Gold Market Key Levels
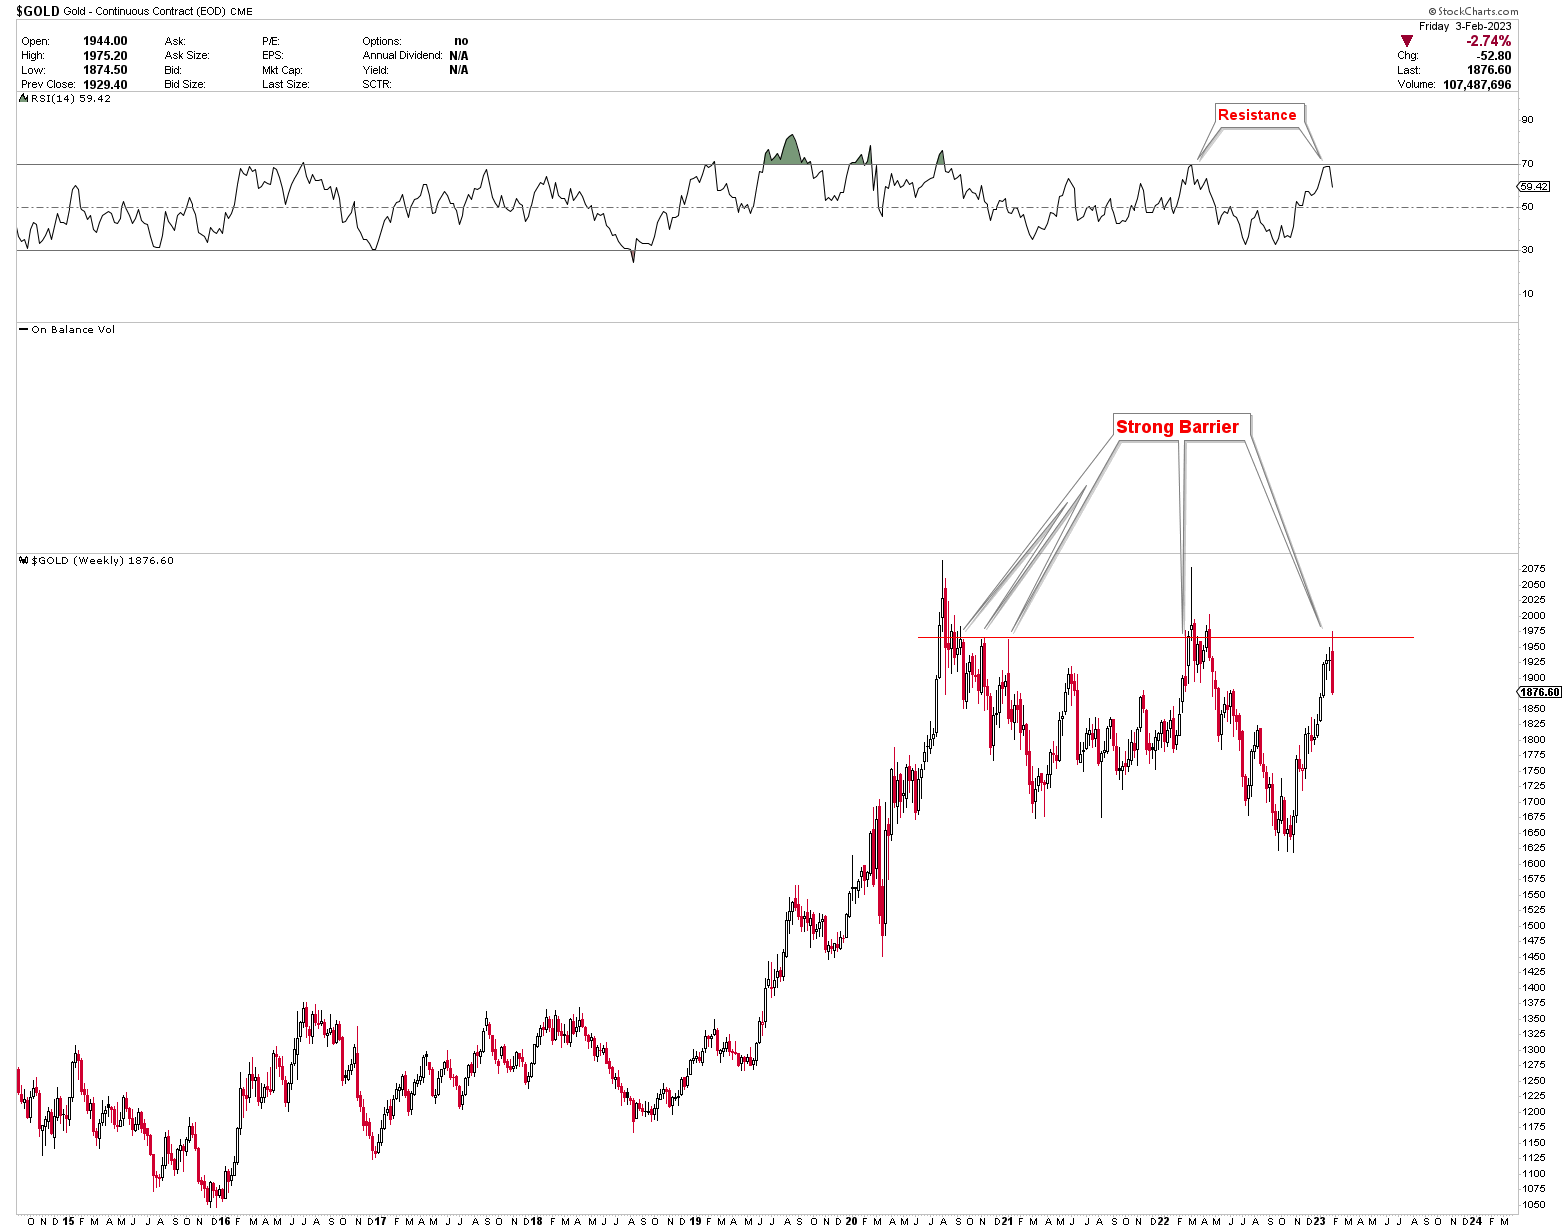
While the US dollar is rebounding from the strong support, the gold market is also dropping from the strong barrier as seen in the chart below. The strong barrier is also observed in the RSI which hits the 70 level when the spot gold price hit $1,959 on the weekly chart.
The chart below depicts the daily outlook for the gold market, which indicates that the market is emerging from a bullish inverted head and shoulder pattern, with the potential to reach strong support at the inverted head and shoulder's neckline between $1,820 and $1,830. Currently, this region of support is regarded as a strong buying opportunity for gold investors. The short-term pullback in the gold market is due to the achievement of the falling wedge target of $1,975. The achievement of the falling wedge's $1,975 target is typically accompanied by a pullback followed by a resumption of the uptrend.
Key Actions for Investors
The gold market is still extremely bullish. The price compression between $1,680 and $2,075 is regarded as a bullish sign. Price compression represents stored energy that is released in any direction upon breakout. The price is likely to break higher based on the preceding discussion of the long-term outlook . The recent decline in the gold market is a very good sign. Any market correction to $1,820-$1,830 is viewed as a strong buying opportunity for gold investors. A weekly close below $1,820, on the other hand, would negate the bullish view.
A break below $1,680.00 in spot gold, on the other hand, will signal the start of a major breakdown in the gold market to emerge the long-term buy signal. However, a break above $2,075 is likely to significantly increase gold demand.
Conclusion
High job openings and low unemployment indicate a tight labour market, which reduces the likelihood of a pause in a rate hike. If the economy recovers, the Fed will need unemployment to rise above 5.0%. Therefore, interest rates are likely to rise and remain elevated for a long time. Inflation is likely to persist over the next decade, despite the Fed's best efforts. Despite high inflation, the US dollar is likely to remain under pressure, increasing gold demand. Any increase in the US dollar index is interpreted as a gold market correction and an opportunity to invest. China and Russia are attempting to create an alternative to trading in US dollars, but neither country's economy is strong enough to support a reserve currency. Gold is likely to be used as a hedge against the current crisis, so central bank gold purchases are likely to remain high in the coming years.
In conclusion, the economy of the United States is in trouble, and the gold market is being supported by high inflation and a tight labour market. The gold market is currently correcting back to the $1,820-$1,830 support level in the spot market, which is considered a buying level. Therefore, investors can use GLD ETF to invest in the gold market when spot gold prices hit $1,830 levels.
For further details see:
GLD: Buy The Market Corrections