UMC - GlobalFoundries: Expectations Are Running High
2023-03-30 18:05:52 ET
Summary
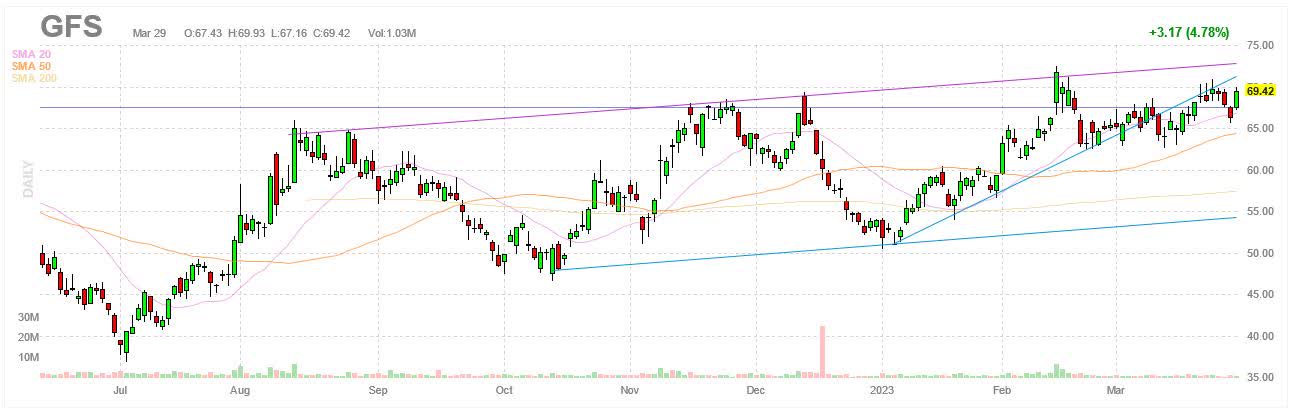
- GFS has seen its stock outperform in 2023, but additional gains could be harder to come by even if the charts suggest the stock is heading higher.
- GFS has entered a downturn with revenue expected to dip for the first time since the IPO, but the outlook calls for an imminent recovery.
- GFS comes at a premium in terms of multiples versus the competition, but this could backfire if GFS fails to live up to expectations.
- It’s not that long GFS is not worth considering; it’s that other stocks look like a better bet at this point all things considered.
GlobalFoundries (GFS), a provider of foundry services to the semiconductor industry, is looking past the current slowdown that is expected to result in the first quarterly contraction in revenue since the IPO in 2021. The stock has soared higher in anticipation of a recovery in the near future along with a few other tailwinds. However, this may result in blowback for the stock should expectations turn out to be too high. Why will be covered next.
A strong rally has slowed down
Semiconductor stocks have outperformed in 2023 and GFS is no exception. The stock has gained 28.8% YTD, ahead of the 24.9% YTD gain for the iShares PHLX Semiconductor ETF (SOXX). In comparison, the SPDR S&P 500 ETF (SPY) has gained a more modest 5% YTD. GFS has thus done better than most.
However, the gains came in the early part of 2023. The stock has lost steam and the rally has more or less stalled since February 14. Note how in the chart below, the stock followed the ascending trendline since the start and for much of 2023, a welcome sign for the bulls. That is until a few weeks ago when the stock broke through and fell below the trendline, weakening the bull case for GFS.
Yet the overall trend that has been in place since the middle of last year remains in place and that one is still pointing up. Note how if the higher lows and higher highs are connected to form two trendlines parallel to one another, then a channel appears which is trending higher. This suggests that while the pace of near-term gains are likely to be less than what they were at the start of 2023, there are still gains to be expected for the stock with the trend in favor of higher prices.
Why the latest report from GFS put the brakes on the rally
The stock reached a 2023 high of $72.50 on February 14 and the stock has been going sideways since then. This did not happen by accident since GFS released the most recent earnings report on the 14th. While GFS reported a sizable earnings beat, it also suggested to prepare for a slowdown before a recovery later in the year.
The table below shows how the numbers have improved recently. FY2022 revenue increased by 23% YoY to $8,108M and adjusted EPS rose to $3.11, up from a loss of $0.05 in FY2021 thanks to better margins. GFS finished with $3,346M in cash, cash equivalents and marketable securities on the balance sheet, partially offset by $2,511M in long-term debt. All in all, FY2022 was a strong year for GFS.
| (Unit: $1M, except for EPS and margins) |
| (IFRS) |
| FY2022 |
| FY2021 |
| YoY |
| Revenue |
| 8,108 |
| 6,585 |
| 23% |
| Gross margin |
| 27.6% |
| 15.4% |
| 1220bps |
| Operating margin |
| 14.4% |
| (0.9%) |
| 1530bps |
| Operating profit (loss) |
| 1,167 |
| (60) |
| - |
| Net income (loss) |
| 1,446 |
| (254) |
| - |
| EPS |
| 2.62 |
| (0.49) |
| - |
| (Non-IFRS) |
| Gross margin |
| 28.4% |
| 16.2% |
| 1220bps |
| Adjusted EBITDA |
| 3,088 |
| 1,848 |
| 67% |
| Adjusted operating margin |
| 17.8% |
| 2.6% |
| 1520bps |
| Operating profit |
| 1,443 |
| 168 |
| 759% |
| Net income (loss) |
| 1,717 |
| (26) |
| - |
| EPS |
| 3.11 |
| (0.05) |
| - |
Source: GFS Form 6-K
It's worth mentioning that Q4, and FY2022 EPS by extension, got a boost from a one-time gain worth $403M due to the sale of a fab to Onsemi (ON), which was partially offset by $94M of restructuring charges. This gain helped push Q4 net income to $668M or $1.21 per share, which converts to $800M or $1.44 per share on an adjusted basis.
Note that adjusted gross margin continued to improve to reach 30.1% for the first time, primarily due to a better product mix and higher average selling prices. It stood at 18% in Q3 FY2021 when GFS launched the IPO. The table below shows how earnings spiked in Q4 FY2022 even though revenue was only up 1% QoQ with wafer shipments down 9% QoQ and 7% YoY to 580K.
| (Unit: $1M, except for EPS and margins) |
| (IFRS) |
| Q4 FY2022 |
| Q3 FY2022 |
| Q4 FY2021 |
| QoQ |
| YoY |
| Revenue |
| 2,101 |
| 2,074 |
| 1,847 |
| 1% |
| 14% |
| Gross margin |
| 29.6% |
| 29.4% |
| 20.8% |
| 20bps |
| 880bps |
| Operating margin |
| 13.7% |
| 17.2% |
| 4.7% |
| (350bps) |
| 900bps |
| Operating profit |
| 288 |
| 357 |
| 87 |
| (19%) |
| 231% |
| Net income |
| 668 |
| 336 |
| 43 |
| 99% |
| 1453% |
| EPS |
| 1.21 |
| 0.61 |
| 0.08 |
| 98% |
| 1413% |
| (Non-IFRS) |
| Gross margin |
| 30.1% |
| 29.9% |
| 21.5% |
| 20bps |
| 860bps |
| Adjusted EBITDA |
| 821 |
| 793 |
| 584 |
| 4% |
| 41% |
| Adjusted operating margin |
| 20.2% |
| 18.8% |
| 7.7% |
| 140bps |
| 1250bps |
| Operating profit |
| 425 |
| 389 |
| 142 |
| 9% |
| 199% |
| Net income |
| 800 |
| 368 |
| 98 |
| 117% |
| 716% |
| EPS |
| 1.44 |
| 0.67 |
| 0.18 |
| 115% |
| 700% |
Guidance calls for Q1 FY2023 revenue of $1,810-1,850M, a decline of 12.9% QoQ and 5.7% YoY at the midpoint. Note that this would end the current streak of consecutive sequential increases in quarterly revenue that goes back to the IPO. The forecast sees EPS of $0.36-0.46, decline of 66.1% QoQ and an increase of 24.2% YoY at the midpoint, and adjusted EPS of $0.45-0.53, a decline of 65.97% QoQ and an increase of 16.7% YoY at the midpoint.
| (IFRS) |
| Q1 FY2023 (guidance) |
| Q1 FY2022 |
| YoY (midpoint) |
| Revenue |
| $1,810-1,850M |
| $1,940M |
| (5.67%) |
| Gross margin |
| 27.1% |
| 24.2% |
| 290bps |
| EPS |
| $0.36-0.46 |
| $0.33 |
| 24.24% |
| (Non-IFRS) |
| Gross margin |
| 28.0% |
| 25.3% |
| 270bps |
| EPS |
| $0.45-0.53 |
| $0.42 |
| 16.67% |
The numbers are heading in the wrong direction, but GFS is optimistic a recovery is not far away. The outlook sees the trough in the first half, if not the first quarter, followed by a recovery in the second half of the year. From the Q4 earnings call:
"And look, we do believe that first half is the trough. From a revenue perspective, we think it's most likely first quarter, but certainly from a first half perspective, we believe that, that is the bottom. Based upon what our customers are telling us based upon our LTAs and based upon I think what you all are seeing broadly in the industry most of the industry is currently forecasting a recovery in the second half of this year. We've mentioned previously and we still stick with that guidance that we believe ASPs will be up modestly on a year-over-year basis.
So really if you're looking at growth for the year, it's really predicated upon that volume and it's predicated upon a second half recovery, which right now is what we're currently expecting."
A transcript of the Q4 FY2022 earnings call can be found here .
The general outlook at the moment is for the industry to contract in 2023 before expanding in 2024. For instance, a recent forecast from Gartner predicts the semiconductor market will decline by 6.5% YoY to $562.7B in 2023, before growing by 16.3% YoY to $654.3B in 2024. Earnings estimates are in line with this outlook.
Consensus estimates expect adjusted EPS of $0.49 on revenue of $1.83B in Q1, but most expect the numbers to improve by the time FY2023 is done to end up with adjusted EPS of $1.62-2.80 on revenue of $7.20-8.37B. Projections see growth taking off the following year with predictions of adjusted EPS of $2.38-3.85 on revenue of $7.85-9.99B in FY2024.
The more bullish projections are in part based on GFS benefiting from changes brought by the Chips and Science Act and other initiatives by the U.S. government designed to bring back semiconductor manufacturing to the U.S. Not only is GFS expected to receive financial assistance to help expand manufacturing capacity, but the assumption is that GFS will be able to win market share from other foundries, most of whom are based in East Asia, due to companies making changes with whom they do business.
GFS comes at a premium
| GFS |
| UMC |
| TSM |
| Market cap |
| $36.11B |
| $21.50B |
| $448.39B |
| Enterprise value |
| $35.32B |
| $17.38B |
| $425.94B |
| Revenue ("ttm") |
| $8,108.0M |
| $9,066.2M |
| $73,644.0M |
| EBITDA |
| $2,884.0M |
| $4,737.0M |
| $50,469.3M |
| Trailing non-GAAP P/E |
| 21.30 |
| 7.42 |
| 13.84 |
| Forward non-GAAP P/E |
| 28.18 |
| 11.39 |
| 16.21 |
| P/S |
| 4.40 |
| 2.33 |
| 6.09 |
| P/B |
| 3.65 |
| 1.97 |
| 4.68 |
| EV/sales |
| 4.36 |
| 1.92 |
| 5.78 |
| Trailing EV/EBITDA |
| 12.25 |
| 3.67 |
| 8.44 |
| Forward EV/EBITDA |
| 11.35 |
| 4.93 |
| 8.33 |
Source: Seeking Alpha
Much is expected from GFS in the future and this is reflection in how it is valued. The table above shows how GFS compares to United Microelectronics ( UMC ), the closest foundry to GFS in terms of size, and TSMC (TSM), the leading foundry in the world. In general, multiples are much higher for GFS, despite being smaller with lower margins and less profitability. It is assumed GFS will outperform the competition in the coming years, but whether it actually does remains to be seen.
Investor takeaways
Whether it is the big gains the stock has made this year, the multiples GFS trades at or the earnings projections for GFS, it is clear that expectations are high. Similar to other companies in the semiconductor space, GFS is currently in the midst of a slowdown, but the numbers are expected to get better in the second half of 2023 and they are expected to take off in 2024.
The bar has been set high, but this opens the door to the possibility of GFS falling short. If GFS fails to meet expectations, the stock is likely to get punished, given how it has rallied, more than most. The drop could be particularly severe since multiples are much higher than its main competitors, which suggests there is a lot of room for the stock to decline before buyers are likely to step in to halt the decline.
So while GFS has made substantial progress in terms of sales and profits and the charts suggest the stock can go higher, I am neutral on GFS. If there is a rebound in the industry, GFS will not be the only one to benefit. Many other semis will as well and a number of them could see greater upside since they trade at much lower valuations and are more likely to attract buyers due to this.
On the other hand, if the downturn lasts longer and the recovery takes longer to arrive, GFS is in a worse position compared to the rest due to it being valued higher than many. GFS will have to post numbers that are much better than the competition to warrant the premium it trades at, but it won't be easy, even if GFS gets help in the form of U.S. government initiatives.
Keep in mind that the foundry industry has greatly increased prices thanks to the semiconductor boom of past years. This has helped foundry margins, but the reverse could easily happen in an extended downturn when there is more capacity than customers to be found. GFS has itself greatly expanded capacity, but customers need to show up or low utilization will hurt the bottom line.
Bottom line, it's not that GFS is not worth considering. GFS has its strengths, it's just that others offer better value at this point. The risk for GFS is that expectations turn out to be too high. If GFS meets expectations, long GFS could be a winner. But if it somehow slips up, which would not be the first time for GFS considering the past, look out below.
For further details see:
GlobalFoundries: Expectations Are Running High