FT - GOF: 12% Monthly Payer And Other High-Yield Outperformers
Summary
- GOF yields 12.59% and pays monthly.
- It has outperformed the bond market and the S&P by a big margin in 2022.
- We compare GOF to other high-yield outperforming monthly payers.
Need some high-yield outperformers in your portfolio? The Guggenheim Strategic Opportunity Fund ( GOF ) is a closed-end fund which offers a mix of fixed income and equity strategies.
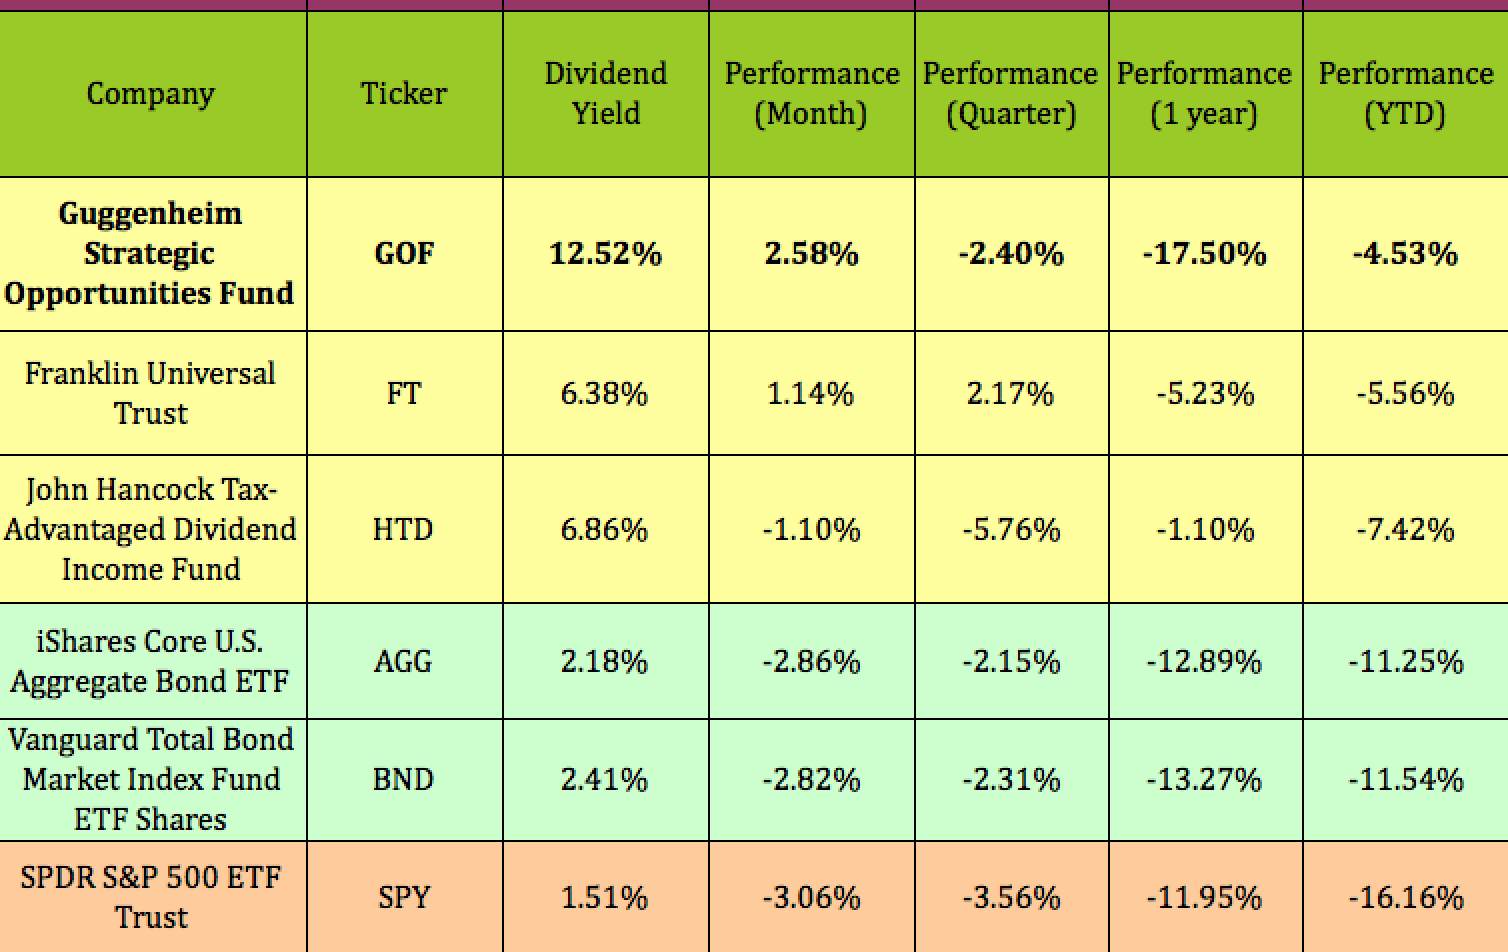
We began covering GOF at the start of 2022. So far in 2022, GOF has outperformed the iShares Aggregate Bond ETF ( AGG ), the Vanguard Total Bond Market ETF ( BND ), and the S&P 500 by a wide margin.
We found two other high-yield CEFs , Franklin Universal Trust ( FT ) and John Hancock Tax-Advantaged Dividend Income Fund ( HTD ), which also outperformed the bond market and the S&P by big margins so far in 2022:
Hidden Dividend Stocks Plus
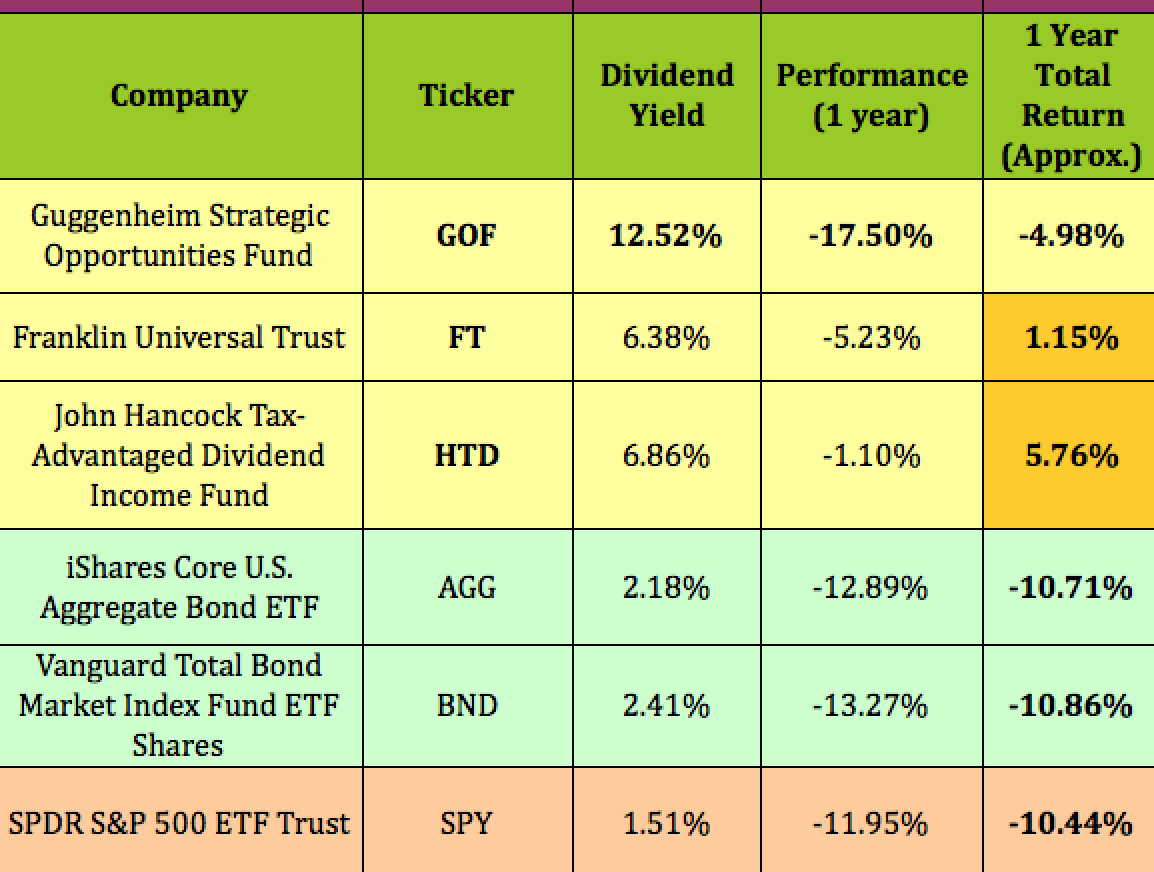
Looking back over the past year, GOF has lagged the S&P, AGG, and BND quite a bit on a price basis, but its ~12.5% dividend yield brings its total return to -4.98%, much better than the S&P's -10.44% total return, in addition to AGG's and BND's ~-11% returns.
FT and HTD have done even better over the past year - HTD and FT both outperformed GOF on a total return basis, with HTD at 5.76% and FT at 1.15%. Even though their dividend yields are ~half as high as GOF's, their price performance put them over the top:
Hidden Dividend Stocks Plus
Profiles:
GOF: "The Fund’s investment objective is to maximize total return through a combination of current income and capital appreciation. The Fund will pursue a relative value-based investment philosophy, which utilizes quantitative and qualitative analysis to seek to identify securities or spreads between securities that deviate from their perceived fair value and/or historical norms. The Fund’s sub-adviser seeks to combine a credit managed fixed-income portfolio with access to a diversified pool of alternative investments and equity strategies." (GOF site)
FT: "The Fund seeks to provide high current income consistent with preservation of capital. Its secondary objective is growth of income through dividend increases and capital appreciation. The Fund seeks to achieve its investment objectives primarily through investments in fixed-income debt securities (including obligations of foreign governments), dividend-paying stocks (emphasising public utilities stocks), and securities of precious metals and natural resources companies." (FT site)
HTD: HTD's investment strategy is different than GOF's and FT's - it invests in dividend stocks.
"The Fund's investment objective is to provide a high level of after-tax total return from dividend income and capital appreciation. Under normal market conditions, the Fund will invest at least 80% of its assets in dividend-paying common and preferred securities that John Hancock Advisers, LLC believes at the time of acquisition are eligible to pay dividend, which for individual shareholders, qualify for U.S. federal income taxation at rates applicable to long-term capital gains, which are taxed at a maximum rate of 15%. The Fund intends to concentrate in securities issued by U.S. corporations in the related groups of industries comprising each of the utilities sector and the financial services sector." (HTD site)
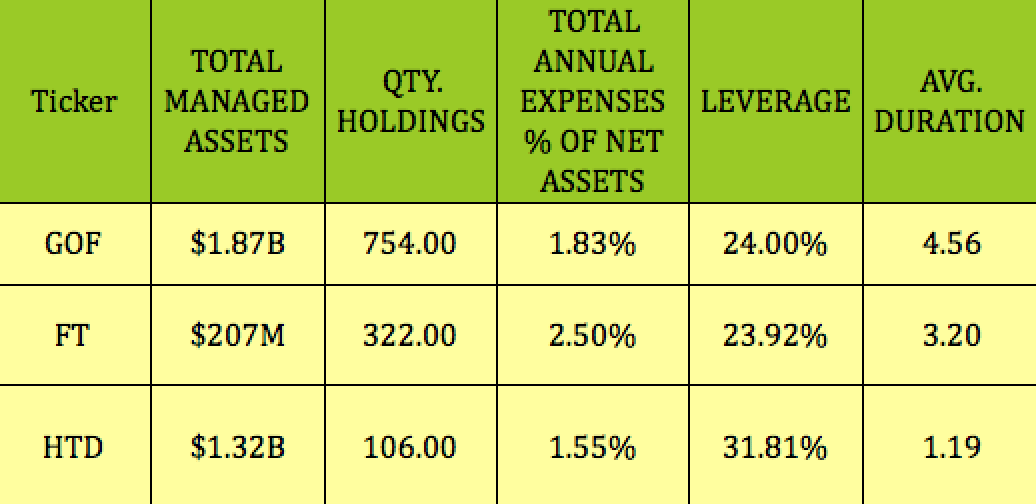
GOF is the largest fund in the group, with $1.87B in managed assets, followed by HTD, with $1.32B, while FT is tiny in comparison, with $207M.
GOF also has a lot more holdings, 754, vs. 322 for FT, and 106 for HTD, but HTD has the lowest expense ratio, at 1.55%, vs. 1.83% for GOF, and 2.50% for FT.
All three funds use leverage, with HTD having the highest, by far, at 31.81%, vs. ~24% for GOF and FT. HTD has the shortest duration, at 1.19, vs. 3.2 for FT, and 4.56 for GOF:
Hidden Dividend Stocks Plus
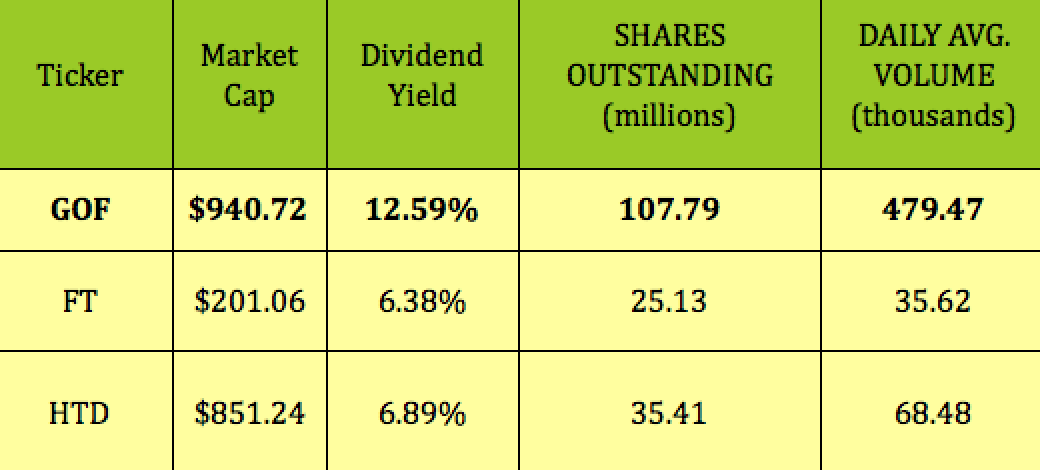
GOF's market cap, share count, and average daily volume are the largest in the group, with HTD in second, and FT a very distant third:
Hidden Dividend Stocks Plus
Holdings:
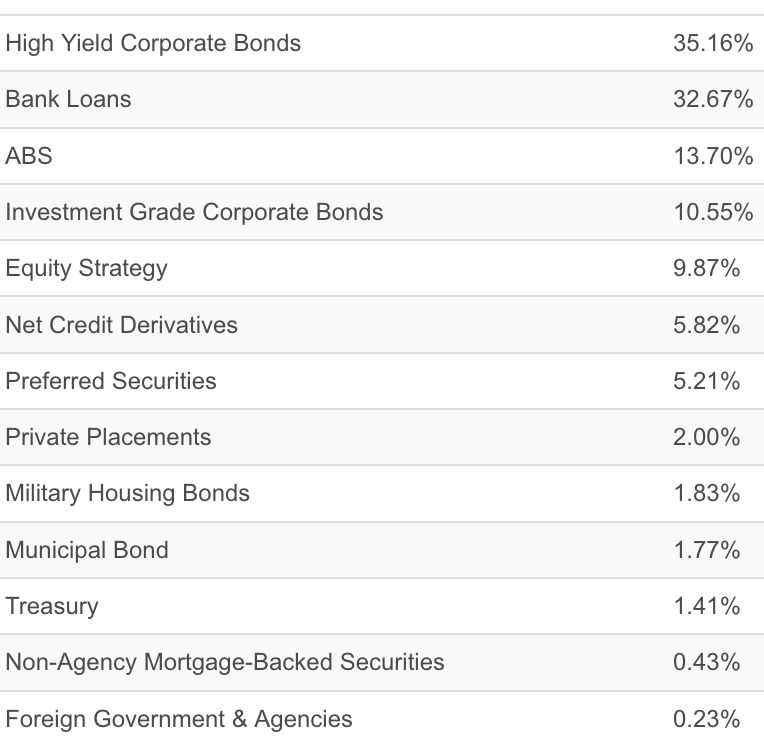
GOF: High Yield corporate bonds and Bank Loans are still its two heaviest concentrations, at 35.16% and 32.67% respectively, followed by Asset Backed Securities, ABS, at 13.7%, investment grade Corporate Bonds, at 10.55%, and Equity Strategy, at 9.87%.
GOF site
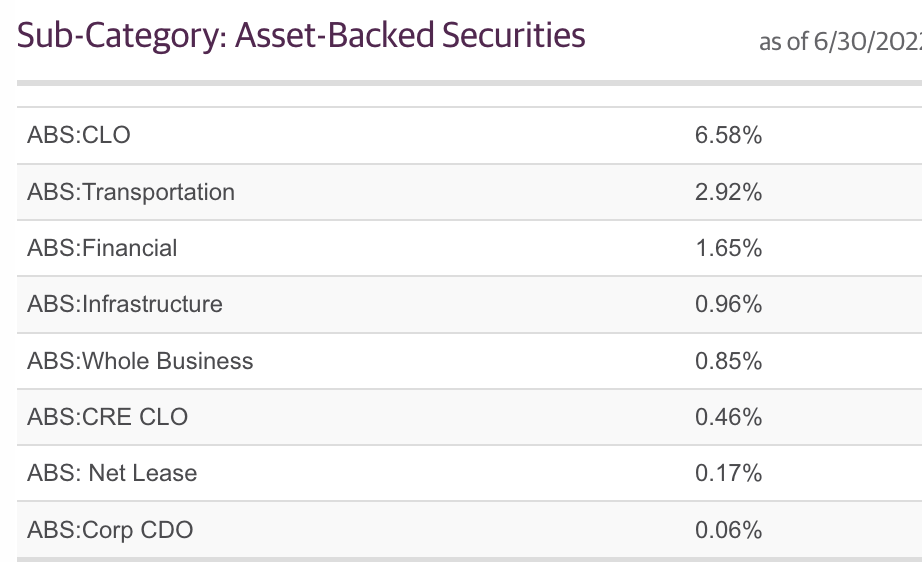
GOF ABS category is dominated by CLOs , Collateralized Loan Obligations, which comprise nearly 50% of its ABS holdings.
GOF site
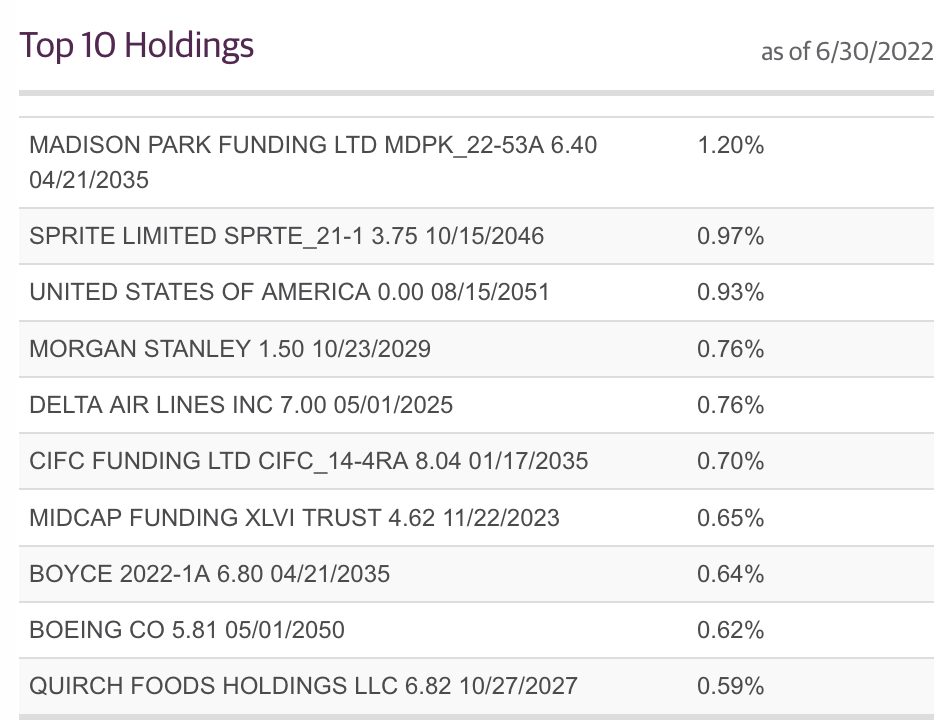
GOF's top 10 holdings include debt from some well-known big cap names, such as Delta Air Lines (DAL), Morgan Stanley (MS), and Boeing (BA). Its top 10 only comprised ~8% of its holdings, as of 6/30/22. GOF holds ~18% in investment grade, and ~33% in non-investment grade, and 43% in unrated securities.
GOF site
FT has ~16.5% exposure to mortgage, commercial, and asset-backed securities, and 13.56% exposure to Energy. Energy has been a good place to be in 2022, being the leading sector by far - only the Utilities sector also has a positive return.
FT site
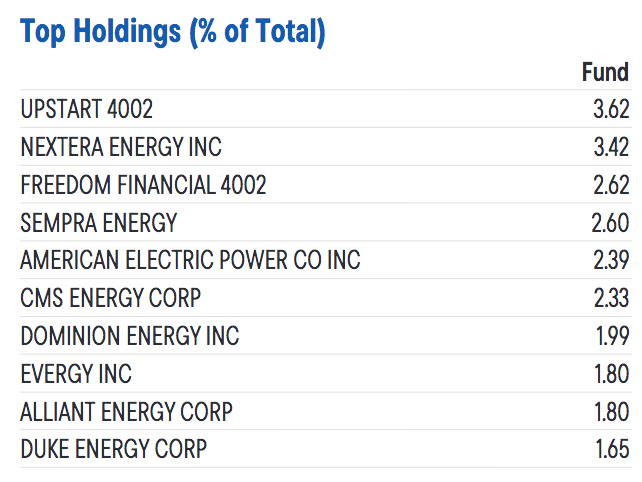
FT's top 10 is dominated by well-known Utilities large caps, such as NextEra (NEE), Dominion (D), and Duke (DUK), and comprises ~24% of its holdings:
FT site
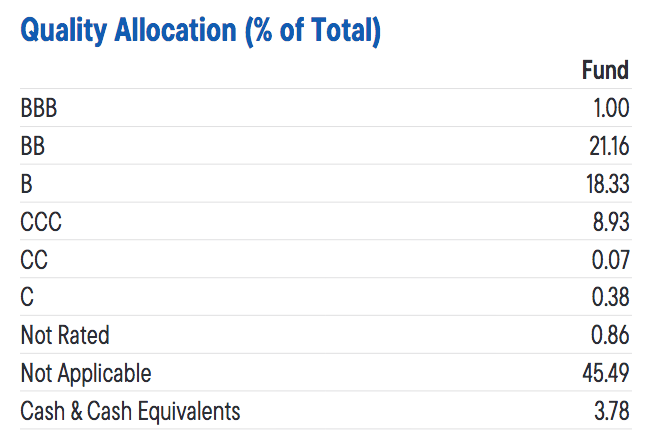
FT holds ~44% in non-Investment grade securities and 45.5% in unrated securities:
FT site
HTD held ~69% in Utilities and 23% in Financials, as of 7/29/22
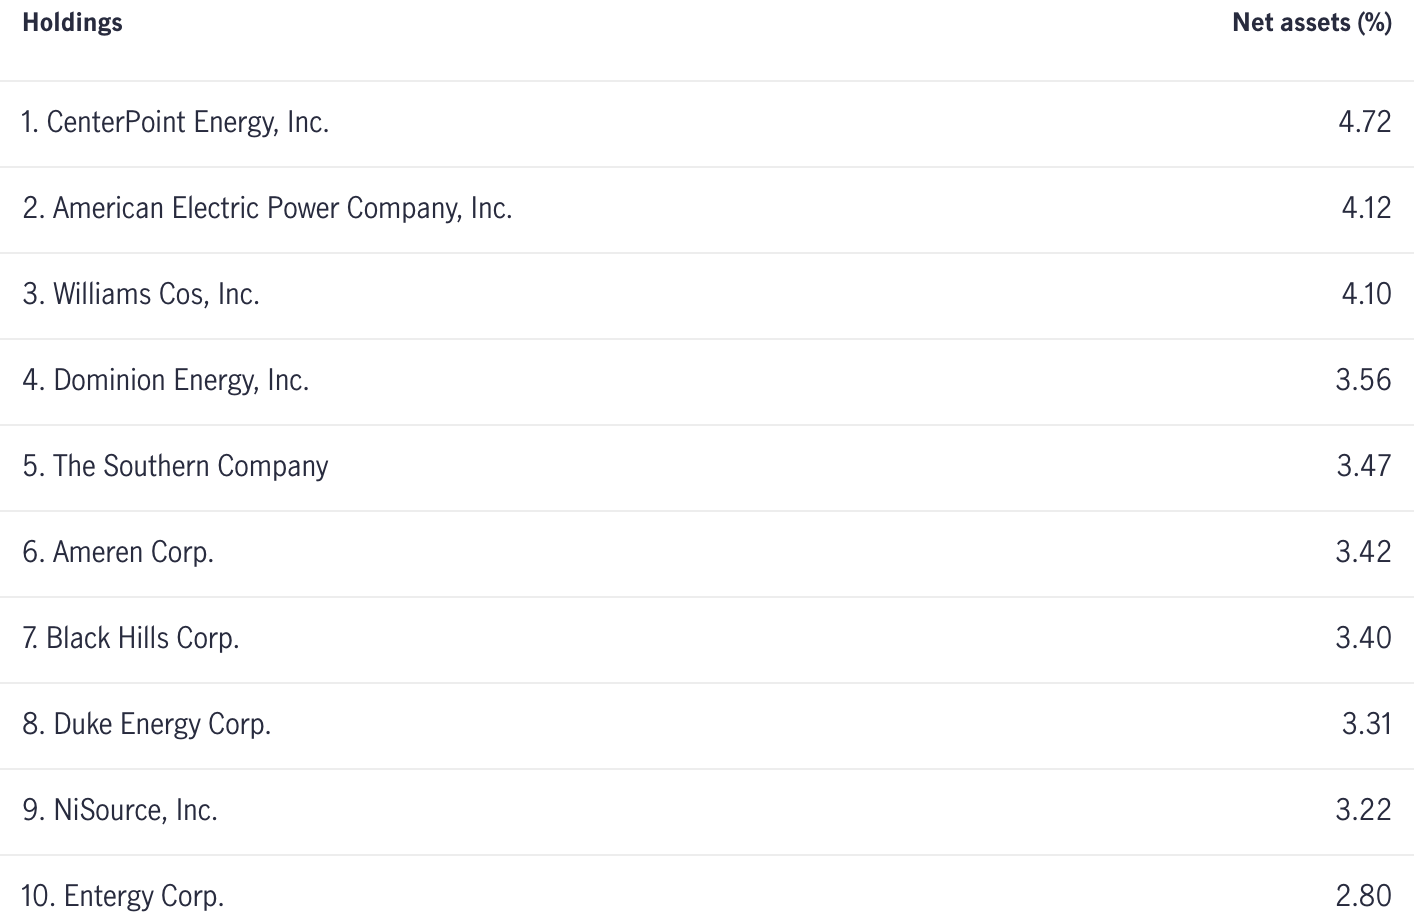
HTD's top 10 is also dominated by large cap Utilities names, including CenterPoint Energy (CNP), Southern Company (SO), and Dominion, among others:
HTD site
Dividends:
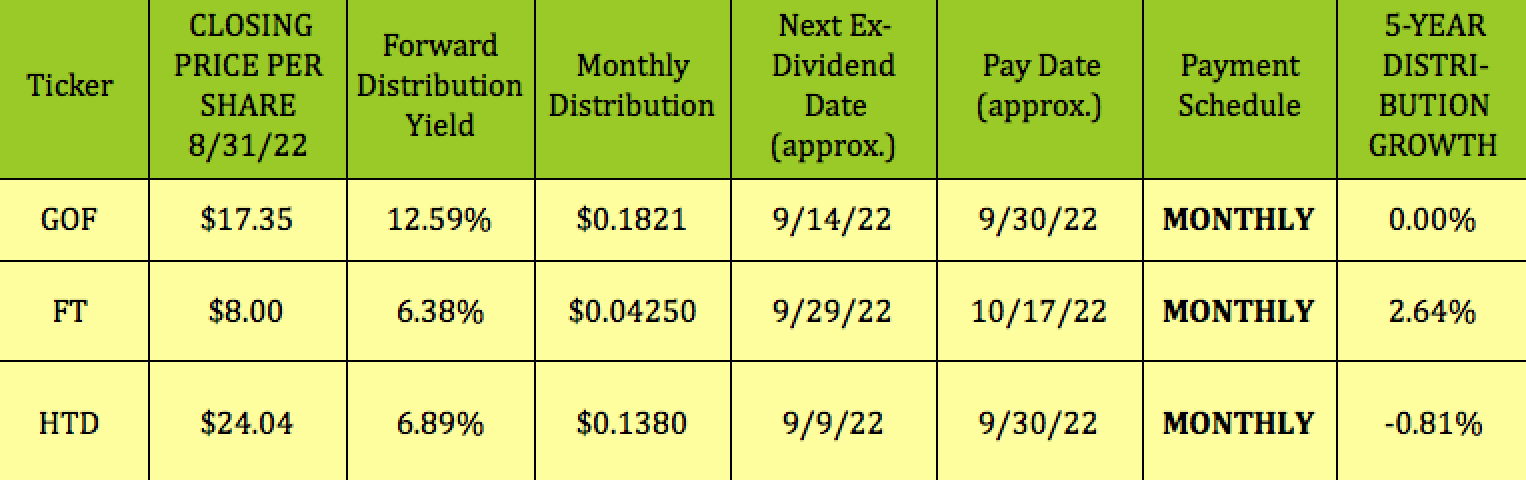
At its 8/31/22 closing price of $17.35, GOF yields 12.59%, nearly 2X the yields for FT, at 6.38%, and 1.8 times HTD's 6.89% yield. All three funds pay monthly, while only FT has a positive 5-year dividend growth rate of 2.64%:
Hidden Dividend Stocks Plus
Valuations:
A useful strategy for investing in CEFs is to try to buy them at a deeper discount or lower premium to NAV than their historical averages.
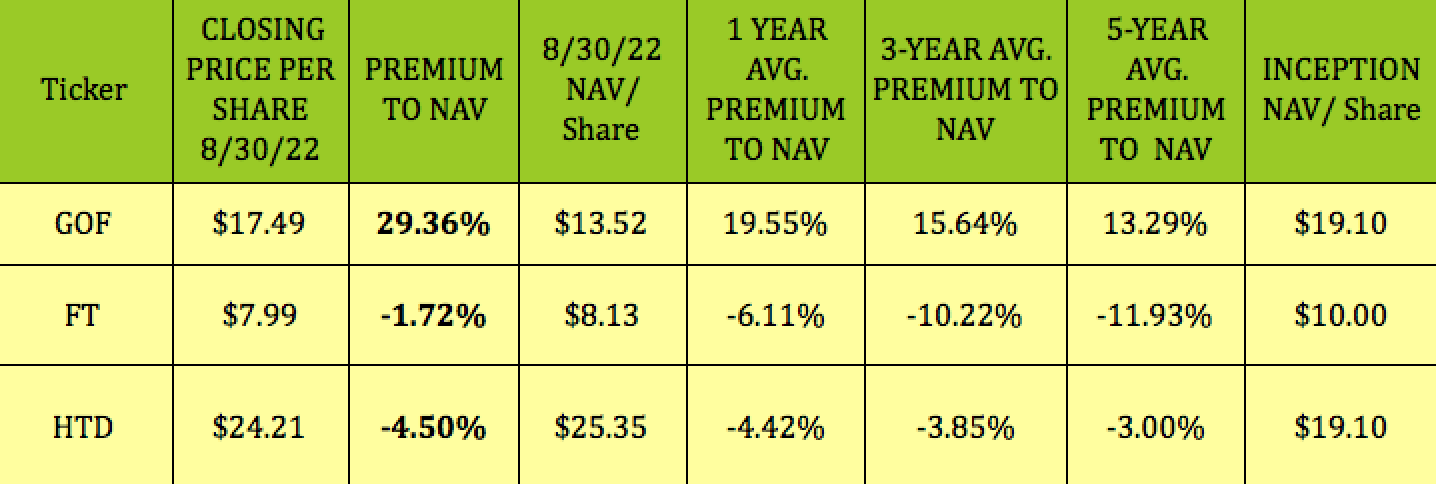
At its 8/30/22 closing price of $17.49, GOF was selling at a 29.36% premium to its 830/22 NAV/share of $13.52, which is higher than its 1-, 3-, and 5-year premiums of 19.55%, 15.64%, and 13.29%, respectively.
FT had a -1.72% discount to its 8/30/22 premium, but that's not nearly as deep as its 1-, 3-, and 5-year discount.
HTD had a -4.5% discount to NAV at the 8/30/22 close, and is the only fund in this group with a deeper discount than its 1-, 3-, and 5-year discounts.
Hidden Dividend Stocks Plus
Parting Thoughts:
Three outperforming high-yield monthly payers, with differing investment strategies. What to do? As shown earlier, based upon discount to NAV, and 1-year total returns, stock-based HTD wins the race.
Looking back over a 10-year period, HTD also comes out on top, on a total return basis. Not a big surprise, stocks beating bonds during that bull market period, but GOF's much higher dividend yield makes it a much closer race than you'd think:
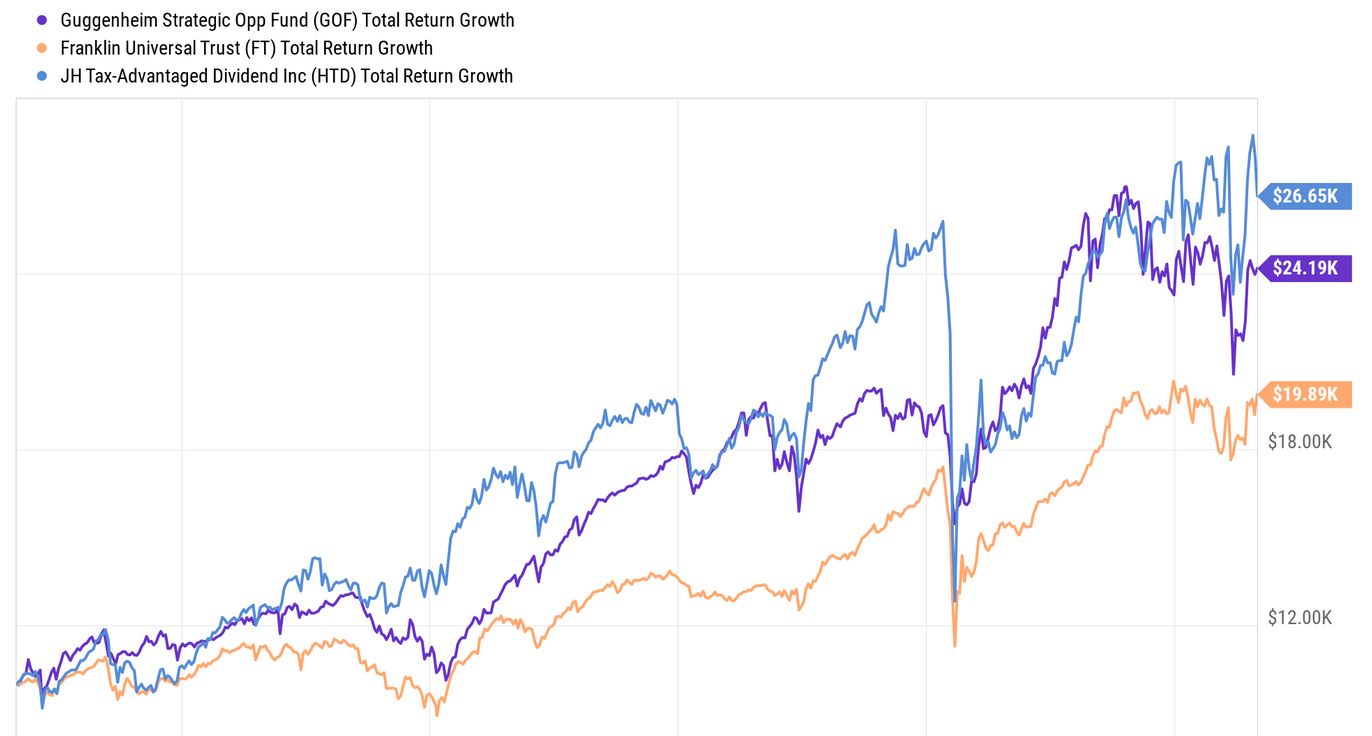
YCharts
All tables by Hidden Dividend Stocks Plus, except where otherwise noted.
For further details see:
GOF: 12% Monthly Payer And Other High-Yield Outperformers