GLDI - Gold: All Quiet Before The Storm
2023-10-30 10:43:03 ET
Summary
- Gold market has been relatively calm with stable economic landscape, maintaining recent gains and outperforming equities.
- Ongoing geopolitical tensions and downturn in US stock market support gold's positive outlook.
- Market showed little reaction to economic data, but upcoming events like FOMC meeting and Jobs Report may impact gold's rally.
Fundamentals
In summary, the past week has been relatively calm in the gold market, especially when compared to recent weeks characterized by high volatility. This calmness can be attributed in part to a subdued macroeconomic calendar and a stable economic landscape. Despite this period of reduced activity, gold has managed to maintain its recent gains rather than experiencing a significant decline. In fact, it is on track for another weekly gain, outperforming equities in the latter half of the year.
Several factors continue to support gold's positive outlook, including ongoing geopolitical tensions, particularly the conflict in the Middle East, which has dampened investors' risk appetite. Additionally, a downturn in the US stock market has encouraged traders and money managers to adopt a risk-off stance, benefiting gold.
In terms of economic data, a surprisingly strong New Home Sales report earlier in the week suggested strength in the US economy, making a case for higher interest rates. However, the market showed little reaction to Friday's PCE Price Index, as it presented data similar to what had already been observed in recent weeks through other reports like the Consumer Price Index and the PPI.
On the other hand, Thursday's GDP reading exceeded expectations, indicating robust quarterly growth. This resilience of the US economy despite higher interest rates weakened the argument for an early policy rate cut by the Federal Reserve. Consequently, gold prices dipped slightly on Thursday, and Treasury yields continued to rise.
Looking ahead, the geopolitical implications of the Middle East conflict may influence Monday's market action, and the upcoming week promises a more active macroeconomic calendar. The Federal Open Market Committee ((FOMC)) meeting and the October Jobs Report will provide further challenges and opportunities for gold's recent rally.
In conclusion, while the past week has seen relatively stable gold prices, the future holds potential for increased market dynamics and gold price movements. Traders should stay vigilant and prepare for potential accelerants and challenges to gold's recent rally in the coming weeks.
Let's take a look at the weekly standard deviation report published in Investing Groups as mean reversion trading and see what trading opportunities we can identify for next week.
GOLD: Weekly Standard Deviation Report
Oct. 28, 2023 10:08 AM ET
Summary
- Gold futures market currently has a bullish trend momentum, confirmed by the 9-day SMA and VC Weekly Price Momentum Indicator.
- Traders are advised to consider taking profits on short positions at 1969–1940 levels and long positions with a weekly reversal stop signal as an entry point.
- Long-term position management should utilize the 1940 level as a stop order and prepare for profit-taking at 2024–2050 levels.
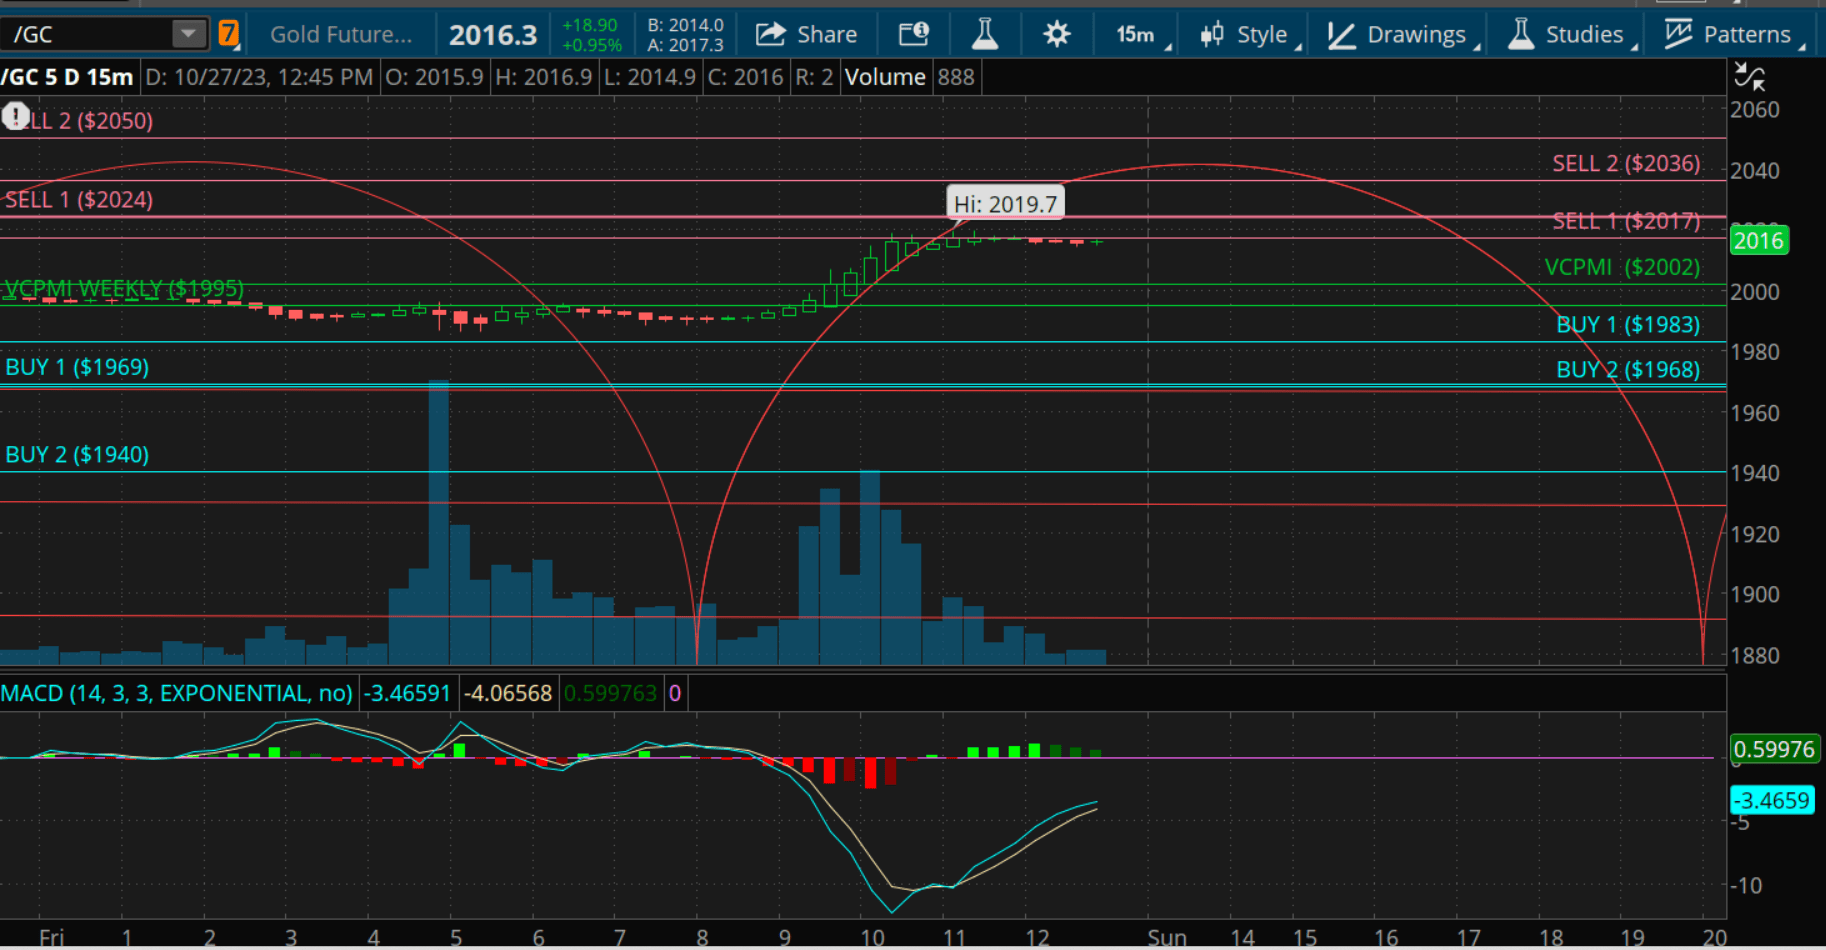
GOLD WEEKLY (TOS)
-
Introduction:
In this report, we will analyze the weekly standard deviation levels in the gold futures market, focusing on key technical indicators and potential trading strategies. The objective is to provide a comprehensive overview of the current market conditions and offer strategic insights for traders and investors.
Weekly Trend Momentum:
The gold futures contract closed at 1994 during the previous week. Our analysis indicates that the market closed above the 9-day Simple Moving Average ((SMA)) at 1999. This development serves as a confirmation that the weekly trend momentum is currently bullish. It is essential to note that sustaining this position above the 9 SMA is critical to maintaining the bullish short-term trend. A close below the 9 SMA would transition the trend to a neutral state, warranting caution for market participants.
Weekly Price Momentum:
Another vital indicator to consider is the VC Weekly Price Momentum Indicator, which closed above the market at 1995. This serves as further confirmation that the price momentum is bullish. Similar to the 9 SMA, a close below the VC Weekly Price Momentum Indicator would alter the short-term trend to neutral. Therefore, monitoring this indicator closely is advisable for market participants.
-
Weekly Price Indicator:
Trading Strategies:
For traders, the following strategies are recommended:
-
Short Positions: If you are short on corrections, consider taking profits when the market approaches the 1969 - 1940 levels.
-
Long Positions: If you plan to go long, watch for a weekly reversal stop signal as an entry point.
-
Long-Term Position Management: For those with long positions, the 1940 level should be utilized as a Monthly Stop Close Only and Good Till Cancelled order. Additionally, it is prudent to prepare for profit-taking as the market approaches the 2024–2050 levels during the month.
Cycle and Strategy:
The next cycle due date is projected for October 30, 2023. A strategic move for long positions would be to take profits when the market reaches the 2024-2050 range, in line with the anticipated cycle.
Conclusion:
In conclusion, the standard deviation analysis indicates a current bullish trend momentum in the gold futures market, supported by both the 9-day SMA and the VC Weekly Price Momentum Indicator. Traders are advised to remain vigilant and consider the suggested strategies to make informed decisions. Additionally, keeping an eye on the upcoming cycle date is crucial for effective long-term position management.
This report serves as a snapshot of the market's current state of the standard deviation and is subject to change with evolving market conditions. It is imperative for traders and investors to conduct ongoing research and stay updated on market developments.
Should you require further analysis or have specific inquiries, please do not hesitate to contact us.
-
Disclaimer: The information in the Market Commentaries was obtained from sources believed to be reliable, but we do not guarantee its accuracy. Neither the information nor any opinion expressed herein constitutes a solicitation of the purchase or sale of any futures or options contracts. It is for educational purposes only.
For further details see:
Gold: All Quiet Before The Storm