IAUM - Gold Analytics Signal Potential Birth Of A New Bull Cycle
2023-12-29 06:24:12 ET
Summary
- As veteran metal traders say, gold can stagnate for long years, but when it enters a bull cycle it can move with great strength and persistence.
- Gold is a complicated asset, with a wide range of factors impacting its value.
- A couple of significant market and economic signal statistics point to the birth of a new gold bull cycle.
- Investors should wait and get ready until the marketplace fully confirms the new bull cycle.
INTRODUCTION
Gold is a complicated asset, as it has long been the store of value and medium of exchange for humanity. Arguably, today gold still possesses those same characteristics, while some consider it a rate-sensitive investment, others as a hedge against inflation. It is a key reserve asset for governments and central banks, and it has a safe haven status in times of geopolitical and financial turbulence. At the same time, gold is a physical commodity, which is driven by the supply-demand-inventory framework, and it is inversely linked to the purchasing power of the denominator U.S. Dollar. Obviously, gold is playing a key role in the BRICS nations' effort of de-dollarization of global trade and the financial system.
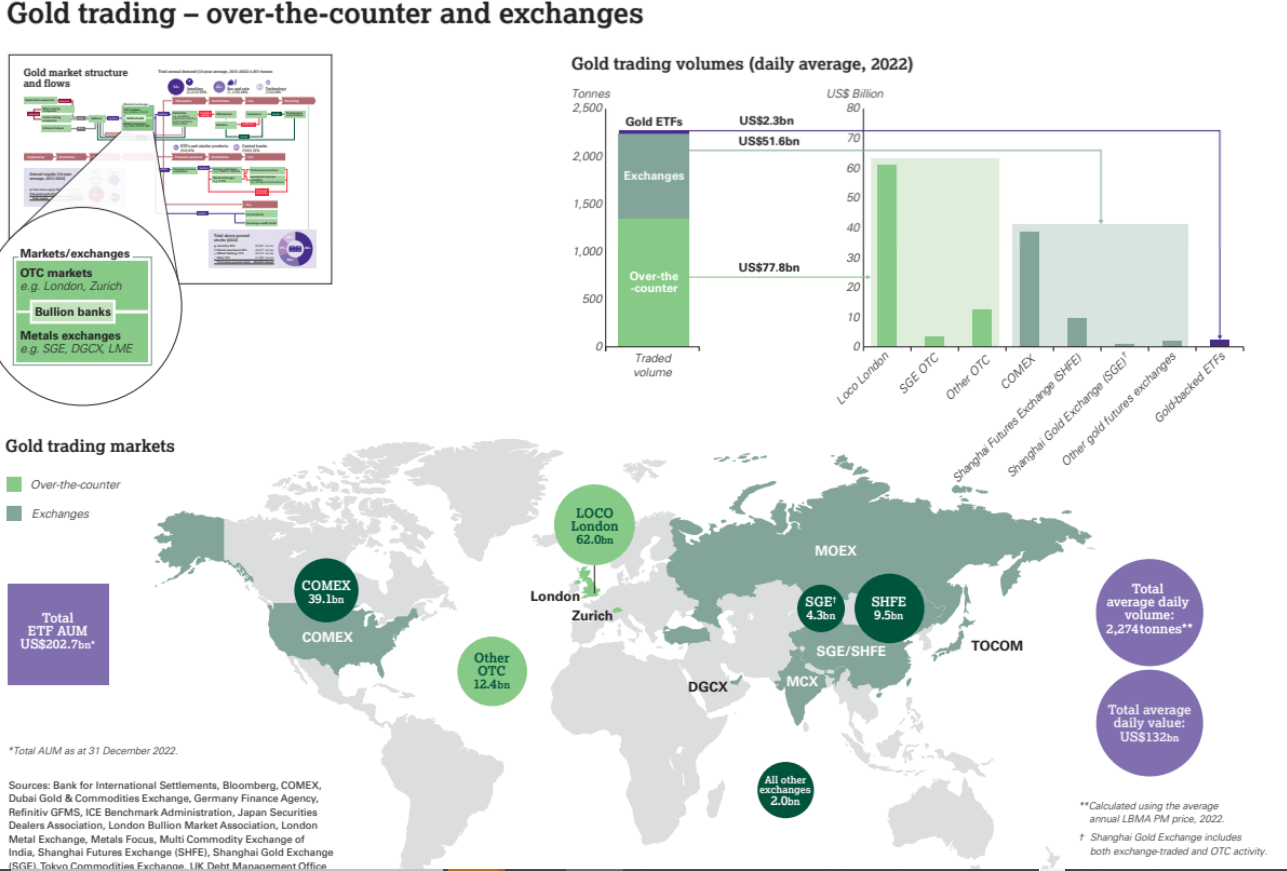
Gold is trading both on exchanges as COMEX, and Shanghai Futures Exchange (SHFE) as well as over-the-counter markets in London, Zurich, etc., with the greater volume coming from the OTC markets.
GOLD MARKET STRUCTURE (WORLD GOLD COUNCIL)
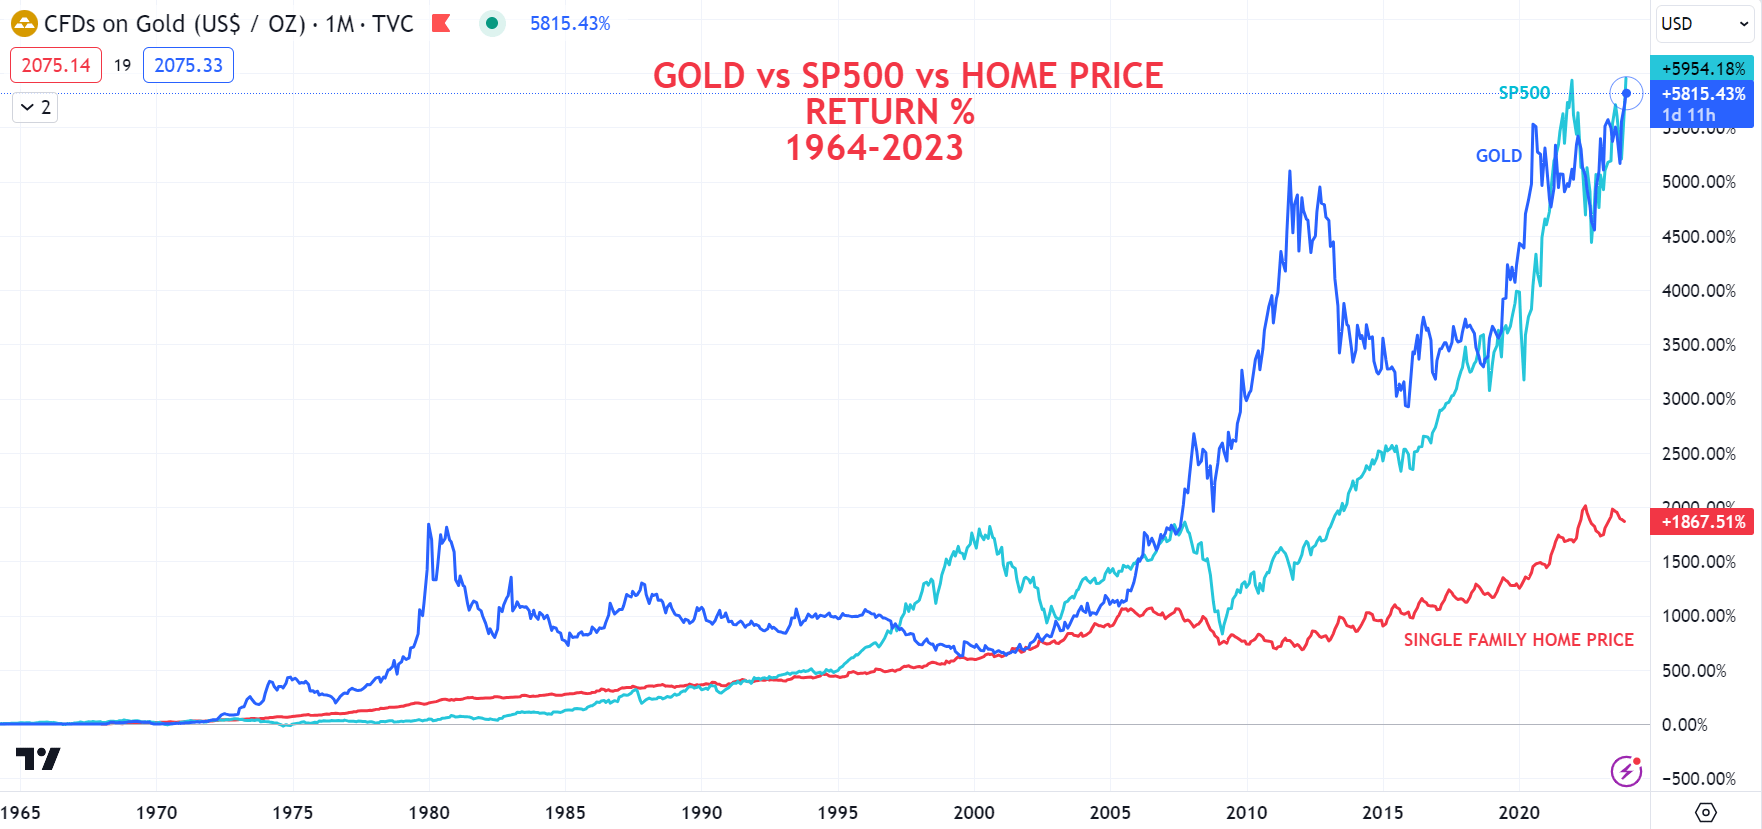
Gold had a spectacular 5,800% performance in the past 60 years, roughly matching the SP500's 5,900% appreciation, both greatly outperforming the single family home price growth of 1,867%.
GOLD vs SP500 vs SINGLE FAMILY HOME PRICE (TRADINGVIEW)
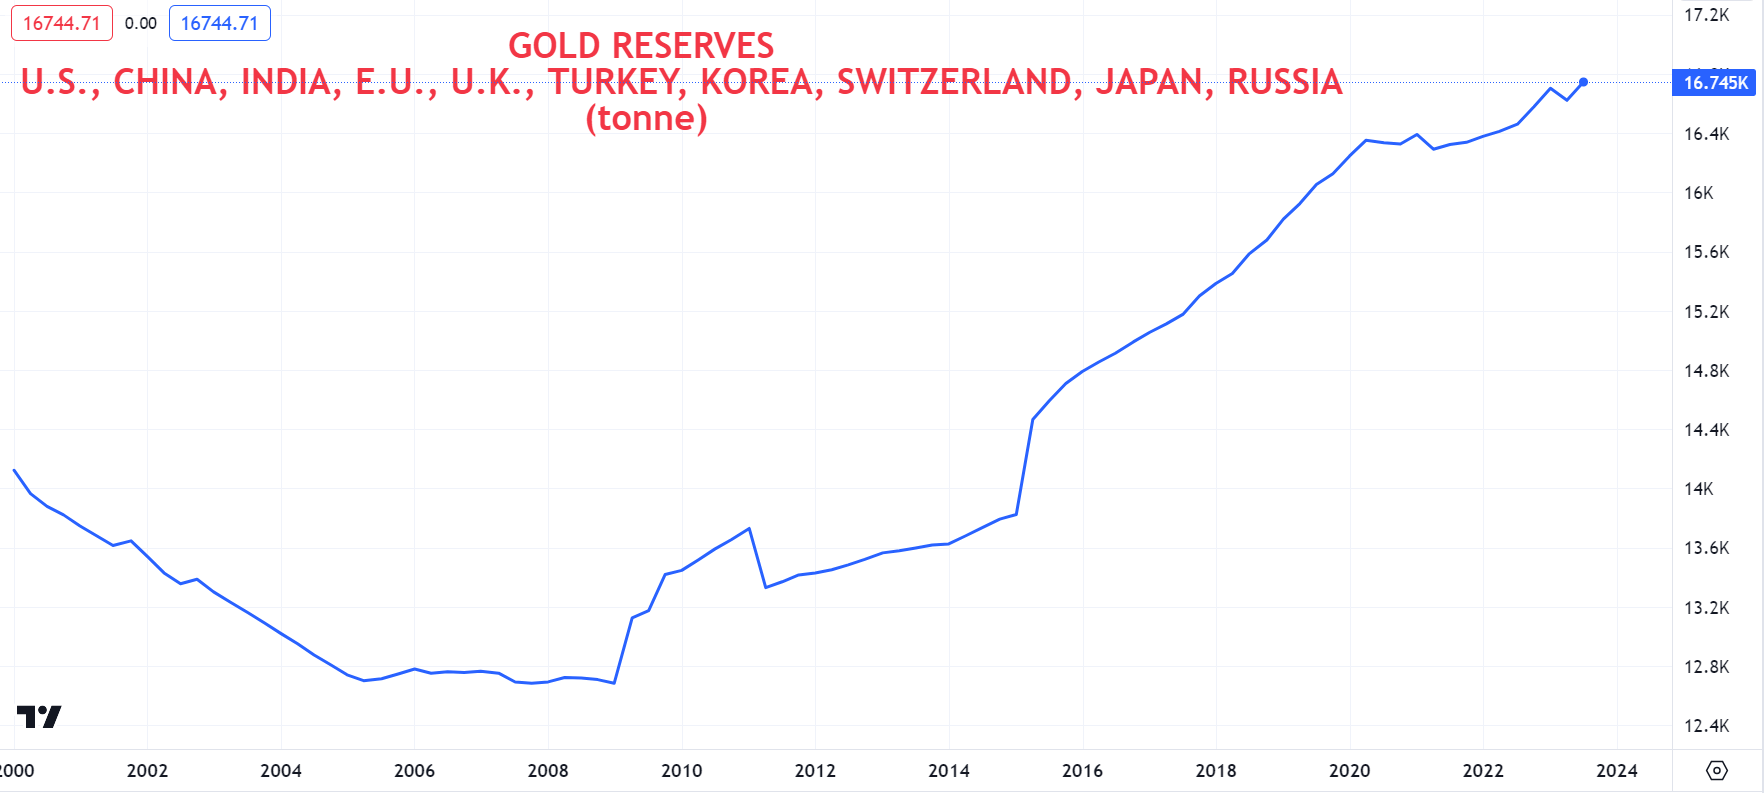
Combined, the largest gold reserve nations have been increasing their reserves by around 35% since the great financial crisis. This can be considered as constant government and central bank demand, and it can be expected to continue or accelerate due to the recent freezing of central bank's foreign assets as sanctions.
COMBINED GOLD RESERVES (TRADINGVIEW)
STATISTICS
GOLD BULL CYCLE
As veteran commodity traders often say, gold can stay stagnant for long years, but when it is in its bull cycle the growth can last for years and can be large in magnitude.
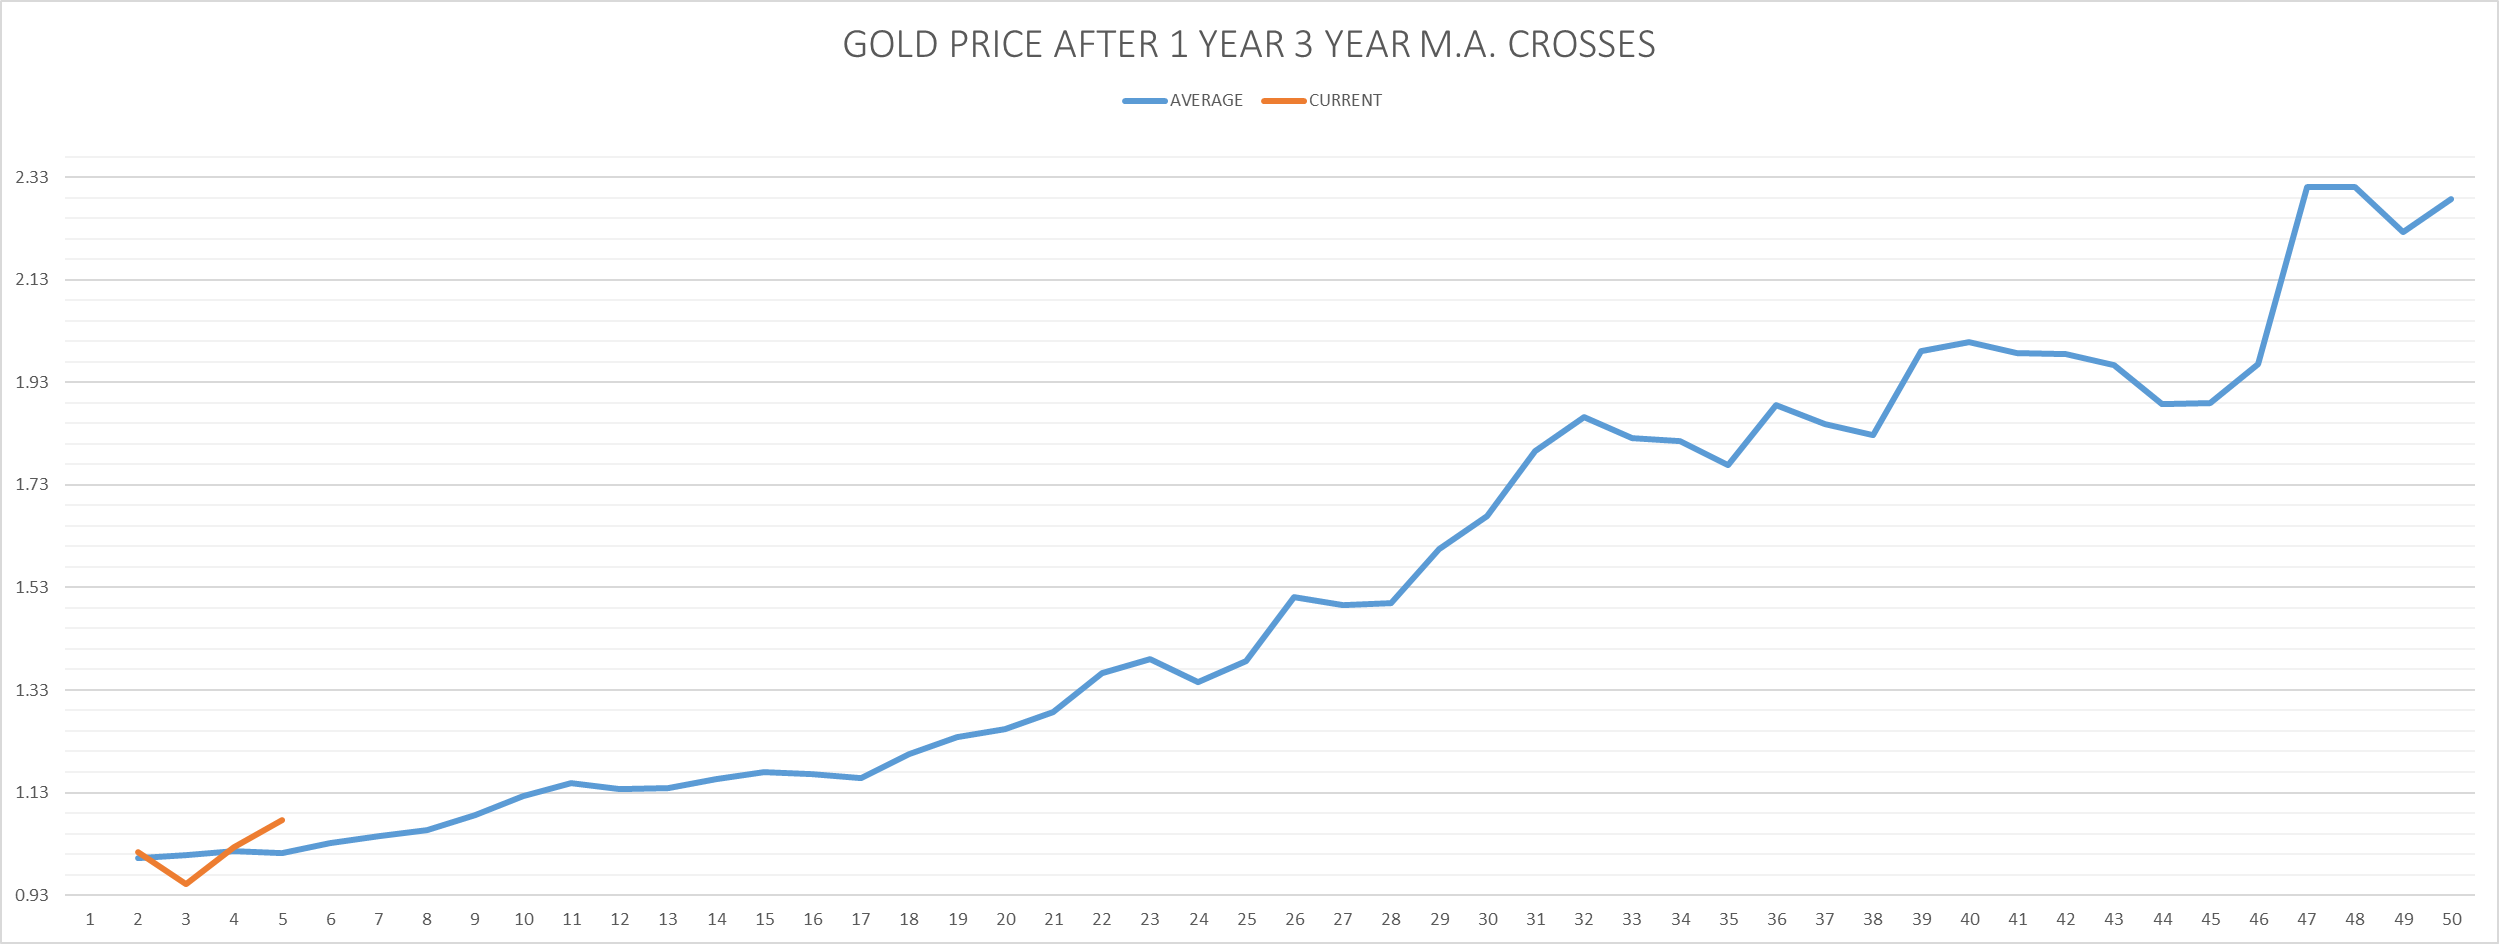
To capture when gold enters its bull cycle, the upward cross of the 1-year and 3-year moving averages were used, while the cycle end signal is when the 3-month moving average downward crossing the 3-year M.A.
GOLD 1 YEAR 3 YEAR MOVING AVERAGE CROSSES (TRADINGVIEW)
On average since the 1950s, a bull cycle lasts for 51 months. As the signal occurred again in June 2023, statistically the gold bull run should last for 45 months more, until October 2027.
GOLD PRICE AVERAGE AFTER 1YEAR 3YEAR MOVING AVERAGE CROSS (FRED)
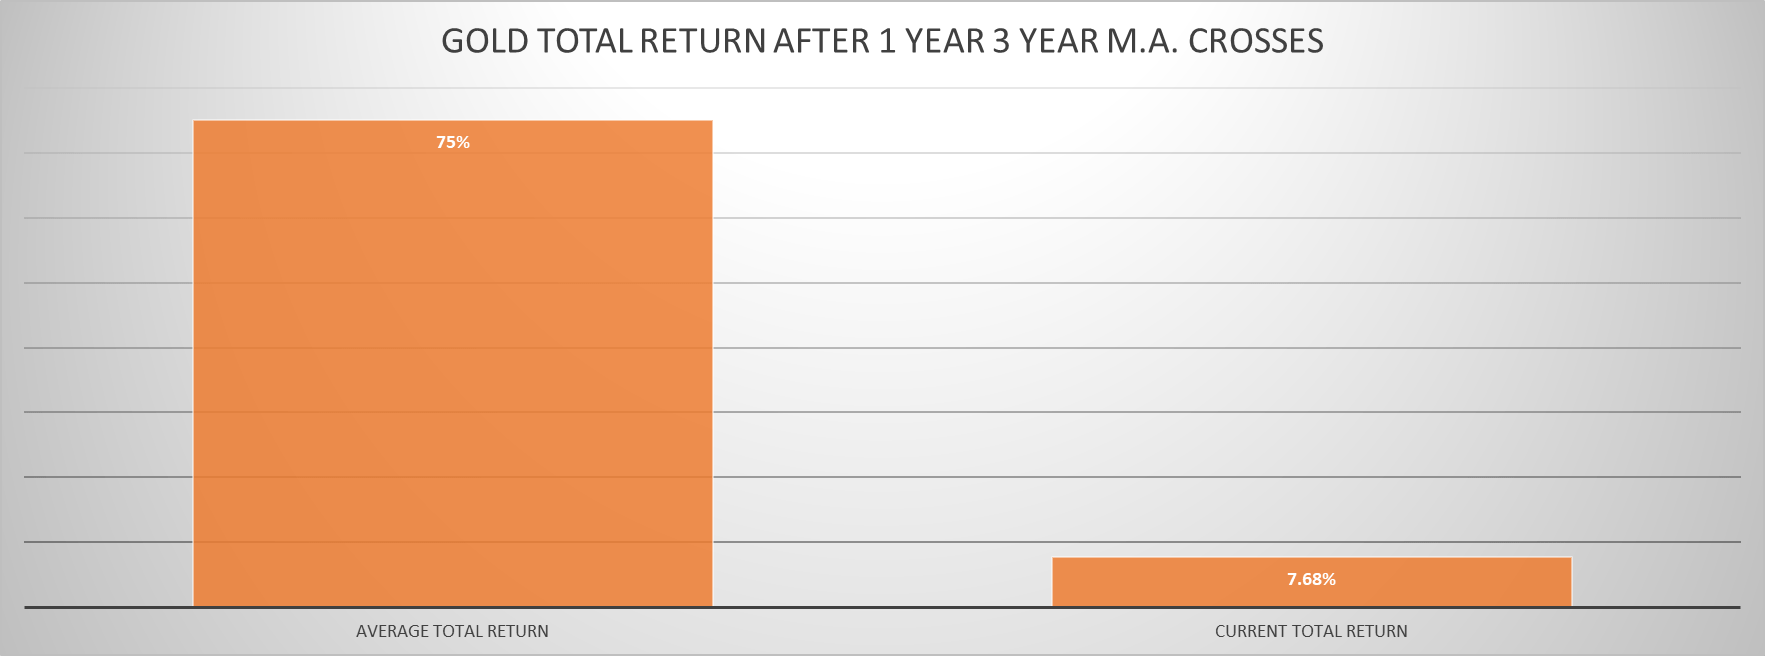
Historically, in a bull cycle, gold growth is 75%. As since the last signal gold price has risen 7.7%, there is supposed to be 68% further appreciation.
GOLD RETURN AFTER 1YEAR 3YEAR MOVING AVERAGE CROSS (FRED)
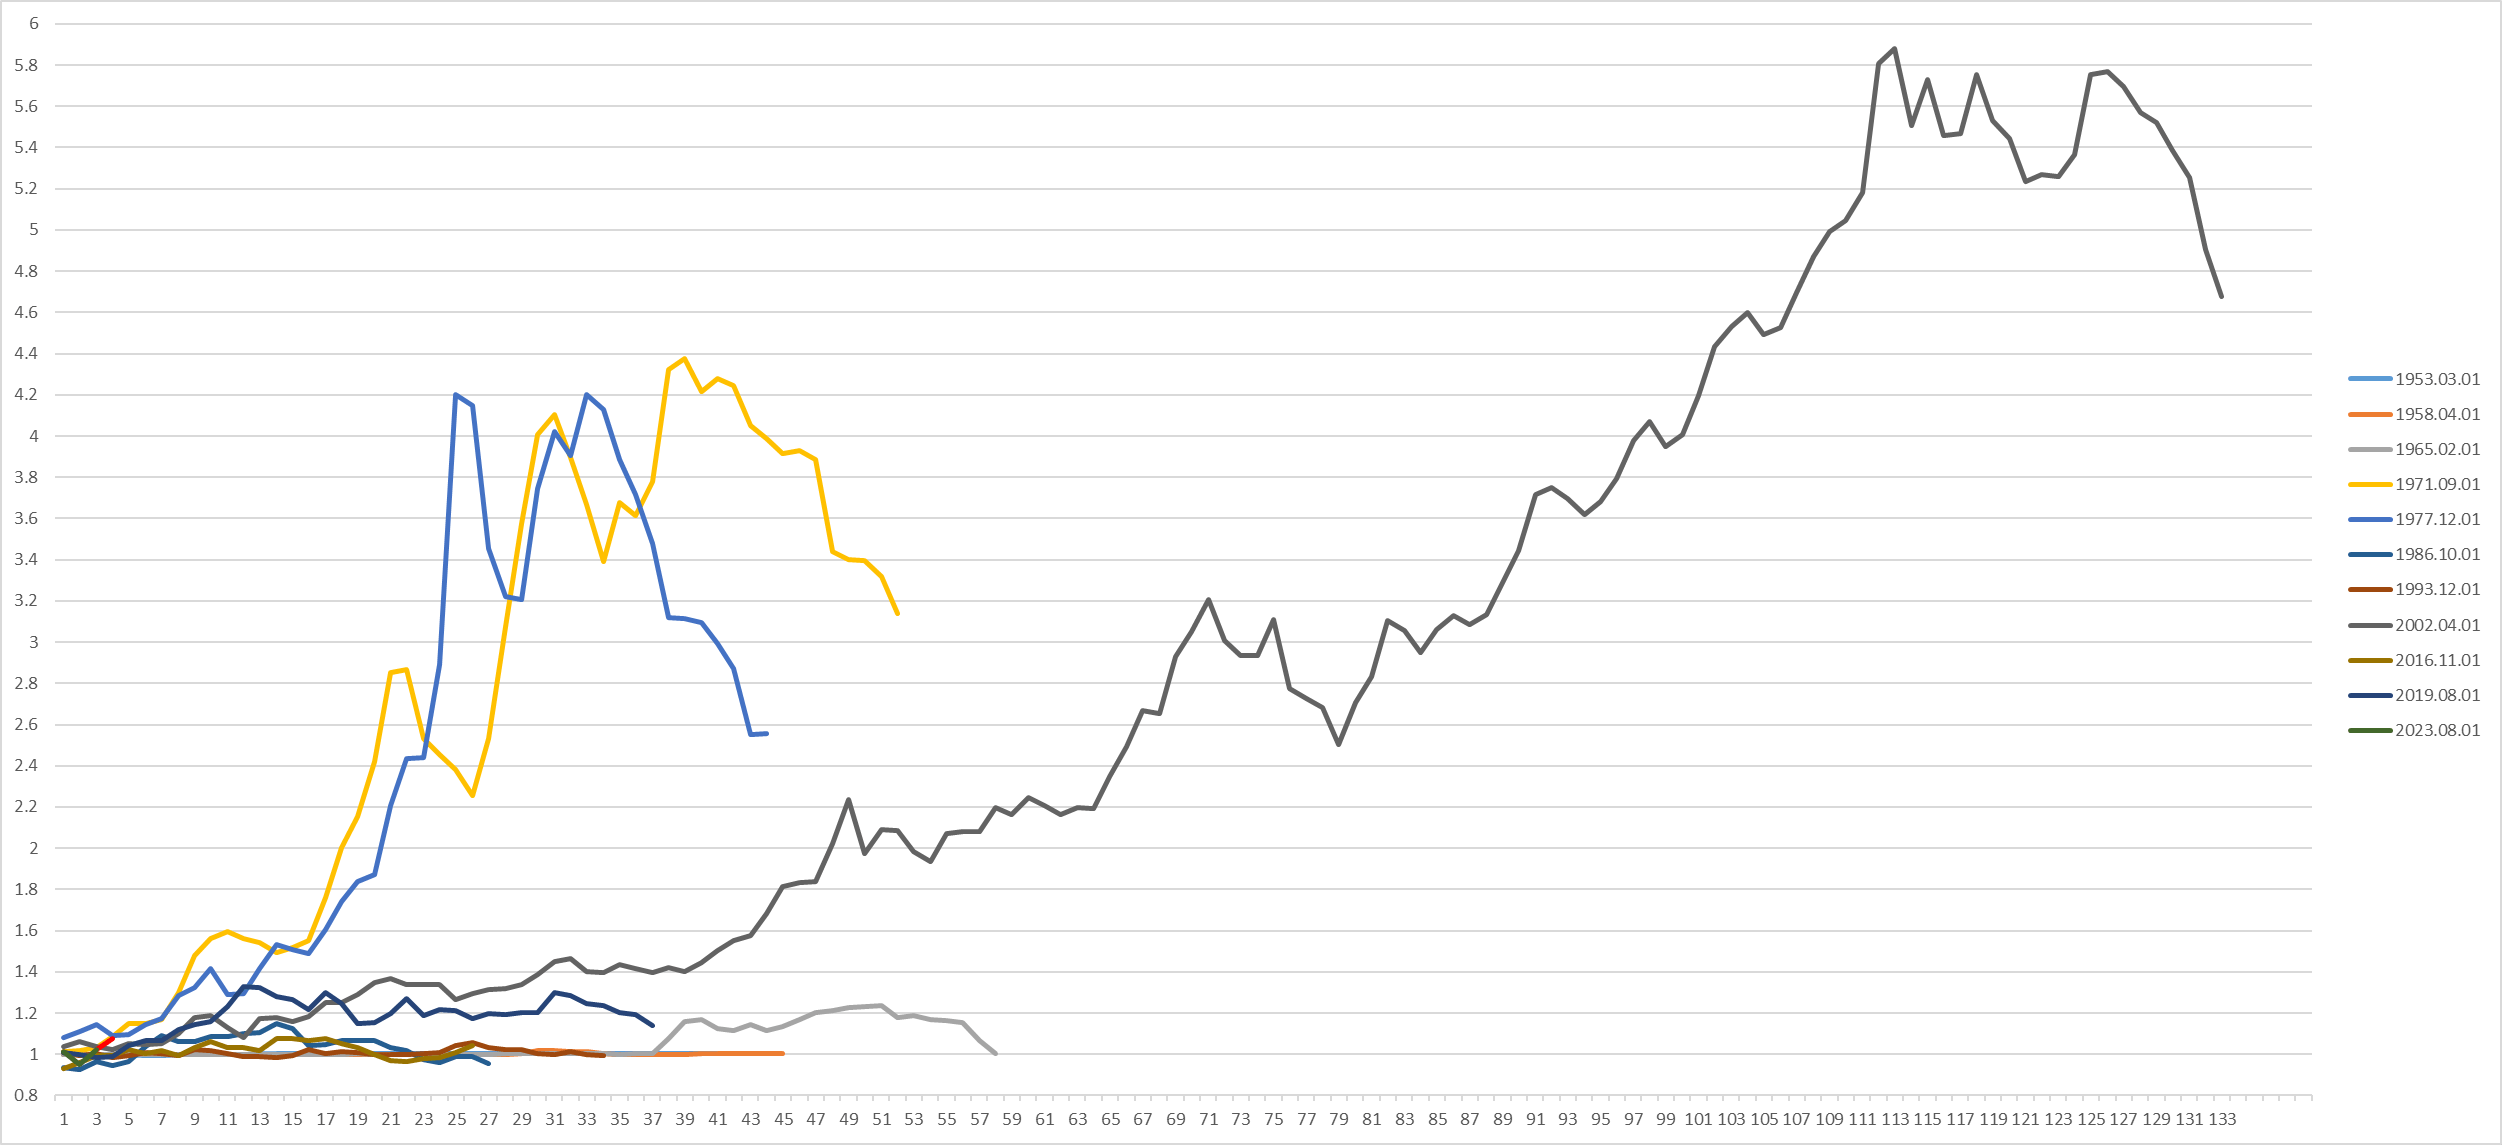
The greatest examined gold bull cycle lasted from April 2002 - to May 2013, for 134 months (11 years). During this period, gold prices rose 400-500% in total. Other significant bull runs were from Sept 1971 - January 1976 where price grew 200-300%, and between December 1977 - August 1981 which brought a 150-300% appreciation.
GOLD BULL CYCLES AFTER 1 YEAR 3 YEAR MOVING AVERAGE CROSS (FRED)
YIELD CURVE INVERSION
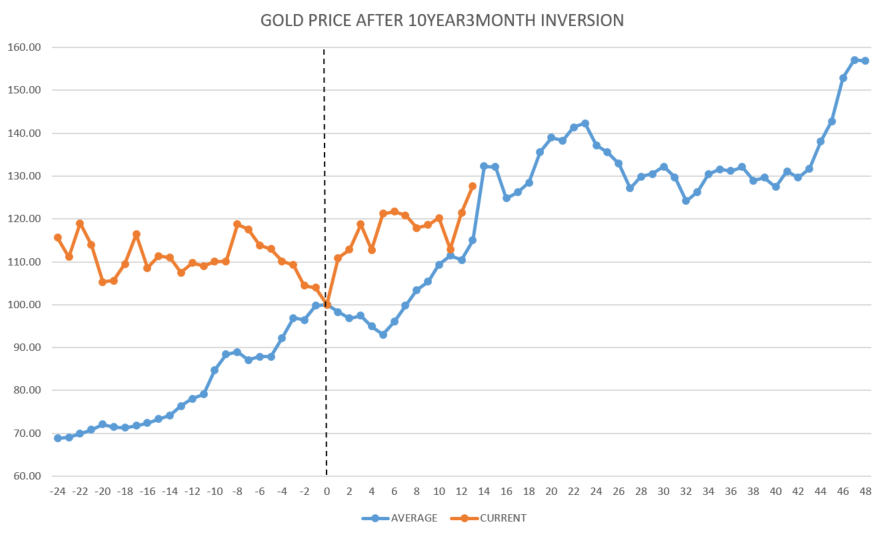
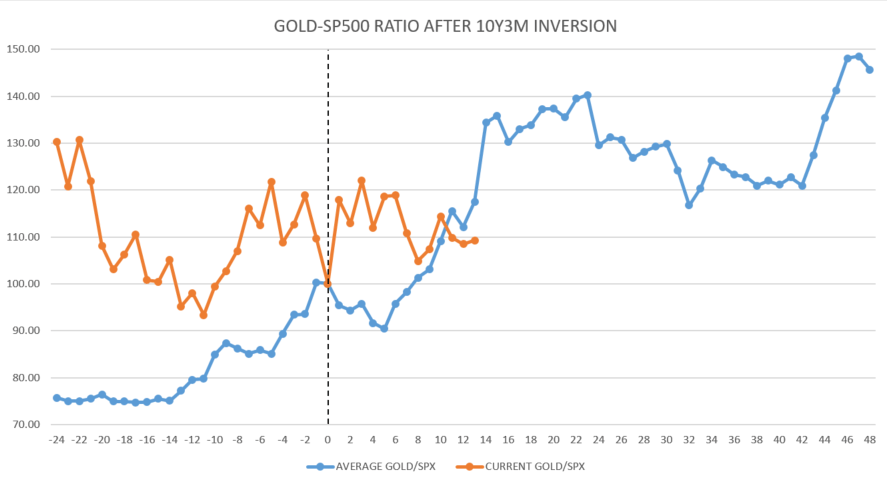
Yield curve inversions have been the most reliable recession and financial system turmoil signal historically, which environment supposedly benefits gold as a safe haven asset. Looking back to the 1960s, after the 10-year and 3-month yield curve inverts, gold price grows by 40% during the following 22 months. Notably, from the 23rd month, prices fall and stagnate until the 42nd month, before a 6-month sharp rise until the 48th month. As that part of the yield curve inverted in November 2022, gold prices should rise during the following 9 months, until September 2024. Then, the next shoot higher should occur around May 2026 until November 2026. Comparing it with the SP500, gold typically outperforms the US equity index by 40% during the same 22-month long bull run.
GOLD PRICE AVERAGE AFTER 10YEAR 3MONTH YIELD CURVE INVERSION (FRED)
GOLD TO SP500 RATIO AVERAGE AFTER 10YEAR 3MONTH YIELD CURVE INVERSION (FRED)
INTEREST RATE PEAK
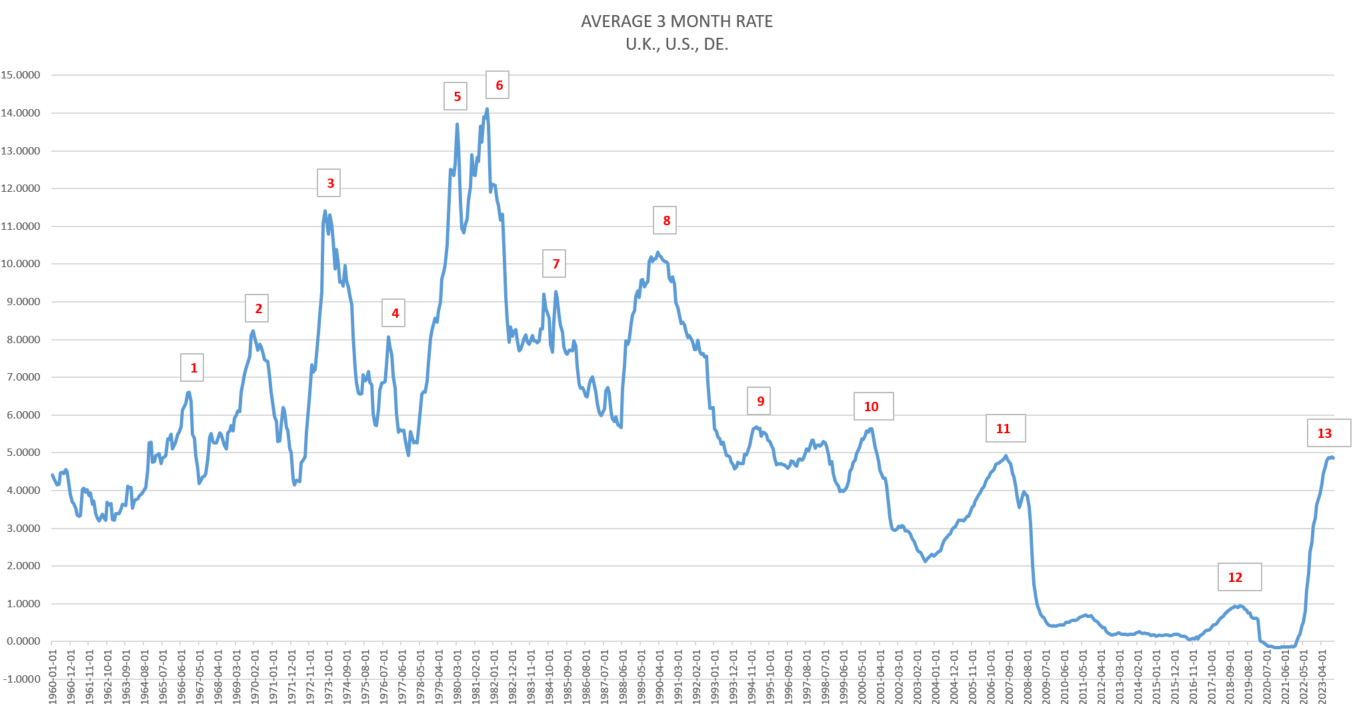
Obviously, gold is highly sensitive to global interest rates, therefore rates peaking in the major financial systems are supposed to be positive for gold prices. To examine, the peak in the average 3 months risk-free rate in the U.K., U.S. and Germany was established from 1960. A rate peak was considered when the average rate fell at least by 100bps (1%) afterward.
AVERAGE 3 MONTH RATE PEAK (US, UK, GERMANY) (FRED)
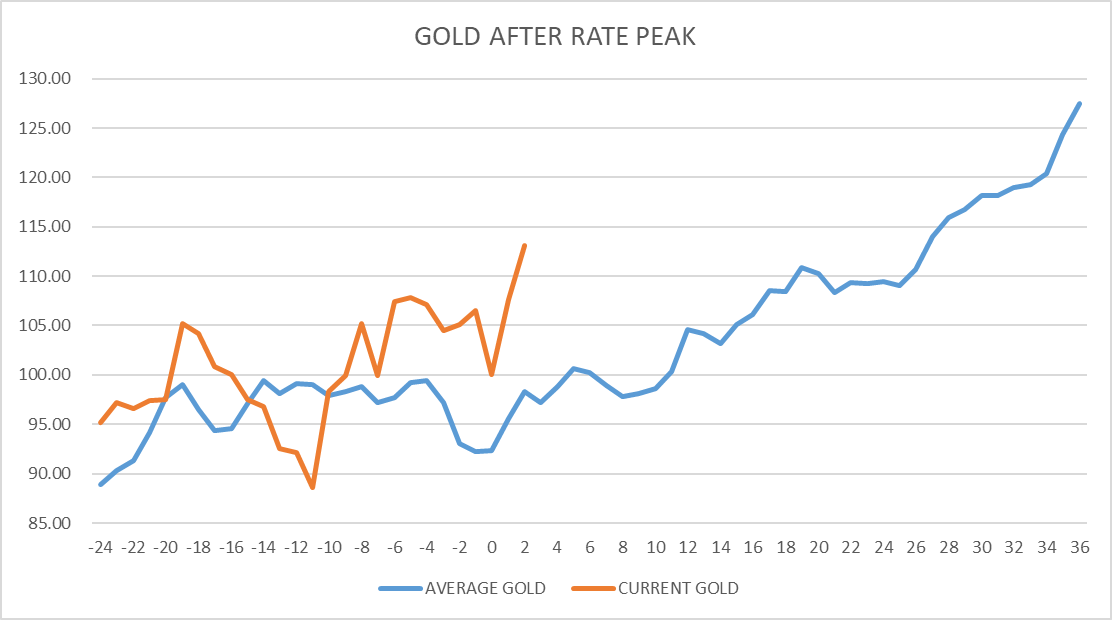
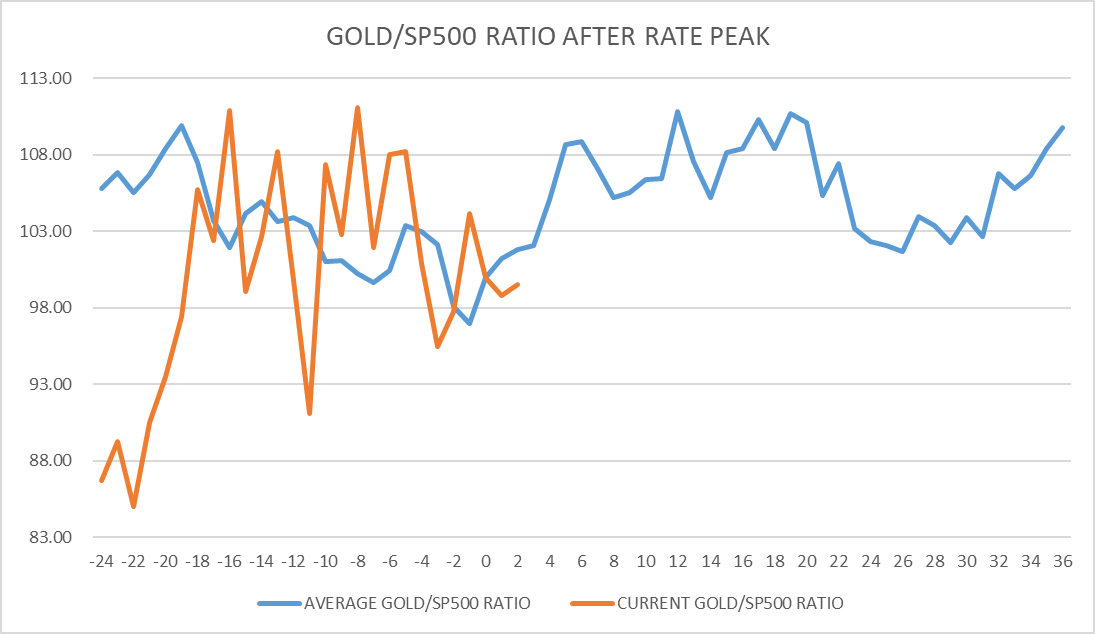
Based on the historical statistics, gold price grew by 25% during the 36-month period after the average rate peaks, while mostly stagnating during 24-month prior period. As the average rate supposedly peaked in October 2023, gold prices should rise by 20% further until October 2027. Investors may note, that during 20 months following the average rate peak, gold outperforms the SP500 by 10%, while underperforms it during the 20-month prior period.
GOLD PRICE AVERAGE AFTER RATE PEAK (FRED)
GOLD TO SP500 RATIO AVERAGE AFTER RATE PEAK (FRED)
COMBINED
Considering, that investors got a 10-year, 3-month yield curve inversion signal, a potential rate peak signal and the 1-year moving average upward crossing the 3-year M.A. signal, all at different times. Adjusting for the timing differences, based on those signals, the average historical outcome for gold price change was calculated.
COMBINED HISTORICAL AVERAGE BASED FORECAST (FRED)
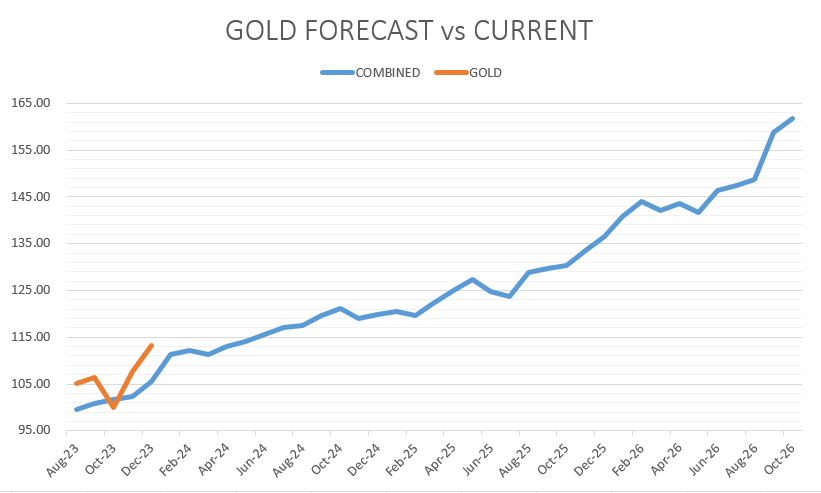
Based on the combined historical statistics, there is a significant appreciation ahead for gold. It projects that gold should rise 43% from current levels until October 2026 in a relatively stable uptrend, which suggests gold price will test $3000/OZ by the end of 2026.
INVESTING STRATEGY
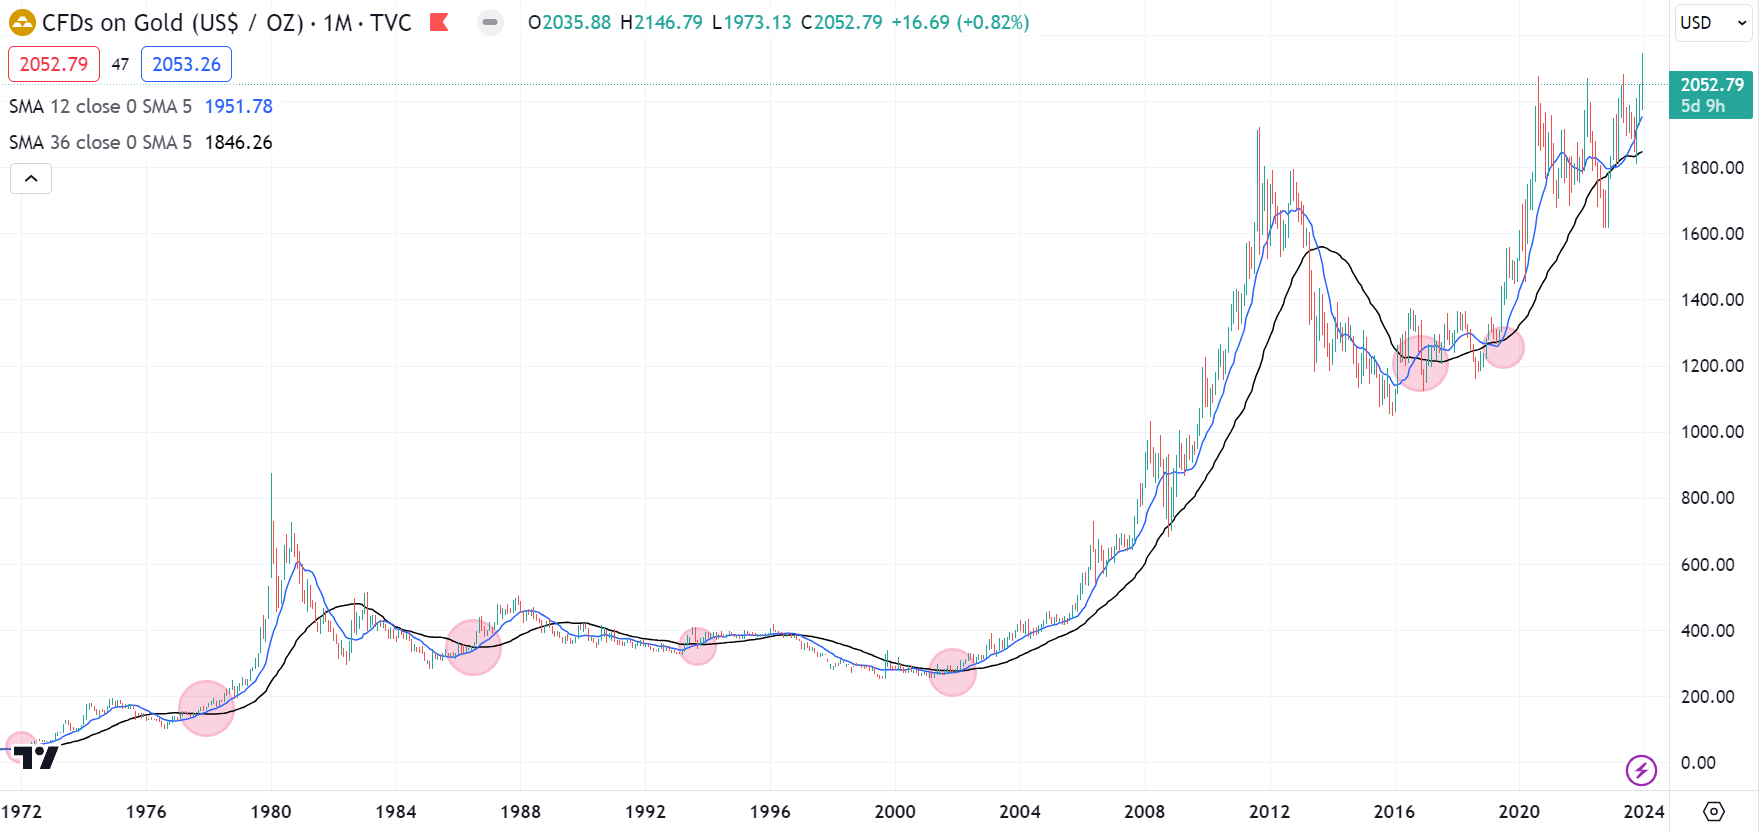
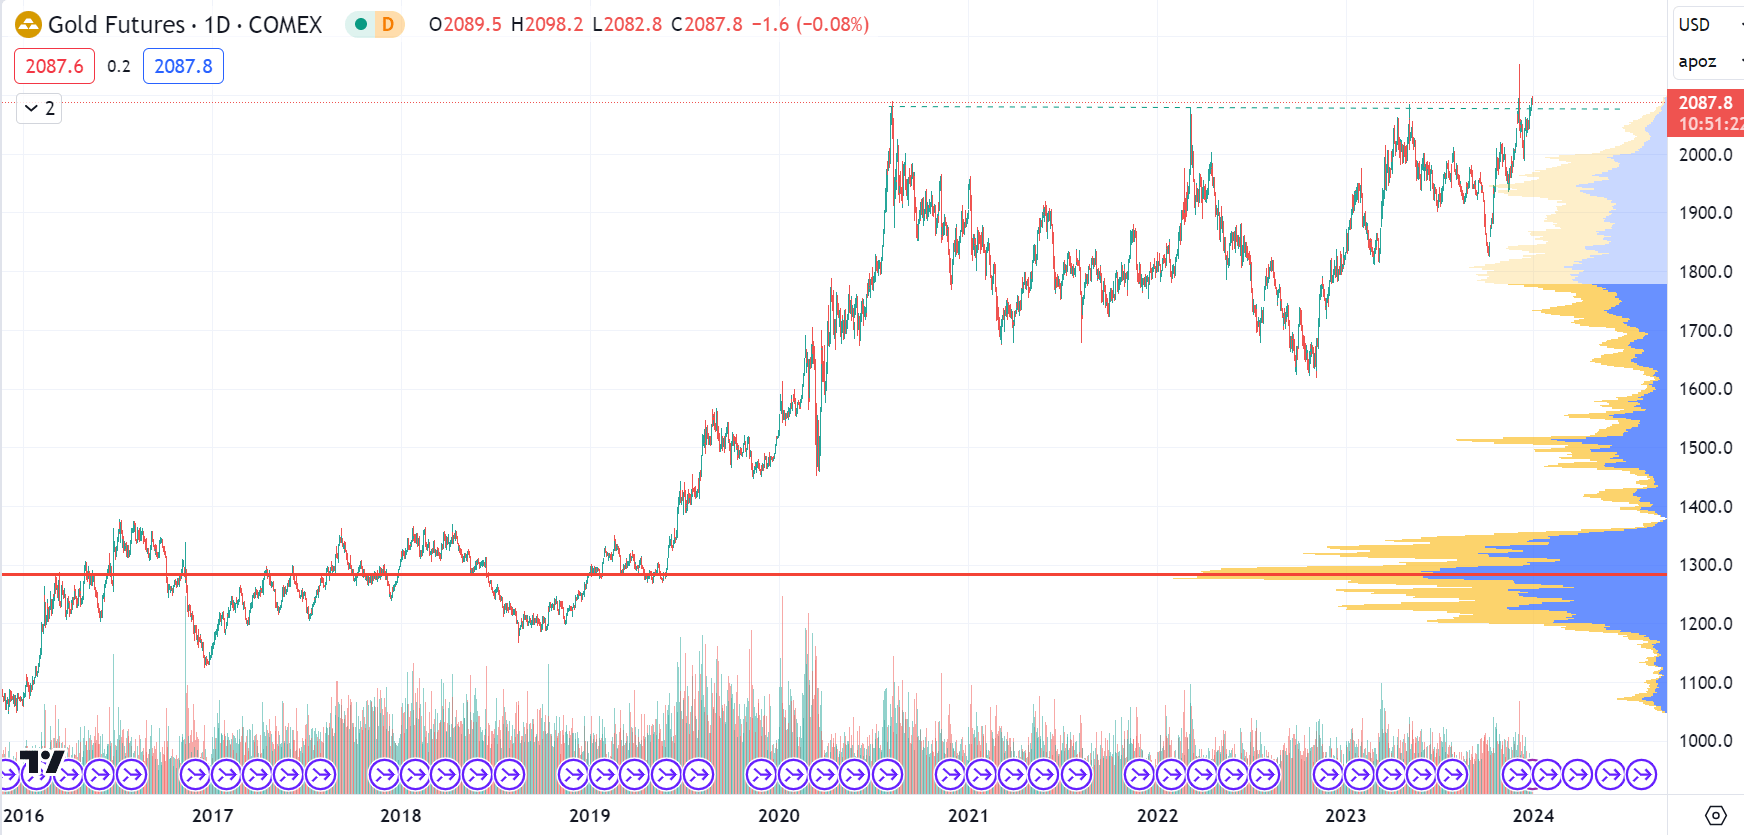
As gold's market price has been capped by $2100/OZ since 2020, investors can not be fully assured that the new gold bull cycle has started until the market is convincingly stabilizing above this key resistance level.
GOLD FUTURES PRICE (TRADINGVIEW)
Once investors experience that the market XAUUSD:CUR confidently broke this $2100 level and the metal's price is being constantly bought and finds a floor around there, it can be considered as a green light for gold to start marching towards $3000/OZ price as the historical statistics suggests. At that point, investors may consider starting building greater-sized, longer-term positions in physical gold ETFs such as GLD , AAAU , IAU.
For further details see:
Gold Analytics Signal Potential Birth Of A New Bull Cycle