GLDI - Gold: Decisive Directional Move Imminent (Technical Analysis)
Summary
- Gold is trading near the pivotal $1,700 level. A break below would complete a bearish topping pattern.
- More importantly, gold has served as a leading indicator for inflation. Gold broke out as early as June 2019, way ahead of the commodity complex.
- Gold's next big directional move feels decisive, not just for gold prices itself, but for the overall inflation narrative.
- The majority of the market remains focused on the inflation narrative out there, while there are signs under the surface that inflation may be topping out.
Precious metals have been touted as strong hedges against inflation, and gold ( GLD ) and silver's ( SLV ) recent lackadaisical price action might appear puzzling in the face of rising inflation and commodity prices.
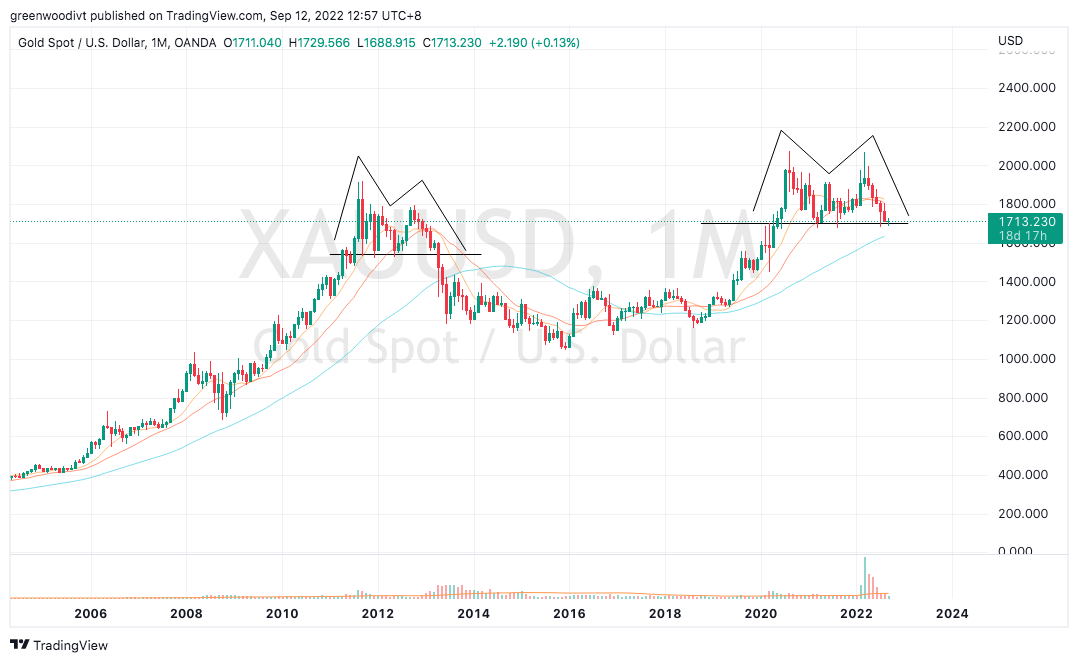
In fact, gold is now treading on thin ice, as it rests just above the neckline of a 3 month distribution pattern. From the long term monthly chart of gold below, a similar distribution pattern took place between 2011 to 2013. After price broke below the key neckline level in 2013, gold entered a bear market which lasted for close to 3 years, before seeing sideways action for a further 3 years.
Why does gold find itself in such a bothersome spot despite the higher inflation narrative out there?
Monthly Chart: Gold
Actually, one might argue that gold had served its purpose in sniffing out inflationary pressures way before they arrived.
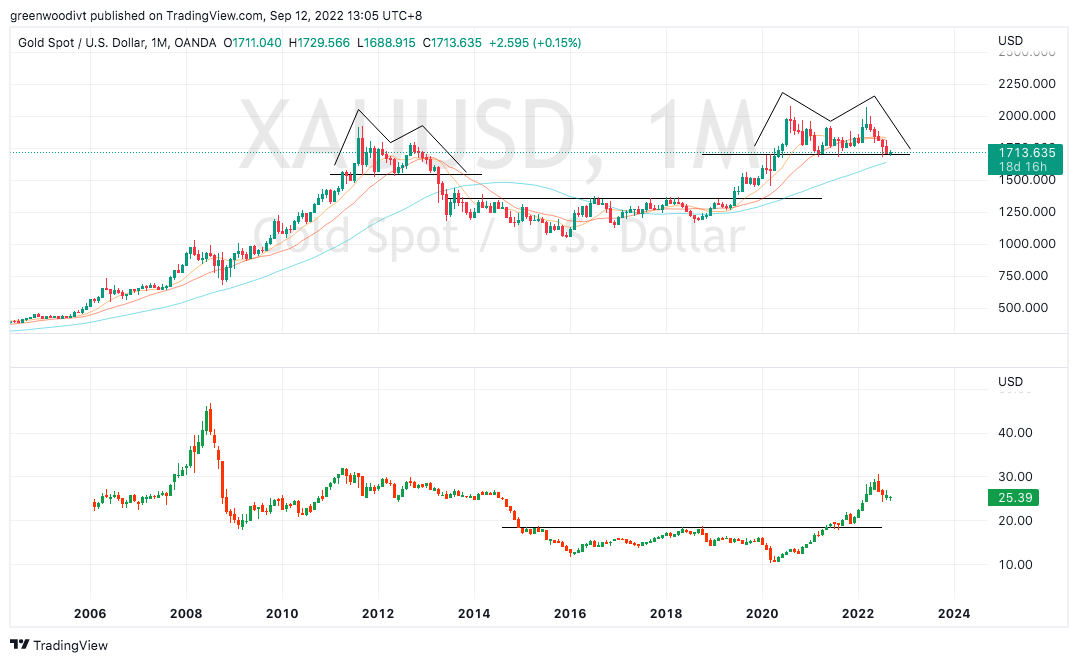
Looking at the monthly chart of gold (top panel) against the Invesco DB Commodity Index ( DBC ) (bottom panel), we may observe that gold broke out from its base ahead of the commodity complex. Gold broke out in 2019 while DBC broke out in 2021. Gold was a hedge against inflation, only ahead of time. Gold served as a leading indicator.
Monthly Chart: Gold (top panel) vs Invesco DB Commodity Index (bottom panel)
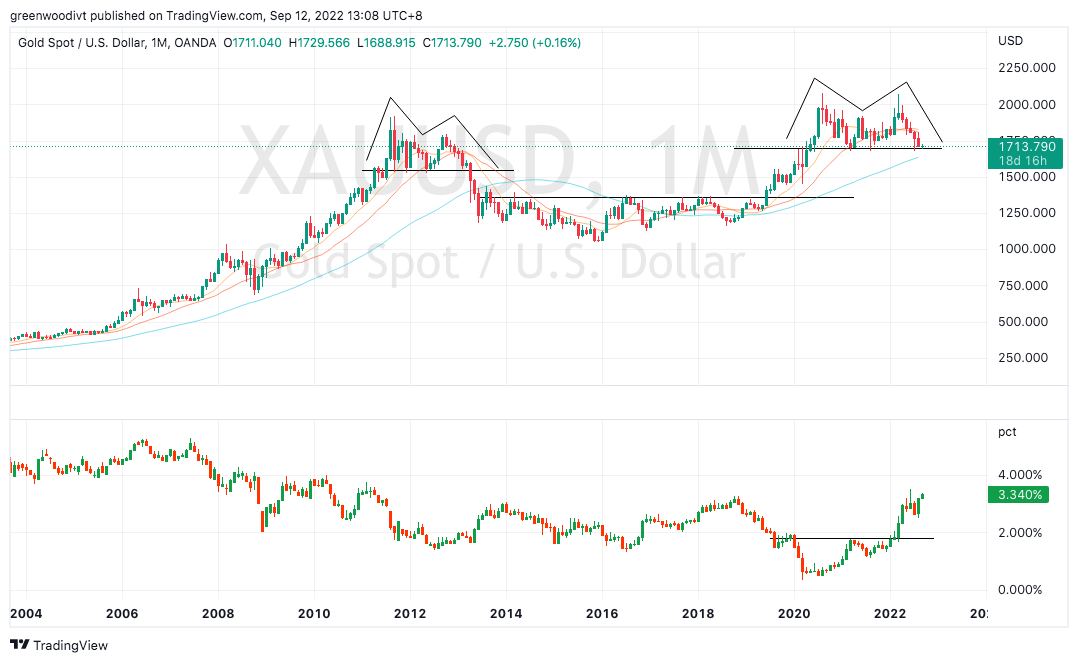
Gold is so ahead of the market in sniffing out inflationary pressures that when plotted against the US 10 Year Yield (bottom panel), we may observe that the Fed's rate hike trajectory only brought about a breakout higher in the US10Y in March 2022. Central bank rate hikes tend to be late to the game, whereas the market is a forward-looking mechanism.
Monthly Chart: Gold (top panel) vs US 10 Year Yield (bottom panel)
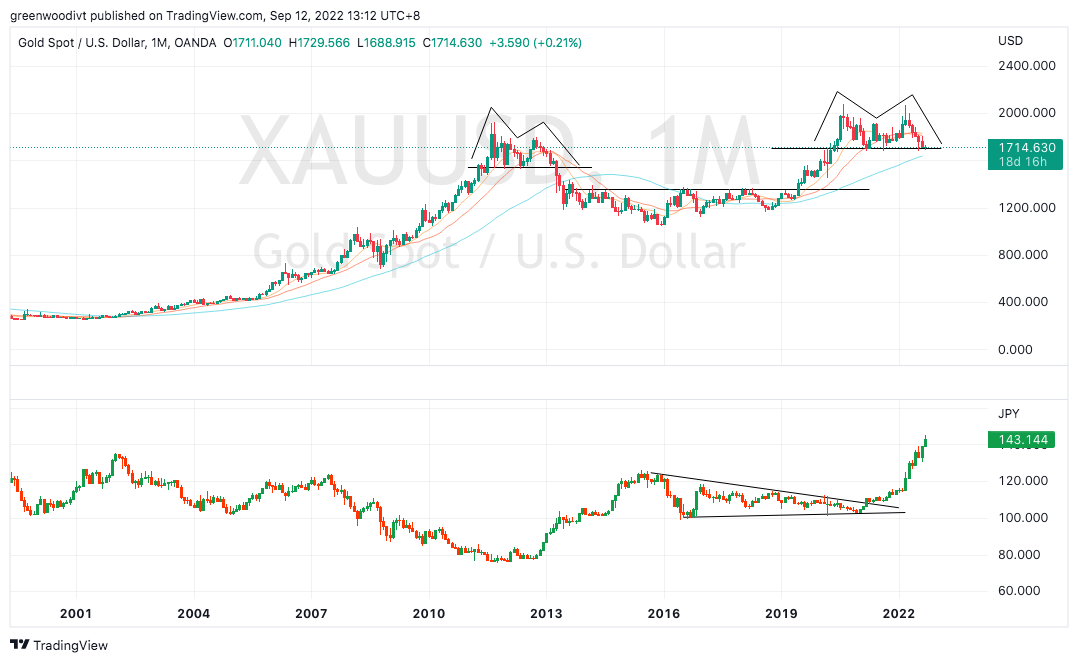
The Fed's aggressive rate hike trajectory then brought about a surge in the USD, particularly against the JPY due to the Bank of Japan's refusal to raise interest rates. The breakout in USD/JPY took place in March 2021, in line with the rise in treasury yields.
Monthly Chart: Gold (top panel) vs USD/JPY (bottom panel)
Hence, putting the pieces together, central banks are working hard to raise interest rates now to combat inflationary pressures. This is the leading narrative in the market right now that has captured the attention and fears of market participants.
However, when we take a deeper look under the surface and ignore the news / media, there is an increase in the number of signals that point towards inflation topping out.
For one, gold is building a topping pattern, as covered above. If gold breaks below the $1,700 neckline, this could be a leading indicator for inflation to top out.
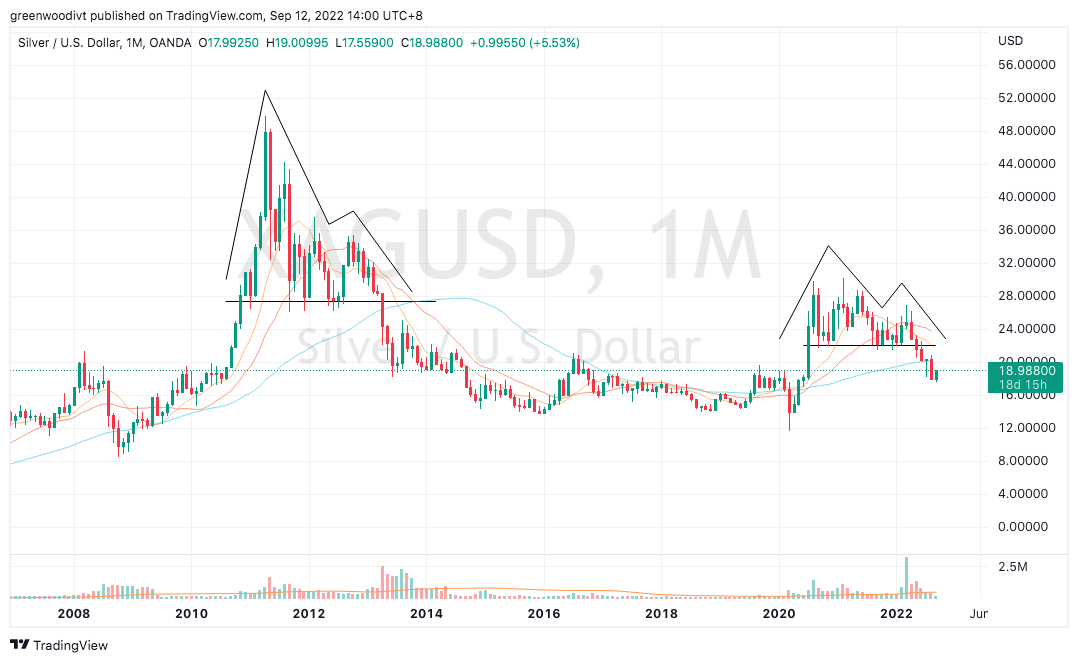
While gold has not broken below its pivotal neckline to complete the bearish topping pattern, silver has already done so. From the monthly chart below, silver cracked below its neckline back in May this year.
Monthly Chart: Silver
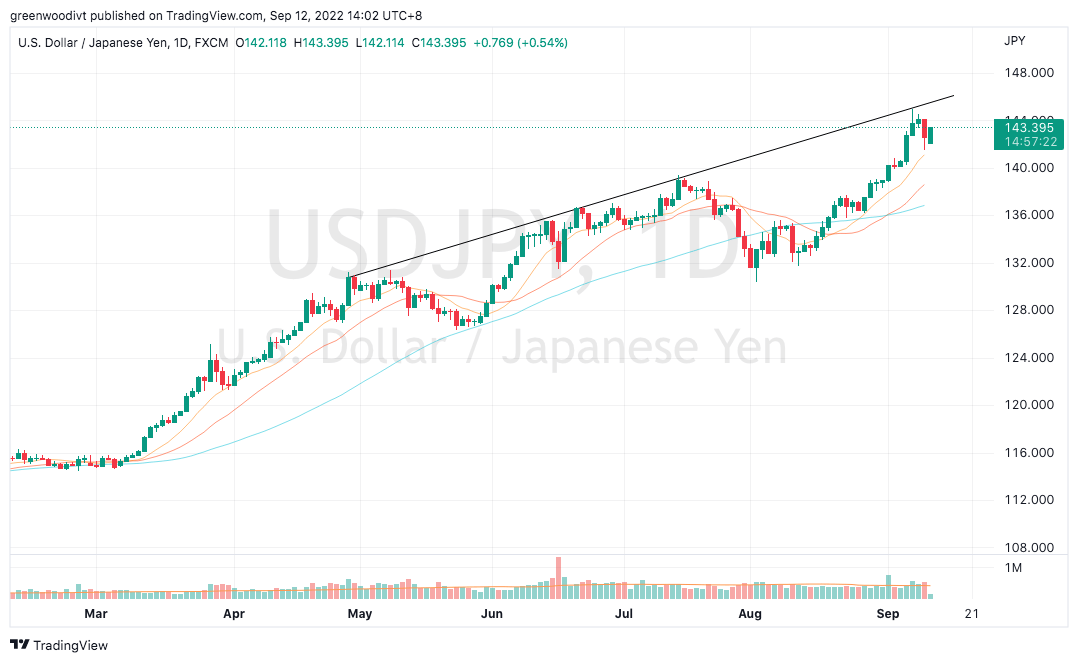
Next, USD/JPY is starting to meet with near-term resistance. While there are no signs yet for a sustained reversal, this is a key market to watch. I wrote more about this here . In the same article, I also wrote on signs of weakness in the oil markets.
Daily Chart: USD/JPY
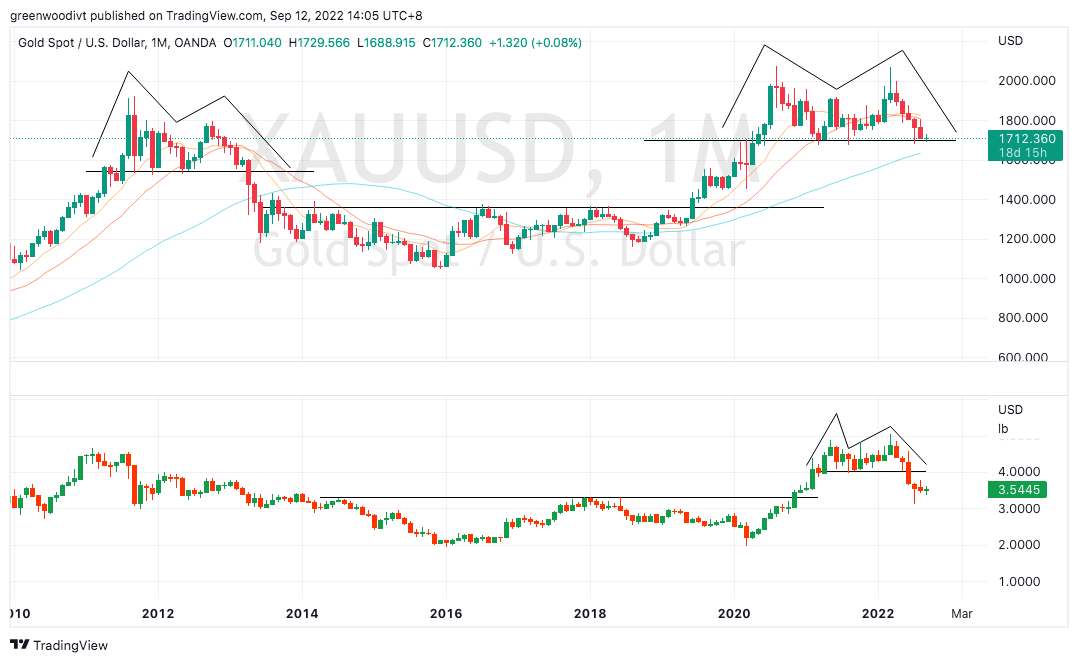
Lastly, Dr. Copper is another leading indicator for inflation. When plotted against gold, with gold at the top panel, and copper at the bottom panel, gold still broke out earlier than the commodities complex in May 2019, but Copper quickly followed suit in November 2020. Copper then broke down from a potential distribution pattern in June 2022, which is a red flag.
Monthly Chart: Gold (top panel) vs Copper (bottom panel)
All in all, there are signs that inflation may be topping out, and gold breaking below the $1,700 level will be another feather in the cap for this camp.
That said, I remain neutral on gold until the market makes a decisive directional move. If gold breaks down, I will likely build short positions.
In the bigger scheme of things, growth stocks and cryptocurrencies have been in bear markets because of higher inflation. What are the implications if inflationary pressures start to recede?
The majority of the market remains focused on the inflation narrative out there, while there are signs under the surface that inflation may be topping out. This presents a huge opportunity.
For further details see:
Gold: Decisive Directional Move Imminent (Technical Analysis)