GLDM - Gold Demand Trends Q2 2023
2023-08-02 12:00:00 ET
Summary
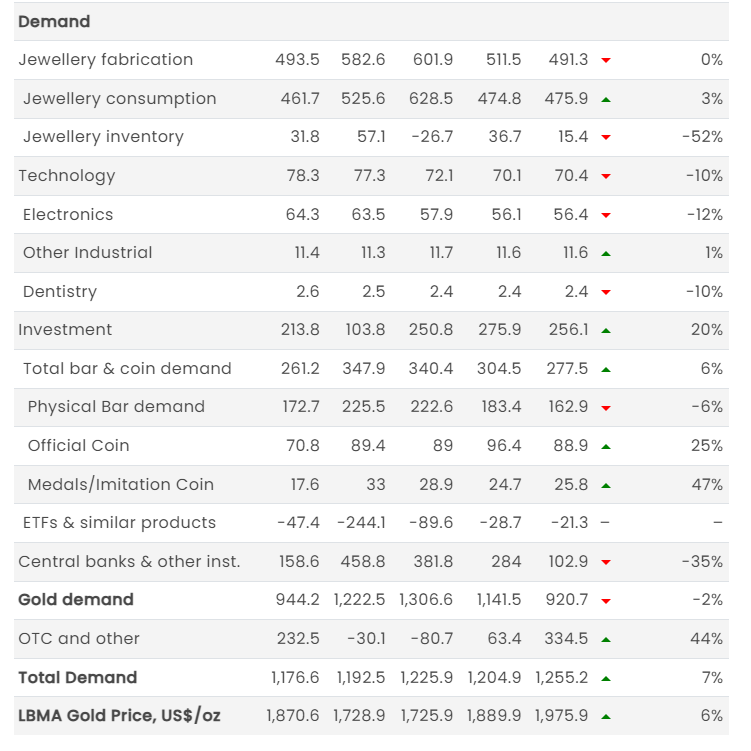
- Q2 gold demand (excluding OTC) dropped slightly by 2% y/y to 921t, driven by a marked deceleration in net central bank buying compared to above-average purchases in Q2’22.
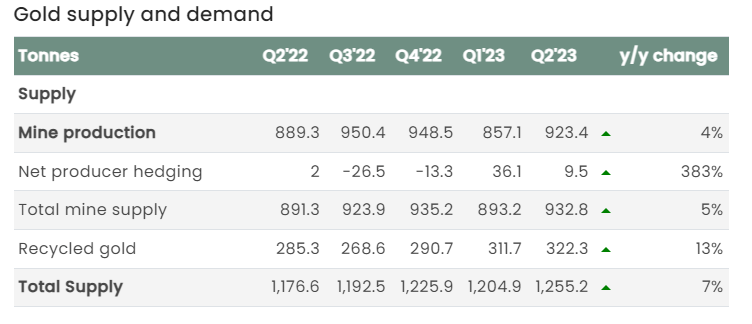
- Inclusive of OTC and stock flows, total demand strengthened 7% y/y to 1,255t.
- Demand for gold used in technology remained very soft thanks to continued weakness in consumer electronics; it held at just 70t for a second consecutive quarter.
Gold supported in Q2 despite softer central bank demand
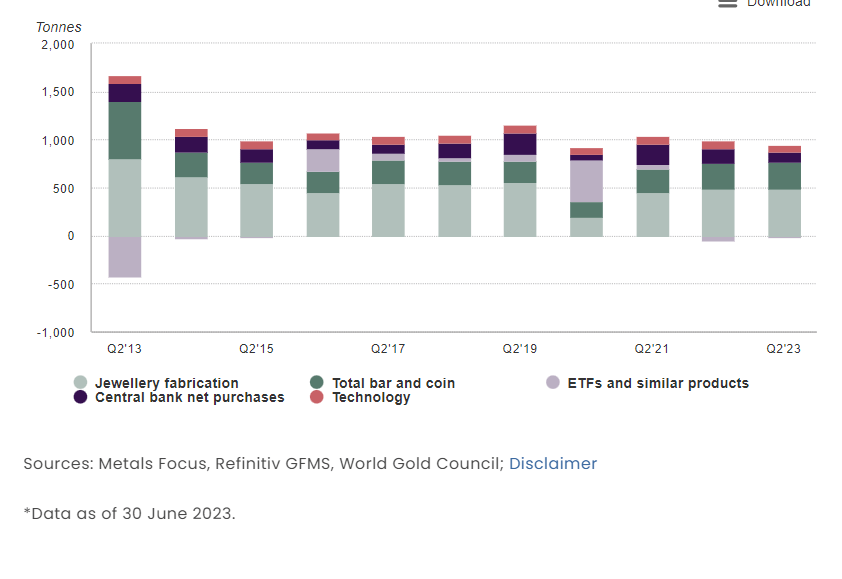
Central bank buying slowed in Q2 but remained resolutely positive. This, combined with healthy investment and resilient jewellery demand, created a supportive environment for gold prices.
Q2 gold demand (excluding OTC) dropped slightly by 2% y/y to 921t, driven by a marked deceleration in net central bank buying compared to above-average purchases in Q2’22. Inclusive of OTC and stock flows, total demand strengthened 7% y/y to 1,255t. 1
Despite sales from Turkey in response to specific local market conditions, the 103t of net official sector purchasing in Q2 is in line with the underlying positive trend towards gold among central banks.
Jewellery consumption managed a modest improvement despite the high gold price environment, up 3% y/y at 476t. With jewellery fabrication of 491t, inventories increased by around 15t in Q2, in part as Chinese jewellery consumption failed to meet the trade’s optimistic expectations.
Bar and coin investment increased by 6% y/y to 277t in Q2, with Turkey a major driver of growth. And while ETFs saw net outflows of 21t (concentrated in June) these were notably smaller than the 47t outflow in Q2’22.
OTC investment jumped in Q2, reaching 335t. Although opaque, demand from this sector of the market was apparent as the gold price found firm support even in the face of ETF outflows and a reduction in COMEX net longs.
Demand for gold used in technology remained very soft thanks to continued weakness in consumer electronics; it held at just 70t for a second consecutive quarter.
Total gold supply was 7% higher y/y at 1,255t, lifted by growth in all segments. Mine production is estimated to have reached a record for H1 of 1,781t.
Firmer jewellery and investment demand helped offset slower central bank buying in Q2*
Highlights
The LBMA ((PM)) gold price averaged US$1,976/oz during Q2, a record high. This price was 6% higher y/y and 4% above the previous record high from Q3’20. Currency moves meant that several countries saw further strength in local gold prices, notably China and Turkey.
H1 gold demand (excluding OTC) was 6% lower at 2,062t. The y/y decline was largely explained by this year’s modest outflows from gold ETFs being compared with the strong surge of inflows in early 2022. Total demand in H1 (inclusive of OTC and stock flows) increased by 5% to 2,460t.
Central bank gold buying in H1 reached a first-half record of 387t. Despite the Q2 slowdown, the strong Q1 start set the seal on a record-breaking H1. Buying activity remains widespread and distributed among both emerging and developed countries.
Local market conditions have driven exceptional gold demand in Turkey in recent quarters. Combined H1 jewellery, bar and coin demand reached 118t, the highest first half year since 2007 when Turkish lira gold prices were a fraction of their current record levels. Presidential elections, dizzying inflation and currency weakness all contributed to drive demand up.
Gold recycling for the first half was 9% higher y/y, with much of that growth coming from China and India. Base effects played a role in both markets, as recycling had been relatively weak in Q2’22. Recycling activity has yet to pick up, notably in Western markets, despite high gold prices and cost of living pressures.
Source: ICE Benchmark Administration, Metals Focus, World Gold Council
Footnotes
-
See Notes and definitions
Disclaimer
Copyright and other rights
© 2023 World Gold Council. All rights reserved. World Gold Council and the Circle device are trademarks of the World Gold Council or its affiliates.
Any references to LBMA Gold Price are used with the permission of ICE Benchmark Administration Limited and have been provided for informational purposes only. ICE Benchmark Administration Limited accepts no liability or responsibility for the accuracy of the prices or the underlying product to which the prices may be referenced. All third-party content is the intellectual property of the respective third party and all rights are reserved to such party.
Reproduction or redistribution of any of this information is expressly prohibited without the prior written consent of World Gold Council or the appropriate intellectual property owners, except as specifically provided below.
Use of any statistics in this information is permitted for the purposes of review and commentary in line with fair industry practice, subject to the following pre-conditions: (i) only limited extracts may be used; and (ii) any use must be accompanied by a citation to World Gold Council and, where appropriate, to Metals Focus, Refinitiv GFMS, or other identified third party, as their source.
World Gold Council does not guarantee the accuracy or completeness of any information and does not accept responsibility for any losses or damages arising directly or indirectly from the use of this information.
This information is not a recommendation or an offer for the purchase or sale of gold or any products, services, or securities.
This information contains forward-looking statements, which are based on current expectations and are subject to change. Forward-looking statements involve a number of risks and uncertainties. There is no assurance that any forward-looking statements will be achieved.
Information regarding Qaurum SM and the Gold Valuation Framework
Note that the resulting performance of various investment outcomes that can generated through use of Qaurum, the Gold Valuation Framework and other information are hypothetical in nature, may not reflect actual investment results and are not guarantees of future results. Neither WGC nor Oxford Economics provides any warranty or guarantee regarding the functionality of the tool, including without limitation any projections, estimates or calculations.
Editor's Note: The summary bullets for this article were chosen by Seeking Alpha editors.
For further details see:
Gold Demand Trends Q2 2023