GFI - Gold Fields: A Weak Production Quarter
2023-06-21 15:58:14 ET
Summary
- Gold Fields Limited's attributable gold production was 577.5K Oz in 1Q23, against 579.9K Oz in 1Q22. AISC for the quarter was $1,152/oz, also largely flat YoY and up 8% QoQ.
- Net debt at the end of the quarter was $875 million, compared to $704 million at the end of December 2022.
- I recommend buying Gold Fields stock between $14.2 and $13.5, with possible lower support at $13.
Introduction
In 2021, Johannesburg-based Gold Fields Limited (GFI) released its Operational update for the quarter that ended March 31, 2023, on May 4, 2023.
Note: This article updates my November 30, 2022, article. I have followed GFI on Seeking Alpha since April 2021.
The South African gold miner reported a lower production quarter of 577.5K Au Oz for 1Q23. However, the miner said it is on track to meet its production and cost guidance for the full year.
Gold Fields remains on track to meet the original production and cost guidance provided in February 2023.
- Attributable gold equivalent production (excluding Asanko) is expected to be between 2.25Moz - 2.30Moz (2022 comparable was 2.32Moz).
- AISC is expected to be between US$1,300/oz - US$1,340/oz , with AIC expected to be US$1,480/oz - US$1,520/oz.
- The exchange rates used for our 2023 guidance are: R/US$17.00 and US$/A$0.70.
On March 24, 2023, we learned that:
The head of Gold Fields' West Africa unit said he anticipates the conclusion of a proposed joint venture agreement with AngloGold Ashanti ( AU ) on their mines in Ghana by year-end 2023 or early next year, Reuters reported Friday.
On May 2, 2023, Gold Fields and Osisko agreed to Develop the Windfall Project (underground)in Québec, Canada. The partnership is known as the Windfall Mining Group.
Gold Fields, through a 100% held Canadian subsidiary, has acquired a 50% interest in the feasibility stage Windfall Project (including exploration potential) on the following key terms:
- Cash payment of C$300m (US$220million) paid on signing;
- Cash payment of C$300m payable on the issuance of key permits by the Deputy Minister of Québec's Ministère de l'Environnement, de la Lutte contre les changements climatiques, de la Faune et des Parcs (MELCCFP) to the Partnership authorizing the construction and operation of the Windfall Project;
- 50/50 co-share of interim and construction capital expenditures. In addition, we have also acquired a 50% up-front vested interest in Osisko's highly prospective Urban Barry and Quévillon district exploration camps, totaling approximately 2,400km2 (Exploration Properties), which will be co-explored and co-developed under the Partnership.
- In exchange, Gold Fields will fund the first C$75 million in regional exploration on those Exploration Properties over the first seven years of the Partnership.
The news and the bullish gold price at the time significantly boosted GFI, as shown below.
1 - Stock performance
GFI has significantly overperformed the Group on the news and is now up 46% annually.
2 - The investment thesis
Gold Fields Limited stock is an excellent choice for a long-term investment in the gold sector. However, the stock price seems pretty high, and it may be time to wait for a retracement before buying.
The company is well diversified (Africa, Australia, and South America) and presents a good growth potential with its Salares Norte project , completed at 90.4% as of March 31, 2023.
The Salares Norte project continued to make positive progress during the March quarter. Total construction progress at the end of March was 90.3% compared to 85.7% at the end of Q4 2022. The project is fully staffed with the camp at full capacity. In addition to completing construction, the focus at the project includes dealing with punch list items to ensure successful commissioning. Total project progress was 90.4% as at the end of March 2023 compared to 86.7% at the end of December 2022.
Total spend for the March quarter was US$115m , comprising of US$92m in capital expenditure, US$10m in exploration expenditure and a US$13m investment in working capital.
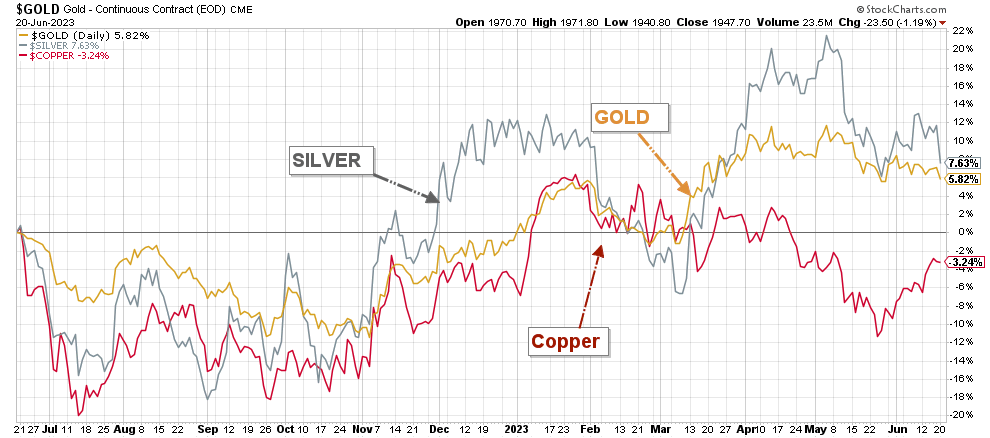
However, this Gold Fields is highly correlated to the gold price even if the company also produces a little copper.
The outlook for gold is strong, but weakening slightly since the Fed decided to pause hiking interest rates after a drop in inflation. With the U.S. dollar strengthening, we may experience further weakness in the gold sector shortly, but overall, I am quite bullish for the mid-term. Gold is up roughly 6% on a one-year basis.
GFI 1-Year Chart Comparison Gold Silver Copper (Fun Trading StockCharts)
Thus, it is critical to trade short-term volatility, and I recommend using about 50% of your position to take advantage of the short-term fluctuations.
I recommend trading LIFO while keeping a core long-term position for a much higher level and enjoying a significant dividend yield of 2.82% while waiting.
Gold Fields: Balance Sheet and Production Details
Note: As most are South African gold and platinum group metals ("PGM") miners, results are posted every six months. However, quarterly operational updates are posted in 1Q and 3Q. I will present the most recent 6-month financial results and production details for 1Q23.
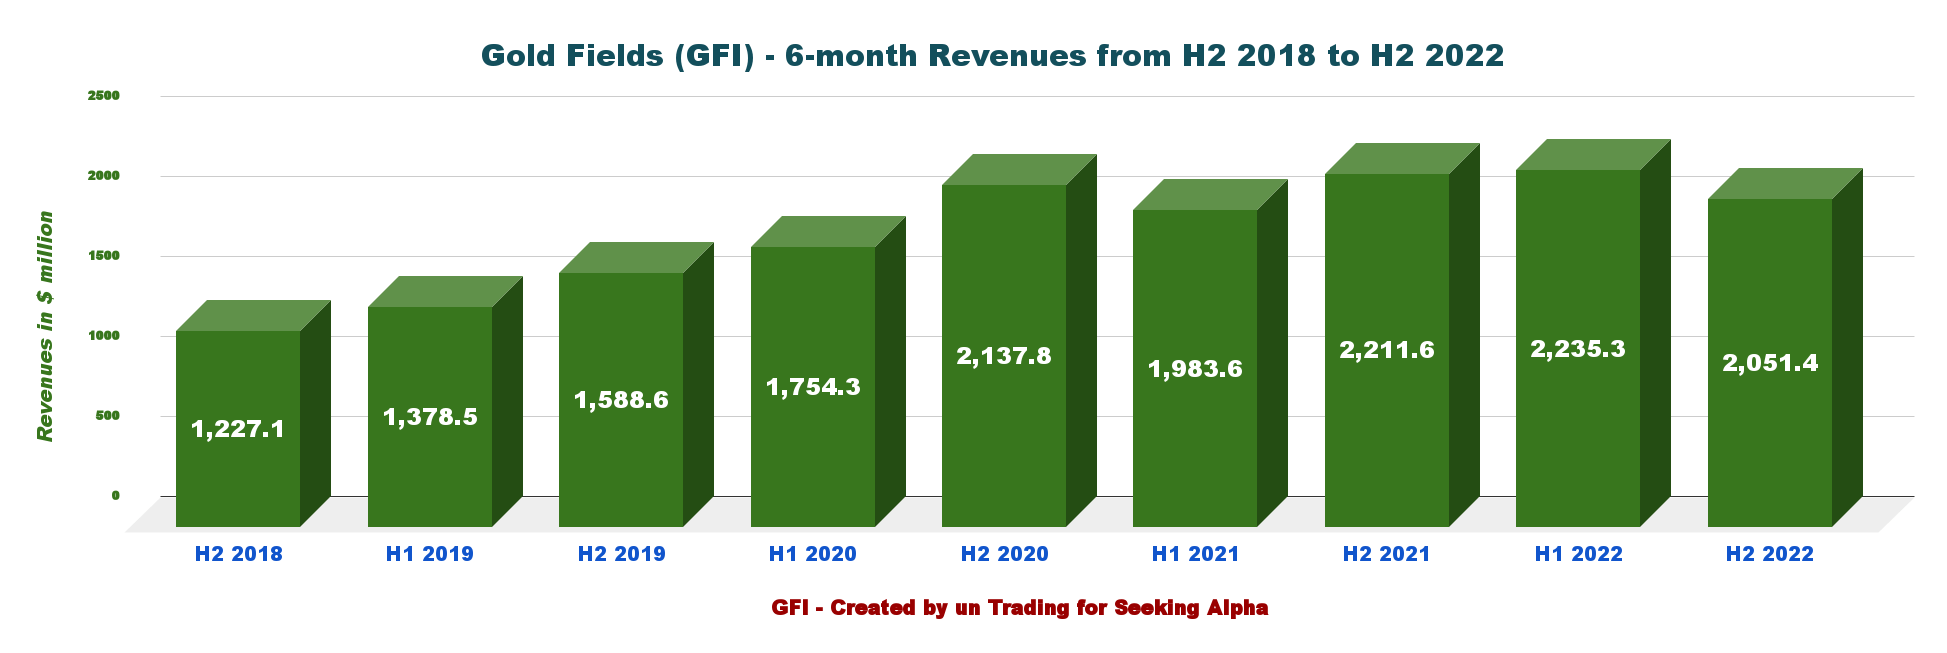
1 - Revenues were $2,051.4 million in H2 2022
GFI 6-month Revenue History ending December 2022 (Fun Trading)
GFI announced 6-month revenues ending H2 2022 of $2,051.4 million. The revenues. The next revenues will be indicated with the 2Q23.
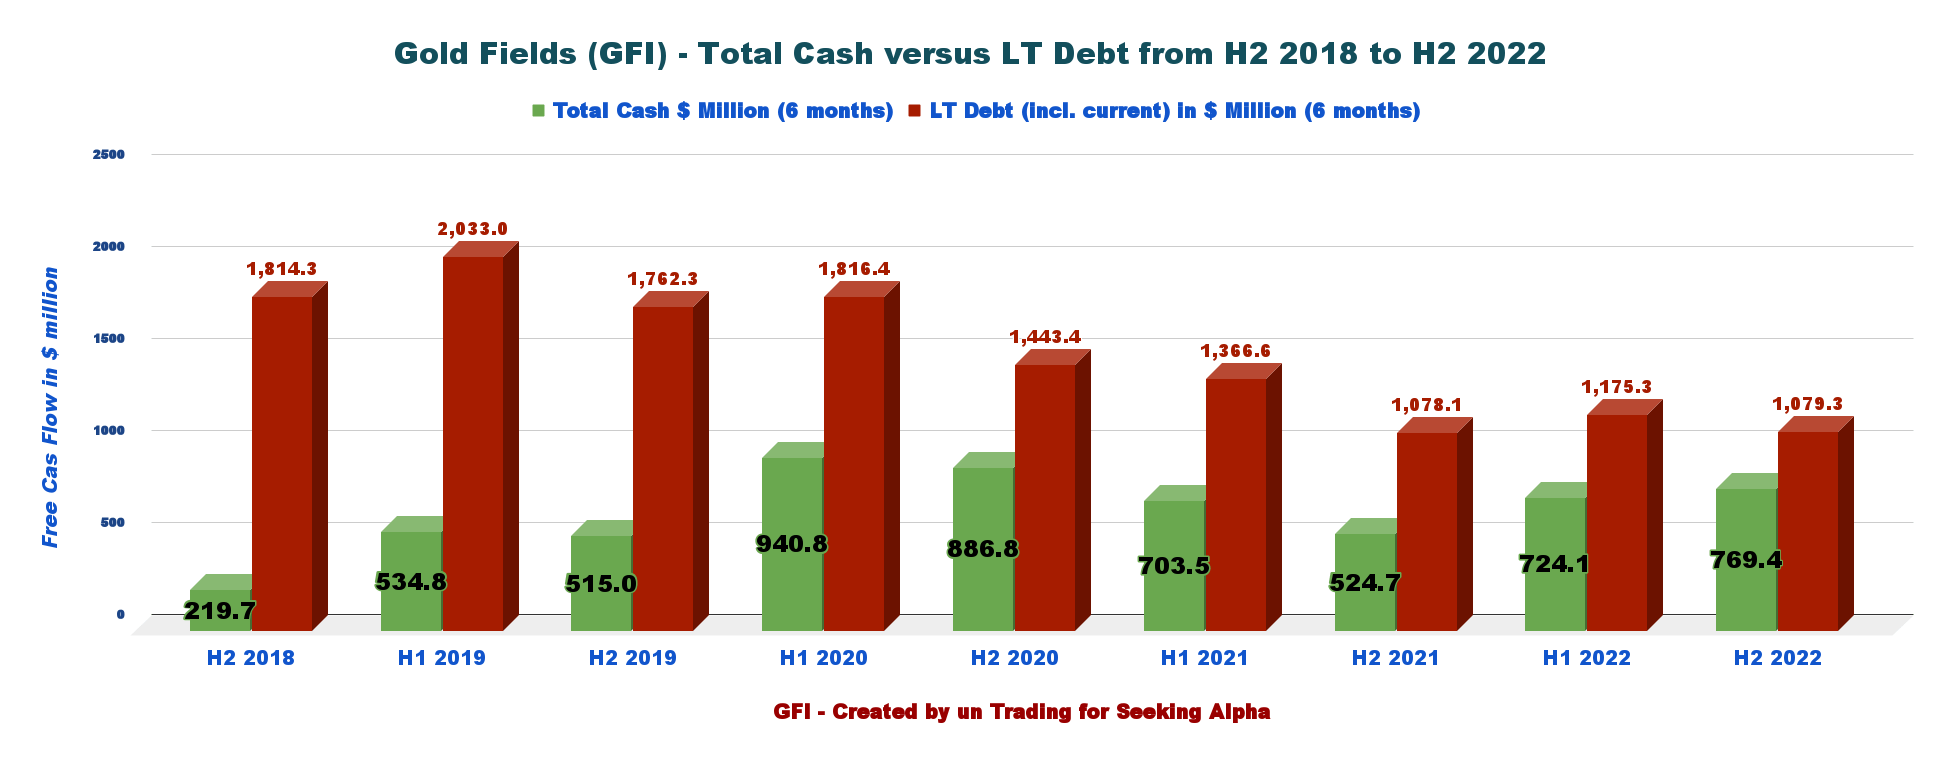
2 - Net debt, including lease liabilities, was $875 million at the end of March 2023.
Net debt at the end of the quarter was $875 million, compared to $704 million at the end of December 2022, largely driven by the payment of the final dividend of $215 million and a non-controlling interest holders dividend of $3 million. The Group generated a free cash flow of $83 million in 1Q23.
The company said the balance sheet remains very strong, with net debt to EBITDA at the end of the quarter of 0.36x , compared to 0.29x at the end of 4Q22 (H2 2022). Below is the chart history ending in H2 2022.
GFI 6-Month Cash versus Debt History (Fun Trading)
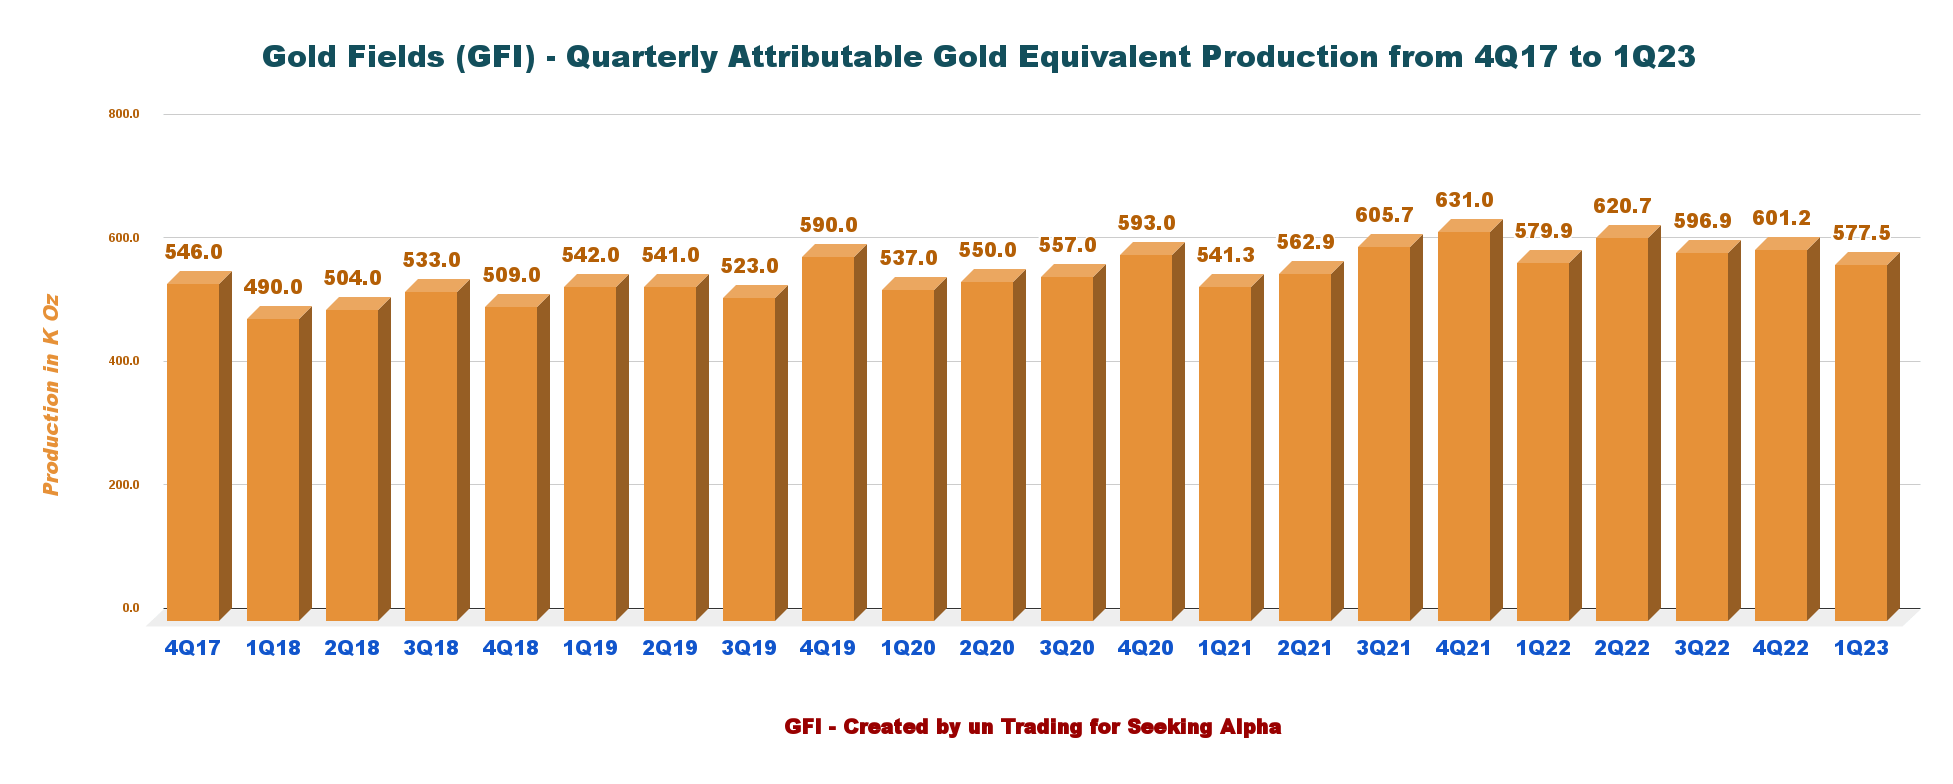
3 - 1Q23 gold equivalent production details
Attributable gold production was 577.5K Oz in 1Q23 , against 579.9K Oz in 1Q22. AISC for the quarter was $1,152/oz , also largely flat YoY and up 8% QoQ.
GFI Quarterly GEO attributable History (Fun Trading)
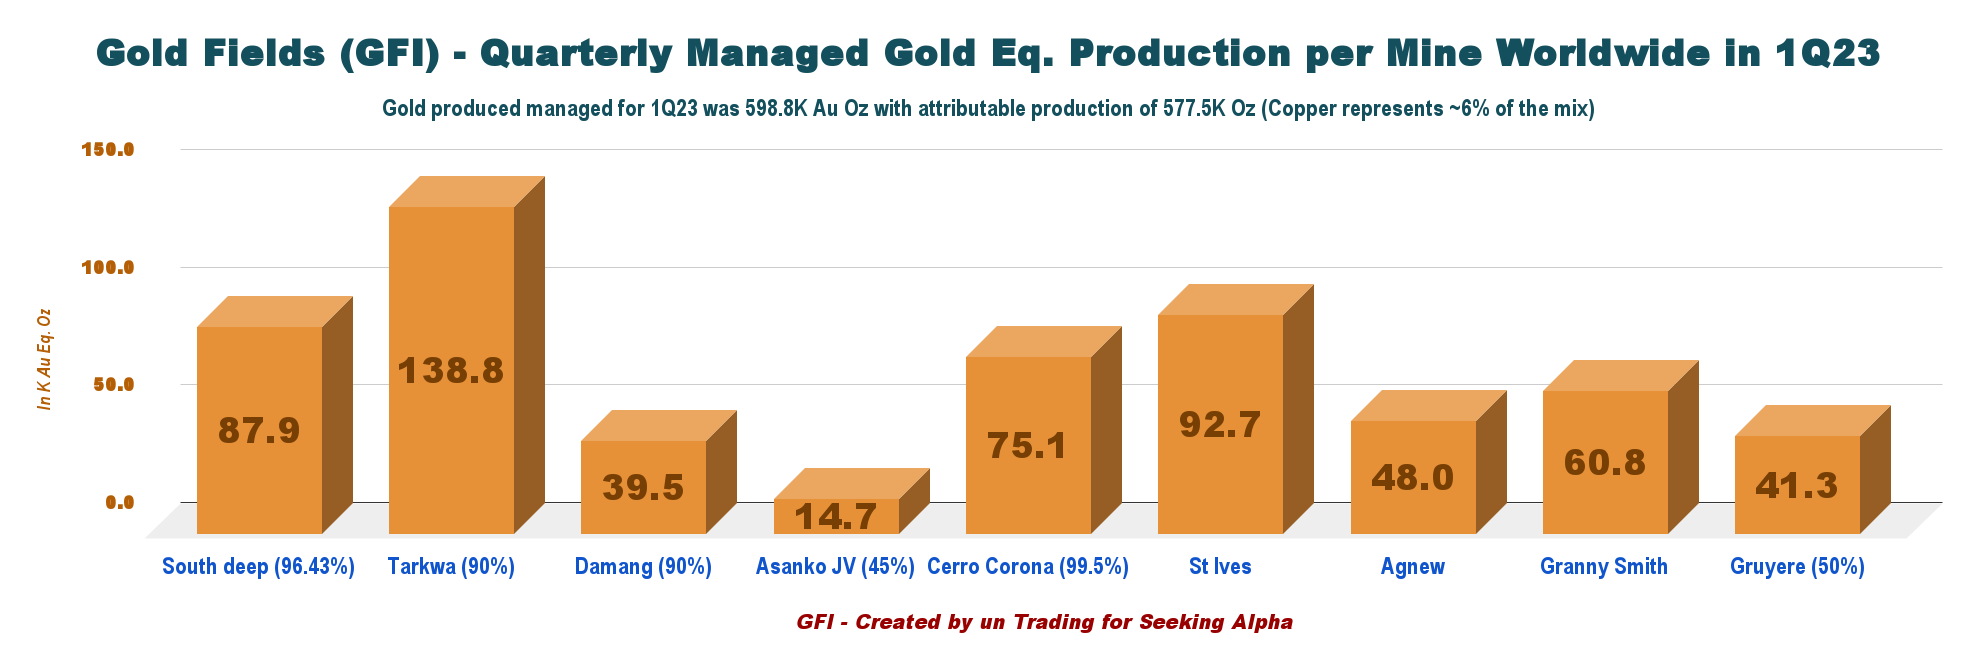
4 - Gold Fields operates eight mines and one project in five locations across the globe.
Note: A majority of the producing mines are partially owned, as you can see in the chart below:
GFI 1Q23 Production per mine (Fun Trading)
The Australian region produced 243koz, down 6% YoY (down 12% QoQ)
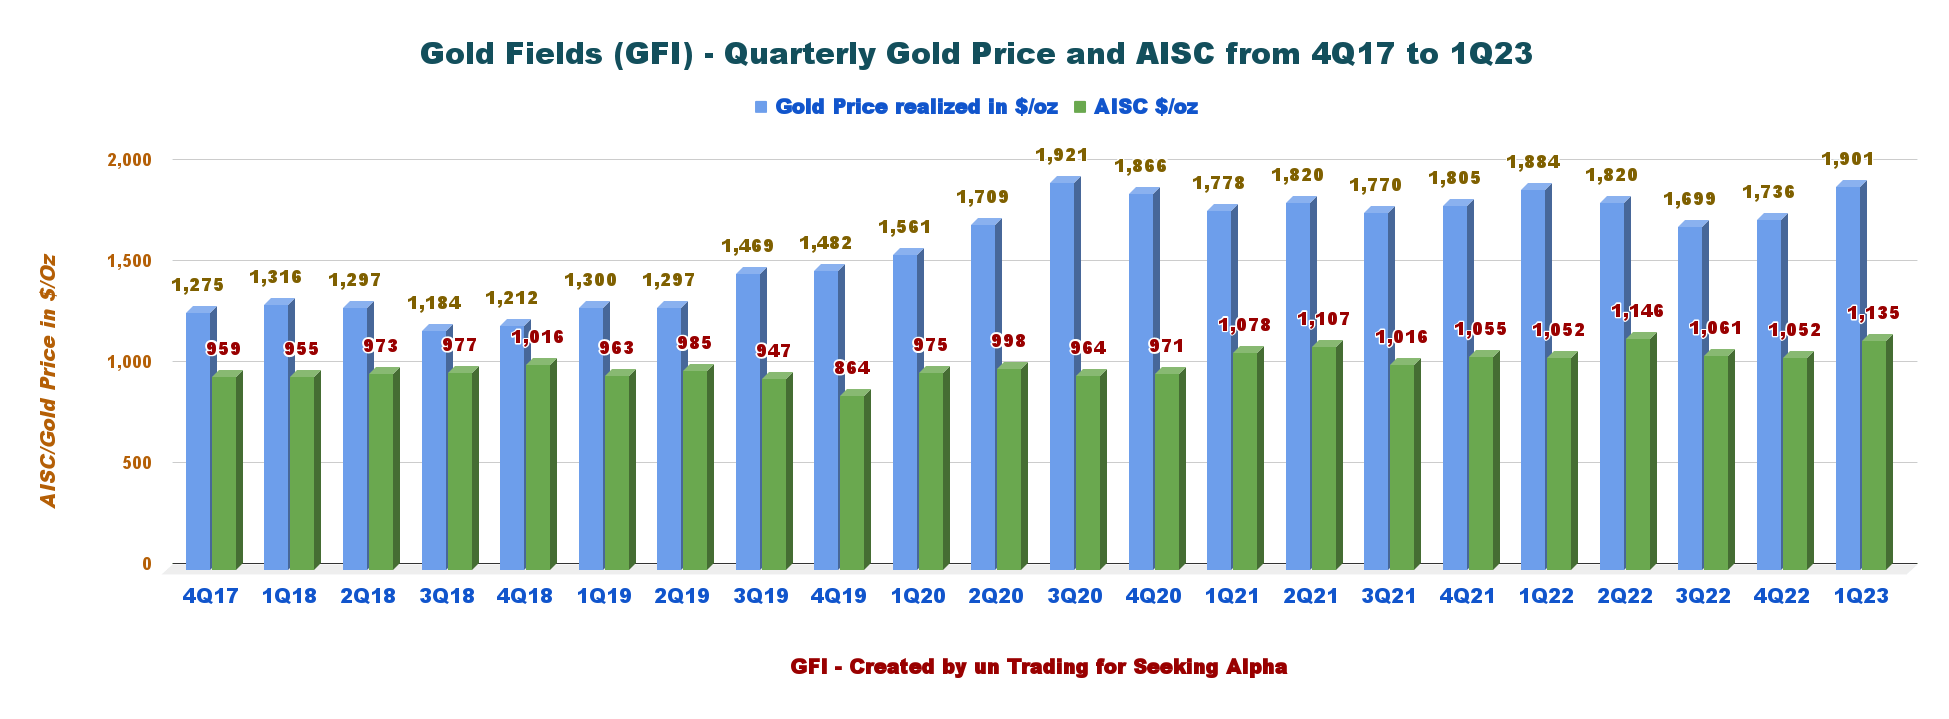
5 - AISC and Gold price history.
AISC for 1Q23 is up to $1,152 per ounce compared to 1Q22 and up sequentially. Weak gold equivalent production in 1Q23 may be the main reason.
GFI Quarterly Gold Price and AISC History (Fun Trading)
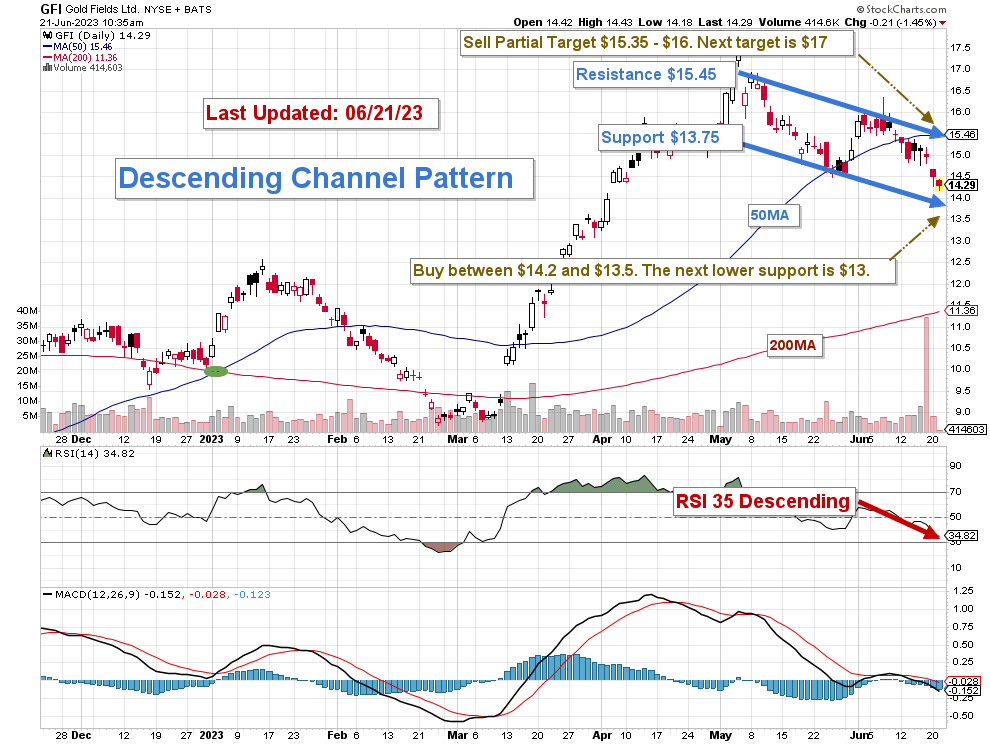
Part III - Technical Analysis (Short-Term) and Commentary
GFI TA Chart Short-Term (Fun Trading StockCharts)
Note: The chart has been adjusted for dividends.
Gold Fields Limited stock forms a descending channel pattern with resistance at $15.45 and support at $13.75. RSI is 35 and starts to be oversold, so we are not far from support.
Descending channel patterns are short-term bearish in that a stock moves lower within a descending channel, but they often form within longer-term uptrends as continuation patterns. Higher prices usually follow The descending channel pattern but only after an upside penetration of the upper trend line.
I recommend taking LIFO profits between $15.35 and $16, with potential higher resistance at $17, and buying back between $14.2 and $13.5 with possible lower support at $13.
Watch Gold like a Hawk.
Warning: The TA chart must be updated frequently to be relevant. It is what I am doing in my stock tracker. The chart above has a possible validity of about a week. Remember, the TA chart is a tool only to help you adopt the right strategy. It is not a way to foresee the future. No one and nothing can.
For further details see:
Gold Fields: A Weak Production Quarter