IAUM - Gold Market Commentary: An Unseasonal August May Lie Ahead
2023-08-10 04:45:00 ET
Summary
- Gold gained 3.1% in July to US$1,971 bringing the y-t-d return to 8.7%.
- August may not be as gold-friendly as it has been in the past, but there are good reasons as to why support for gold will establish itself later in the year.
- Outflows from global physically-backed gold ETFs continued in July, but narrowed compared to June.
July in review
- Gold gained 3.1% in July helped by a lower dollar and a spike in breakeven inflation rates
- Global gold ETFs shed holdings for a fourth consecutive month but COMEX managed money net long futures positions more than offset the decline, rising by 93t.
Looking forward
- August has been a good month for gold returns over the past two decades, likely driven by seasonally weak bond yields and consumer sentiment, the anticipation of seasonal equity volatility in September, and some gold restocking in India and China
- This time round, we don’t expect these factors to be as supportive as in the past, with yields pressured higher, equities trending up, and conditions for a demand pick-up poor in India and China
- However, this does not diminish our view that over the next few months, economic concerns will continue to mount and asset volatility will rise with them - factors that should help underpin investor interest in gold.
Bonds see ‘bad’, equities see ‘good’
Gold gained 3.1% in July to US$1,971 bringing the y-t-d return to 8.7% ( Table 1 ). Global gold ETFs saw outflows of 32t, evenly distributed between Europe and North America. But 93t of mostly new longs pushed COMEX-managed money net long positions to 362t (26% of open interest).
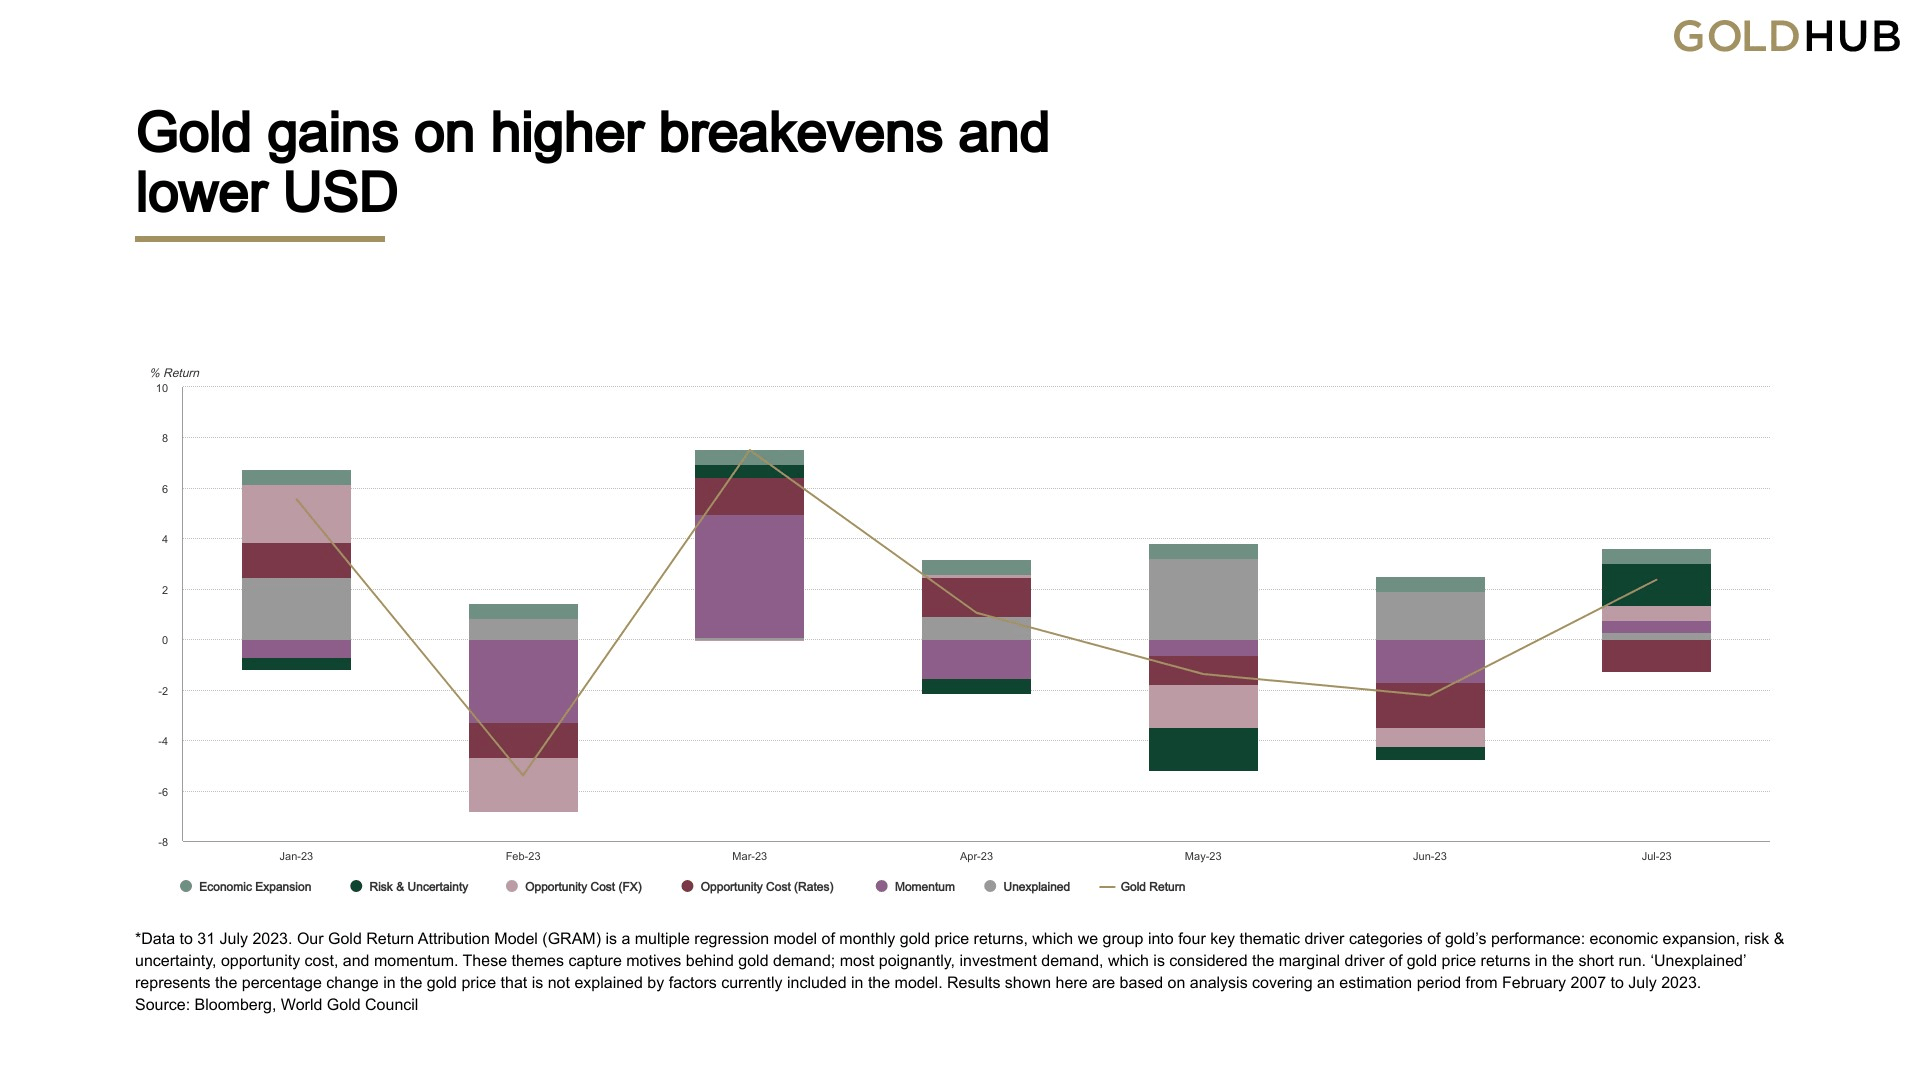
Our gold model GRAM suggests that risk factors were the primary drivers of gold’s gain, contributing 1.7% ( Chart 1 ). Of these, a sharp rise in breakeven rates on the back of much stronger-than-expected economic data was key. 1 But this move suggests a conundrum. Growth data has been stronger and inflation data has been weaker, yet the rise in breakevens was the result of stronger nominal yields - not real yields - suggesting the bond market sees ‘good’ data merely as inflationary rather than growth-inducing. This appears to be indicative of the rift between the equity market narrative of a soft landing and the bond market narrative (drawn from a record inverted yield curve) of an eventual hard landing.
A weaker US dollar also helped drive gold higher, adding 1.2% to the monthly return. Conversely, a jump in Treasury yields and ETF outflows held gold back.
Chart 1: Gold gains on higher breakevens and lower USD
*Data to 31 July 2023. Our Gold Return Attribution Model ((GRAM)) is a multiple regression model of monthly gold price returns, which we group into four key thematic driver categories of gold’s performance: economic expansion, risk & uncertainty, opportunity cost, and momentum. These themes capture motives behind gold demand; most poignantly, investment demand, which is considered the marginal driver of gold price returns in the short run. ‘Unexplained’ represents the percentage change in the gold price that is not explained by factors currently included in the model. Results shown here are based on analysis covering an estimation period from February 2007 to July 2023.
Table 1: Gold rallied in all but one currency in July
Gold price and return in different periods across key currencies*
| USD (oz) |
| EUR (oz) |
| JPY (g) |
| GBP (oz) |
| CAD (oz) |
| CHF (oz) |
| INR (10g) |
| RMB (g) |
| TRY (oz) |
| AUD (oz) |
| 31 July 2023 price |
| 1,971 |
| 1,790 |
| 9,004 |
| 1,533 |
| 2,594 |
| 1,713 |
| 52,113 |
| 453 |
| 53,034 |
| 2,930 |
| May return |
| 3.1% |
| 2.1% |
| 1.5% |
| 1.8% |
| 2.5% |
| 0.1% |
| 3.3% |
| 1.5% |
| 6.6% |
| 2.1% |
| Y-t-d Return |
| 8.7% |
| 5.7% |
| 17.8% |
| 2.1% |
| 5.5% |
| 2.2% |
| 8.0% |
| 12.5% |
| 56.3% |
| 10.1% |
*Data to 31 July 2023. Based on the LBMA Gold Price PM in USD, expressed in local currencies.
Source: Bloomberg, ICE Benchmark Administration, World Gold Council
Looking ahead
- January and August are historically the strongest months for gold returns
- August returns have likely been influenced by seasonally weak US Treasury yields, some wholesale buying in China and restocking in India, as well as anticipation of a seasonally weak September for equity returns
- On balance, the factors that typically drive a strong August for gold are likely to be absent this time round.
January and August are gold-friendly months
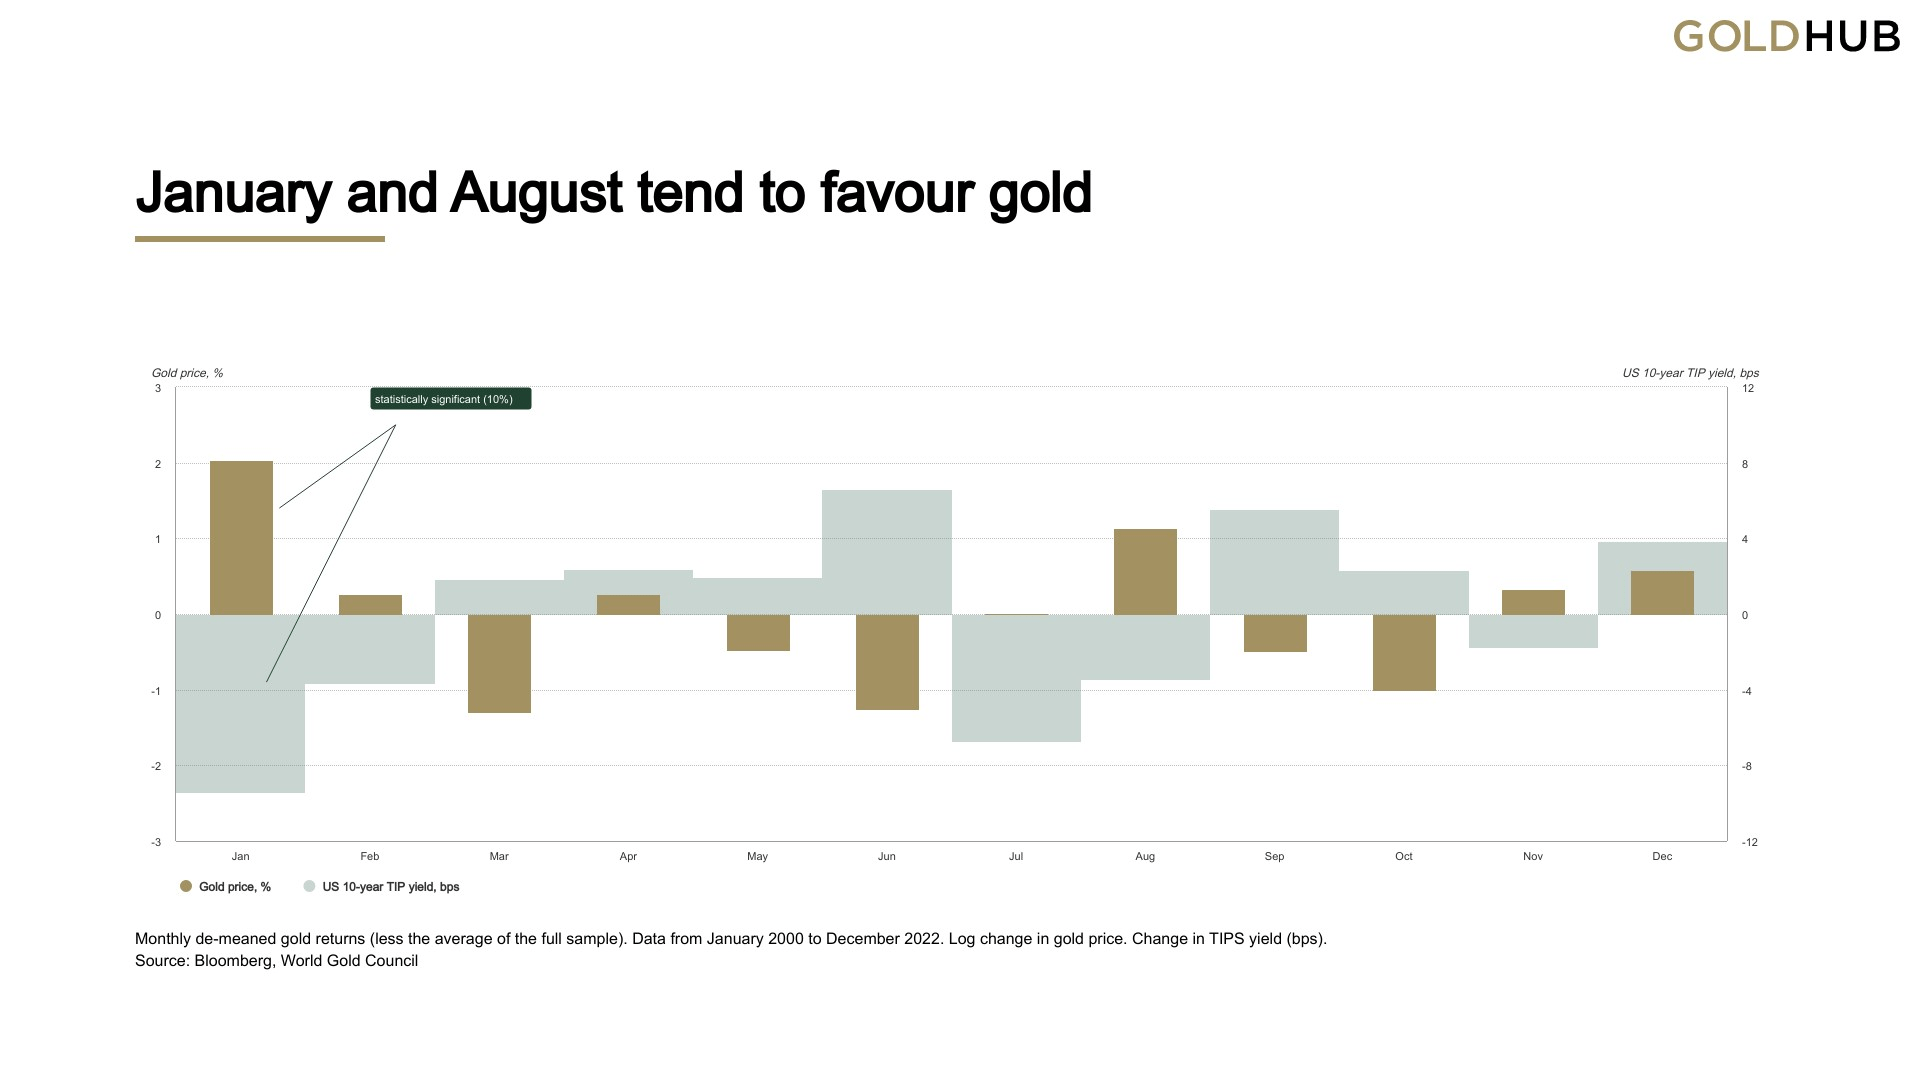
Last June, we analysed monthly seasonality in gold returns. We found quite a material shift in seasonality since the 1970s, with the last 20-plus years showing stronger January and August averages, and the former also ticking the ‘statistically significant’ box.
January strength has also coincided with seasonal weakness in US inflation-linked bond ((TIPS)) yields ( Chart 2 ) suggesting that portfolio rebalancing, an adjustment to inflation hedges, or simply a response to those weaker yields are factors that have helped drive gold returns higher than average at the start of the year. 2
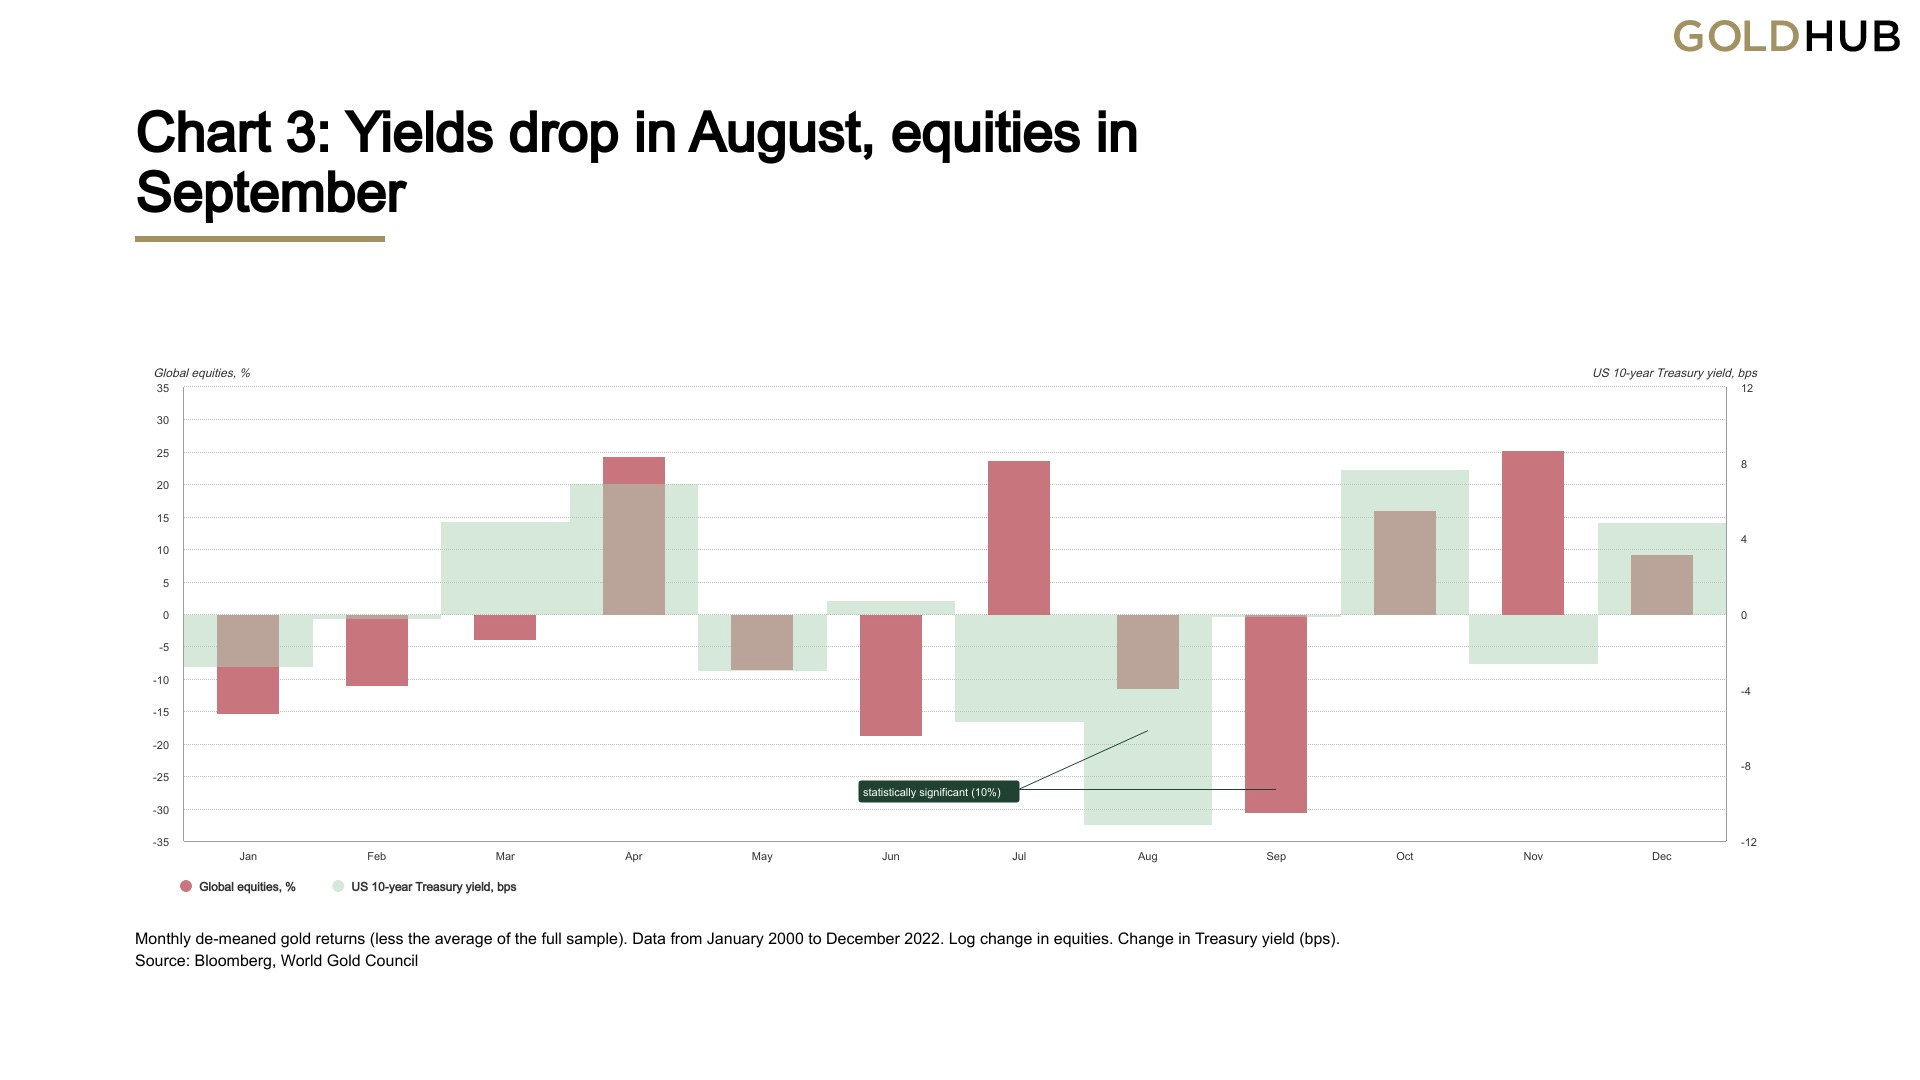
August strength has been less consistent, showing some statistical significance but with higher variation. Seasonal nominal Treasury yield weakness in August may provide some clues as investors may be looking for hedges ahead of equity weakness - and the accompanying higher volatility - in September ( Chart 3 ). 3
This appears to be confirmed by coincident seasonal weakness in consumer sentiment in August. 4 In this context, gold’s safe haven credentials may become more attractive as a result.
Chart 2: January and August tend to favour gold
Monthly de-meaned gold returns (less the average of the full sample). Data from January 2000 to December 2022. Log change in gold price. Change in TIPS yield (bps).
Chart 3: Yields drop in August, equities in September
Monthly de-meaned gold returns (less the average of the full sample). Data from January 2000 to December 2022. Log change in equities. Change in Treasury yield (bps).
We also can’t rule out price support from festive and wedding-driven Indian buying as well as Chinese wholesaler restocking. But the seasonality trend in August for China isn’t that strong: while some choose to restock for the Chinese Valentine’s Day in late August - a traditional mini-sales boost - most jewellers replenish in September amid key industrial events and ahead of the anticipated National Day Holiday peak season in early October. 5
A strong August this year is not guaranteed
There are good reasons why we may not experience a strong August this time round and they appear to outweigh the supportive factors.
Against…
- High local gold prices and a soft underlying economic environment in India and China suggest a lower appetite for physical gold buying during August
- Equity markets have managed to deflect weakening fundamentals, poor internals, and high (retail) sentiment in H1, so they might arguably weather weak seasonals too, helped by a strong Q2 earnings season 6 . This may reduce the demand for hedges, partly explaining low implied volatility
- But, if investors do want to hedge, the low equity volatility environment has enabled them to acquire out-of-the-money puts at prices not seen since the Global Financial Crisis 7 , with a possible knock-on effect on hedging demand for gold
- Longer-term US Treasury yields are more likely to tick up than down in August given a more favourable inflation and growth outlook, potential repatriation of Japanese investment capital, and the US Treasury’s need to refill its coffers by up to US$1.3 trillion by year end. 8 Firm nominal yields and rising real yields- as inflation drops -might curtail investment demand for gold ( without triggering large-scale disinvestment ). But we have also found that August returns are significantly positive even when controlling for yields and the US dollar. This perhaps puts the onus on yields to have a rampant month to unseat gold from its seasonal trend.
For…
- While longer-maturity yields might rise, the Bank of Japan’s (BoJ) decision to relax its Yield Curve Control ((YCC)) policy could ignite yield volatility and push down the US dollar - although yield differentials between the US and Europe remain more important. 9 The yen remains attractive given economic resurgence and a strong local equity market. 10 A weaker US dollar and higher volatility are likely to support gold returns
- COMEX futures net longs are not extended and ETF outflows have been decelerating, leaving capacity for investment flows to increase on the right catalyst
- The risk of a second wave of inflation remains in the US economy, though perhaps not imminently. Forward-looking indicators suggest that as real wages rise, they could once again ignite prices. The NFIB small business survey of pricing plans, which closely tracks core PCE inflation has started to tick up, economic data is surprising on the upside, manufacturing PMIs are trending higher, and single-family building permits reached their highest level in a year, suggesting that residential investment may have bottomed. 11 High inflation environments have, historically, almost always come in waves.
Beyond August
August may not be as gold-friendly as it has been in the past, but there are good reasons as to why support for gold will establish itself later in the year. As discussed in our Mid-Year Outlook, upside looks more probable than downside for gold in the current environment. For example, while stocks have weathered plenty of headwinds so far with some emerging fundamental support, sentiment and valuation still appear elevated. Economic risks also remain firmly on the table, despite a sentiment shift over the last few weeks. The US debt ratings downgrade, alongside the announcement of a huge extension to government borrowing is the latest in a slew of datapoints that are indicating trouble ahead, including:
- Commercial and industrial loan demand
- Credit spreads
- Leading Economic Indicator
- US state and local income tax receipts
- Real average weekly earnings
- Bankruptcy filings
- Weekly same-store sales
- Real weekly retail sales
- Annual S&P 500 interest expense.
Regional insights
China:
Following a 1.5% monthly rise, the average Au9999 price in July reached RMB456/gram, the highest ever. Meanwhile, the average daily trading volume of Au9999, a proxy of China’s physical gold demand, declined m/m - seasonality played a key role as gold consumption is usually weak at the beginning of Q3. The record-level gold price may have added pressure.
US:
All is well, according to July macro data releases. Growth is holding up and inflation is moderating at a fair clip, a likely contributor to ETF outflows and weaker coin sales in July (1.6t, down 0.7t y/y). July also witnessed what is likely the last Fed hike in this cycle and revived optimism that a soft landing lies ahead for the US economy.
Europe:
The ECB and BoE continued their inflation fight by raising interest rates further in July. However, expectations are now beginning to shift, with futures markets now pricing peak rate expectations in October, two months earlier than they did a month ago. A worsening economic outlook in both countries has certainly played a part. 12 European gold ETFs lost a further US$1.3bn (18t) during the month.
Central banks:
Reported net purchases totalled 55t in June - the latest data available - the first month of sizeable global net buying since February. A return to net buying from Turkey, following three consecutive months of substantial net sales, combined with purchases from China, Poland, and others outweighed minimal sales during the month. As noted in our recently published Gold Demand Trends Q2 2023 report, the underlying positive trend in central bank gold demand remains intact.
ETFs:
Outflows from global physically-backed gold ETFs 13 continued in July ( Table 2 ), but narrowed compared to June. Meanwhile, holdings reduced to 3,387t. 14 Nonetheless, driven by a stronger gold price, total assets under management ((AUM)) increased by 2% m/m to US$215bn. Asia was the lone accumulator of inflows in July. European funds once again led global outflows, shedding US$1.3bn, and North America was a close second. Flows in North America (+US$567mn) and Asia (+US$177mn) remained positive y-t-d. Europe dominated global outflows by a loss of US$5.5bn while the ‘Other’ region suffered a relatively softer decline of US$164mn.
Table 2: Global gold ETFs shed ounces in July
Gold ETF holdings and flows by region*
| Total AUM (bn) |
| Fund Flows (US) |
| Holdings (tonnes) |
| Demand (tonnes) |
| North America |
| 109.5 |
| -985.6 |
| 1,728.0 |
| -16.3 |
| Europe |
| 93.7 |
| -1,312.2 |
| 1,479.6 |
| -18.5 |
| Asia |
| 8.0 |
| 131.5 |
| 121.3 |
| 1.9 |
| Other |
| 3.7 |
| -93.5 |
| 57.8 |
| -1.7 |
| Total |
| 214.9 |
| -2,259.8 |
| 3,386.6 |
| -34.4 |
*Data to 31 July 2023. On Goldhub, see: Gold-backed ETF flows .
Source: Bloomberg, Company Filings, ICE Benchmark Administration, World Gold Council
1 Breakeven inflation rates shot up on 20 July 2023.
2 Inflation tends to be softer with lower relative economic activity at the beginning of the year, which could be a driver of lower ‘real’ yields. US economic activity is also lower in Q3 on average, but inflation tends to be relatively higher given heating demand and the US driving season. This is likely also a small contributor to lower nominal yields in August. There are potentially other gold-market-specific seasonal factors at play, but more research is needed to determine their significance.
3 Seasonal Treasury weakness may be driven by a lack of demand and a seasonal high in inflation. August is also the second strongest month for changes in COMEX-managed money net longs.
4 The Michigan Consumer Sentiment Index changes exhibit significant seasonal weakness in August as well as February.
5 Key industrial events include the Shenzhen International Jewellery Fair and other mini-fairs held by manufacturers, all aimed at sales promotion to retailers and new product launches.
6 According to Refinitiv IBES, 79% of companies reported positive surprises in Q2 compared to an average of 66%. Source: BCA Research.
8 Markets brace for deluge of Treasury bill supply after US debt deal, Reuters
9 The Real Time Japanese Bond Volatility Index spiked to a 4-year high (since index launch) but has since come down considerably. Source: Bloomberg
10 Global implications of the Bank of Japan’s yield policy shift , FT.com
11 Banking Credit Analyst – Too early to call an end to the Fed’s tightening cycle , July 2023.
12 Investors hedge against a European stock market downturn , FT.com
13 We define gold ETFs as regulated securities that hold gold in physical form. These include open-ended funds traded on regulated exchanges and other regulated products such as closed-end funds and mutual funds. A complete list is included on the gold ETF section of Goldhub.com .
14 We track gold ETF assets in two ways: the quantity of gold they hold, generally measured in tonnes, and the equivalent value of those holdings in US dollars ((AUM)). We also monitor how these fund assets change through time by looking at two key metrics: demand and fund flows. 1) Gold ETF demand is the change in gold holdings during a given period; we use this metric to calculate the quarterly demand estimates reported in Gold Demand Trends. 2) Fund flows represent the amount of money - reported in US dollars - that investors have put into (or retrieved from) a fund during a given period.
For more details, see our ETF methodology note ( PDF download )
Disclaimer
Important Information and Disclosures
© 2023 World Gold Council. All rights reserved. World Gold Council and the Circle device are trademarks of the World Gold Council or its affiliates.
All references to LBMA Gold Price are used with the permission of ICE Benchmark Administration Limited and have been provided for informational purposes only. ICE Benchmark Administration Limited accepts no liability or responsibility for the accuracy of the prices or the underlying product to which the prices may be referenced. Other content is the intellectual property of the respective third party and all rights are reserved to them.
Reproduction or redistribution of any of this information is expressly prohibited without the prior written consent of World Gold Council or the appropriate copyright owners, except as specifically provided below. Information and statistics are copyright © and/or other intellectual property of the World Gold Council or its affiliates (collectively, “WGC”) or third-party providers identified herein. All rights of the respective owners are reserved.
The use of the statistics in this information is permitted for the purposes of review and commentary (including media commentary) in line with fair industry practice, subject to the following two pre-conditions: (i) only limited extracts of data or analysis be used; and (ii) any and all use of these statistics is accompanied by a citation to World Gold Council and, where appropriate, to Metals Focus, Refinitiv GFMS or other identified copyright owners as their source. World Gold Council is affiliated with Metals Focus.
WGC does not guarantee the accuracy or completeness of any information nor accepts responsibility for any losses or damages arising directly or indirectly from the use of this information. This information is for educational purposes only and by receiving this information, you agree with its intended purpose.
Nothing contained herein is intended to constitute a recommendation, investment advice, or offer for the purchase or sale of gold, any gold-related products or services or any other products, services, securities, or financial instruments (collectively, “Services”). This information does not take into account any investment objectives, financial situation or particular needs of any particular person.
Diversification does not guarantee any investment returns and does not eliminate the risk of loss. Past performance is not necessarily indicative of future results. The resulting performance of any investment outcomes that can be generated through allocation to gold are hypothetical in nature, may not reflect actual investment results and are not guarantees of future results. WGC does not guarantee or warranty any calculations and models used in any hypothetical portfolios or any outcomes resulting from any such use. Investors should discuss their individual circumstances with their appropriate investment professionals before making any decision regarding any Services or investments.
This information contains forward-looking statements, such as statements which use the words “believes”, “expects”, “may”, or “suggests”, or similar terminology, which are based on current expectations and are subject to change. Forward-looking statements involve a number of risks and uncertainties. There can be no assurance that any forward-looking statements will be achieved. WGC assumes no responsibility for updating any forward-looking statements.
Information regarding QaurumSM and the Gold Valuation Framework
Note that the resulting performance of various investment outcomes that can be generated through use of Qaurum, the Gold Valuation Framework, and other information are hypothetical in nature, may not reflect actual investment results, and are not guarantees of future results. WGC provides no warranty or guarantee regarding the functionality of the tool, including without limitation any projections, estimates, or calculations.
Editor's Note: The summary bullets for this article were chosen by Seeking Alpha editors.
For further details see:
Gold Market Commentary: An Unseasonal August May Lie Ahead