GORO - Gold Resource: The Gold Equivalent Production For Fourth Quarter Was Not Impressive
Summary
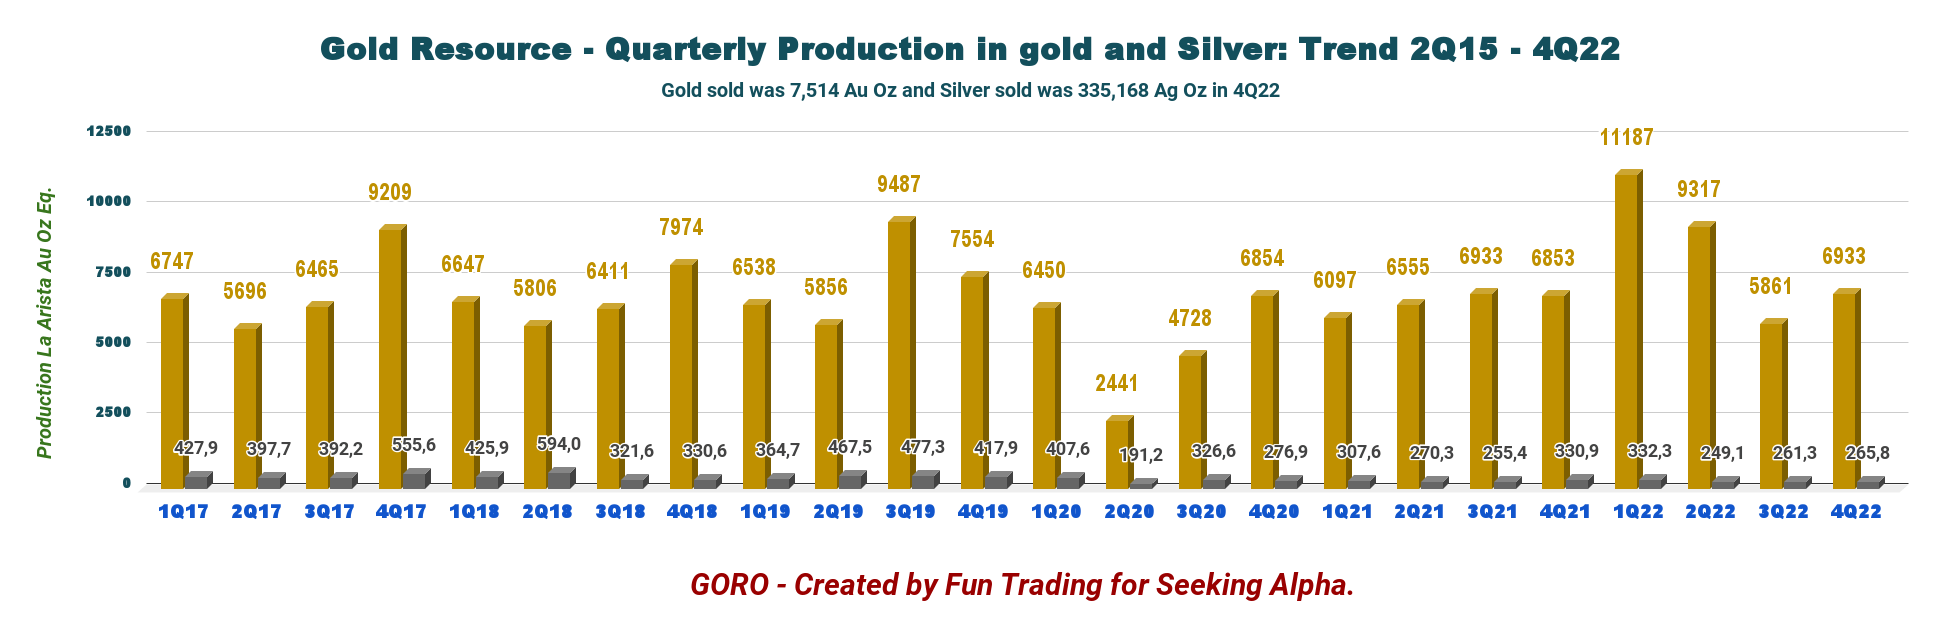
- The production sold in 4Q22 was 7,514 Au ounces, 335,168 Ag ounces, 372 Tonnes of Copper, 941 Tonnes of Lead, and 3,265 Tonnes of Zinc.
- The Don David Gold Mine production in Mexico ended the year above guidance.
- I recommend buying GORO between $1.68 and $1.61 with possible lower support at $1.55.
Introduction
Colorado Springs-based Gold Resource (NYSE: GORO ) released the preliminary and full-year 2022 production results on January 17, 2023. Also, the company indicated that work continues at Back Forty. Allen Palmiere, President and CEO, said in the press release :
Work continues with the feasibility study to advance the Back Forty Project in Michigan and once completed, preparation of State of Michigan permits will follow. In addition to the feasibility study work, we continue to focus on engaging with the local community.
Note: This article is an update of my article published on November 3, 2022. I have followed GORO on Seeking Alpha since March 2014.
1 - 4Q and full-year 2022 Production snapshot
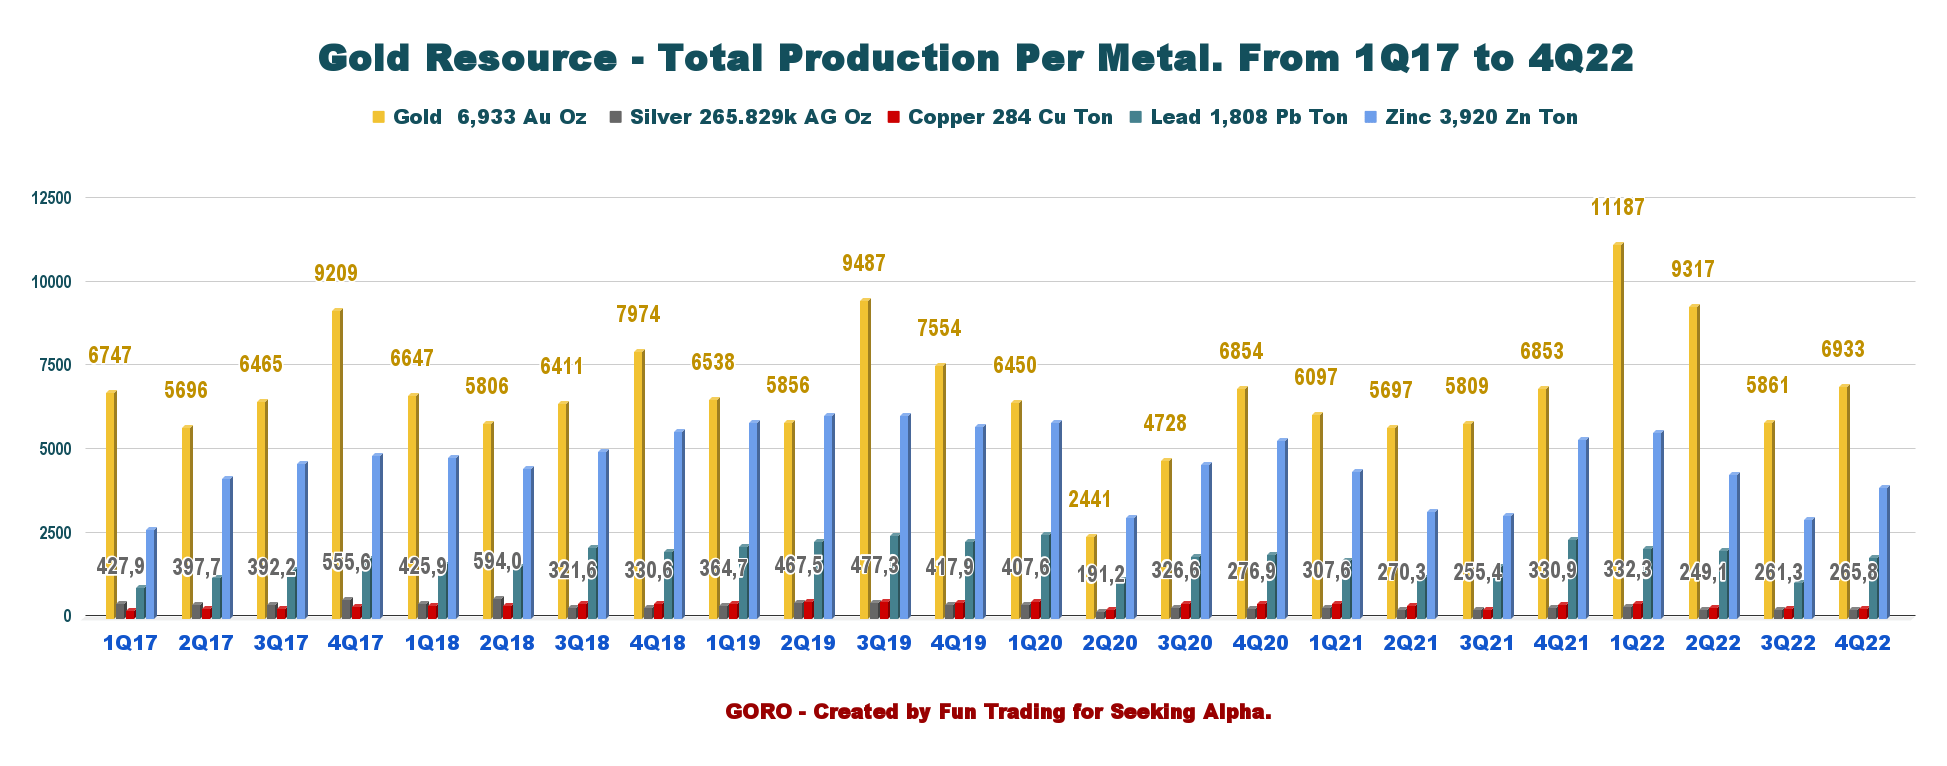
Gold Resource produced 6,933 ounces of gold, 265,829 ounces of silver, or an estimated production in Au equivalent ounces of 10,190 GEOs based on a ratio of 81.6 between Silver and gold.
Full-year production in 2022 was 33,298 Au Oz and 1,108,465 Ag Oz, representing 46,647 GEOs. By-product metals were 16,707 Tonnes of Zinc, 1,300 Tonnes of Copper, and 6,957 Tonnes of Lead.
Production for the 4Q22 was only decent, but the company sold much more than it produced this quarter which is not a positive sign.
Note: I have estimated the gold equivalent production using a ratio of 81.6:1. The company indicated production sold only, which is confusing.
The production sold in 4Q22 was 7,514 Au ounces, 335,168 Ag ounces, 372 Tonnes of Copper, 941 Tonnes of Lead, and 3,265 Tonnes of Zinc. The Don David Gold Mine production in Mexico ended the year above guidance.
Full-year production sold in 2022 was 30,119 Au Oz and 1,057,209 Ag Oz, representing 42,757 GEOs. By-product metals were 14,157 Tonnes of Zinc, 1,348 Tonnes of Copper, and 5,391 Tonnes of Lead.
The entire metal production came from the Don David Gold Mine in Mexico. Allen Palmiere, President and CEO, said in the press release:
Despite global challenges faced this year, such as inflation, and localized challenges such as ground support and ventilation, gold and silver production at the Don David Gold Mine in Mexico still ended the year above guidance. While our grade profile is expected to decline in 2023, we continue to identify and implement improvement opportunities, including collaborating with local communities to ensure sustainability.
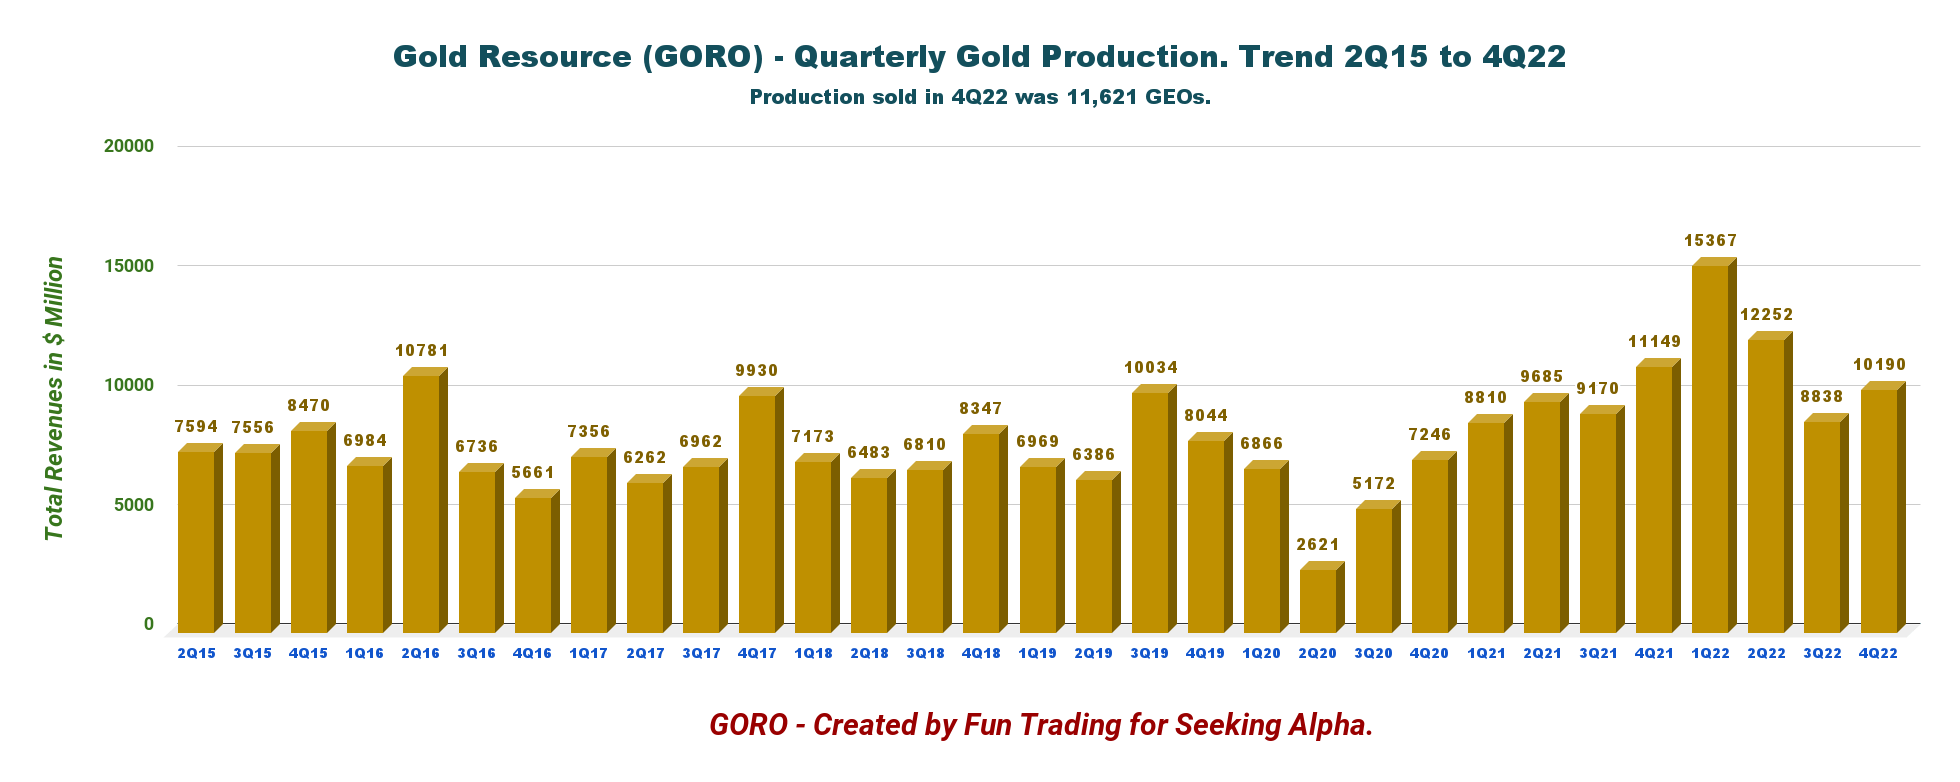
The company sold 11,621 GEOs in 4Q22 compared to 9,855 GEOs sold in 4Q21. The company sold 6,119 gold ounces and 287,805 silver ounces.
| Average metal prices realized |
| 4Q22 |
| 4Q21 |
| 4Q20 |
| Gold ($ per oz.) |
| 1,801 |
| 1,811 |
| 1,867 |
| Silver ($ per oz.) |
| 21.53 |
| 23.51 |
| 24.18 |
| Copper ($ per Lb) |
| 3.99 |
| 4.43 |
| 3.34 |
| Lead ($ per Lb) |
| 0.97 |
| 1.06 |
| 0.85 |
| Zinc ($ per Lb) |
| 1.61 |
| 1.57 |
| 1.20 |
2 - 2022 Gold equivalent production and cash position
Gold Resource Corporation produced 46,647 GEOs in 2022 and ended 2022 with a strong cash position of $23 Million.
Gold Resource indicated that production was above guidance, despite global challenges this year, such as inflation, and localized challenges, such as ground support and ventilation.
Gold Resource Corporation sold 30,119 ounces of gold and 1,057,209 ounces of silver in 2022 for an equivalent gold total of 42,757 GEOs. Additionally, the company sold 14,157 tonnes of zinc, 1,348 tonnes of copper, and 5,391 tonnes of lead, resulting in a year-end cash balance of $23.0 million.
3 - Stock Performance
GORO is up 5%. The stock price has moved slightly since October despite a recent bullish gold price. It is visible in the one-year chart below.
4 - Investment Thesis
The Back Forty project is a long shot but could make a big difference if the company can get the green light. It will not be easy, and many hurdles are on the way. I still recommend accumulating this small gold and silver producer long-term.
Thus, short-term trading LIFO about 50% of your long position is highly recommended due to the gold price volatility. The company indicated that the grade profile is expected to decline in 2023, which is not exciting news for shareholders.
If we compare GORO with the VanEck Vectors Junior Gold Miners ETF (NYSEARCA: GDXJ ), we can see that the stock has slightly outperformed the GDXJ and is up 5%.
Gold Production For The Fourth Quarter Of 2022 in Charts.
Important: Production is not including the Isabella Pearl production starting 1Q21.
1 - The Gold/Silver Ratio?
The gold and silver ratio for the fourth quarter of 2021 is 81.6:1 for Gold Resource.
Below are the two historic charts describing the quarterly production of Ag and Au equivalent.
2 - Quarterly production in a few charts.
GORO Quarterly Gold and Silver history (Fun Trading)
Detail history including Copper, Lead, and Zinc.
GORO Quarterly Production per metal history (Fun Trading)
During the fourth quarter, GORO processed ore at an average rate of 1,389 tonnes per day compared with 1,559 tonnes per day in Q4 2021. The average gold grade g/t was 2.51 in 4Q22 compared to 1.93 g/t in 4Q21.
GORO Quarterly Production GEO history (Fun Trading)
However, the gold equivalent sold was 11,621 GEOs in 4Q22 compared to 9,855 GEOs made in 4Q21. The company sold 7,514 gold ounces and 335,168 silver ounces. Also, it sold 372 tonnes of payable copper, 941 tonnes of payable lead, and 3,265 tonnes of payable zinc.
Technical analysis (short-term) and Commentary
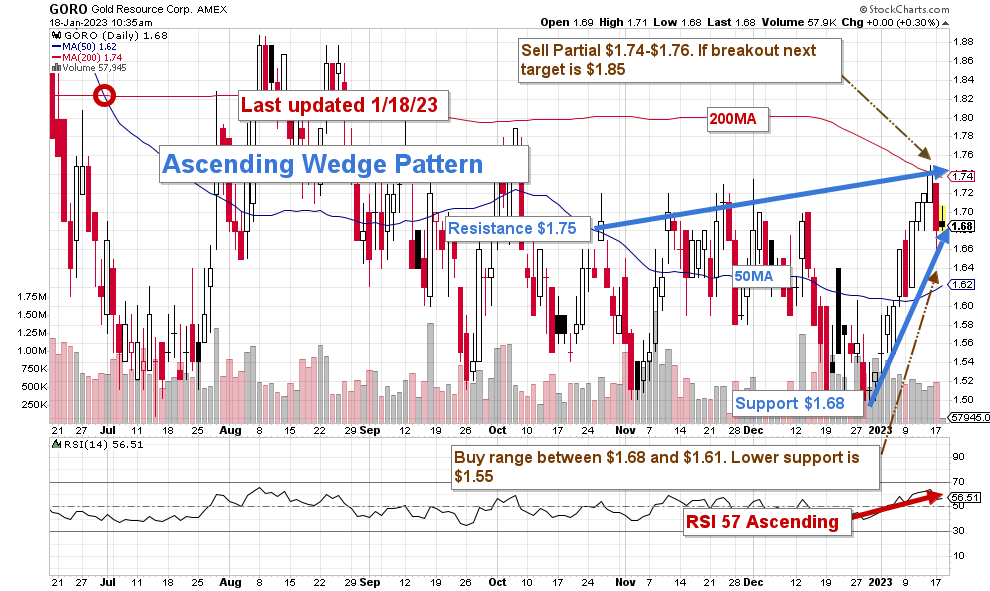
GORO TA Chart short-term (Fun Trading StockChart)
GORO forms an ascending wedge pattern with resistance at $1.75 and support at $1.68.
Be careful. In general, the ascending wedge pattern is a bearish chart pattern that signals an imminent breakout to the downside.
The short-term trading strategy is to sell between $1.74-$1.76 with higher resistance at $1.85, about 50% of your position, and wait for a possible retracement between $1.68 and $1.61 with possible lower support at $1.55.
I believe trading LIFO about 50% of your position is the best strategy and will reward you with the most significant profit overall.
Watch the gold and silver price like a hawk.
Warning: The TA chart must be updated frequently to be relevant. It is what I am doing in my stock tracker. The chart above has a possible validity of about a week. Remember, the TA chart is a tool only to help you adopt the right strategy. It is not a way to foresee the future. No one and nothing can.
Author's note: If you find value in this article and would like to encourage such continued efforts, please click the "Like" button below as a vote of support. Thanks!
For further details see:
Gold Resource: The Gold Equivalent Production For Fourth Quarter Was Not Impressive