GLDG - Gold Royalty Corp.: What A Slide
2023-09-28 18:09:34 ET
Summary
- Gold Royalty Corp. announced its operating and financial results for Q2 2023, with revenues of $0.47 million and a net loss of $2.50 million.
- The company's stock performance has significantly underperformed, down 41% in one year.
- I recommend buying Gold Royalty Corp. shares between $1.26 and $1.23, with possible lower support at $1.18.
Introduction
On August 10, 2023, the Vancouver, British Columbia-based Canadian Gold Royalty Corporation ( GROY ) announced its operating and financial results for the second quarter of 2023 .
Note: Gold Royalty Corp. was incorporated in Canada on June 23, 2020, and is domiciled in Canada. GRC is primarily engaged in acquiring gold-focused royalty and mineral stream interests.
Gold Royalty Corp. is part of the GoldMining Inc. group.
My GoldMining Inc. (GLDG) article was published on September 15, 2023. GoldMining owns 15% of GROY, as you can see below:
GROY GoldMining group (GLDG Presentation)
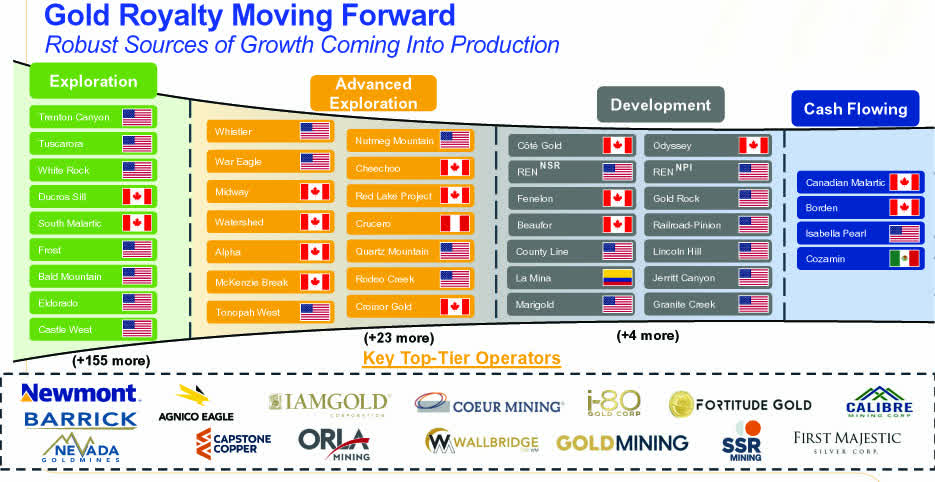
GROY has an extensive portfolio of over 225 royalties, including those from North America's largest gold mines.
GROY Main Royalties (GROY Presentation)
Gold Royalty is now providing cash flow to GLDG through its royalties and streams extensive portfolio. Gold Royalty pays a yearly dividend of $0.04 with a dividend yield of 2.92%.
However, on July 31, 2023, the Company announced it had agreed to acquire a 1% royalty on portions of the producing Cozamin copper-silver mine in Mexico operated by Capstone Copper Corp. Unfortunately for current shareholders (emphasis added):
Upon completion of the Cozamin deal, Gold Royalty said it will suspend dividends "to focus capital on executing its strategic priority of growing cash flow and net asset value per share through accretive acquisitions."
1 - Stock performance
GROY has significantly underperformed the group and is now down 41%.
Important: GROY's main shareholder is GoldMining Inc. with 15% ownership.
2 - Investment thesis
Gold Royalty is very similar in size and strategy to Metalla Royalty & Streaming Ltd. ( MTA ). This company is in an early development stage, meaning more cash is needed to grow its assets portfolio and create dilution.
Thus, I have serious reservations about the Gold Royalty Corp. business model based on an aggressive acquisition propensity that severely hurt the stock valuation, which is now down 41% in one year.
GROY owns only four cash-flowing assets, with a few exciting development-stage assets.
Three substantial development-stage assets are the Odyssey Project at the Canadian Malartic, owned by Agnico Eagle ( AEM ); The Côté Gold Project , close to completion, owned by IAMGOLD ( IAG ); and the REN project at the Goldstrike Mine, owned by Barrick Gold ( GOLD ).
GROY Assets pipeline (GROY Presentation)
The development stage will take several years to be sufficiently advanced to stabilize the matter.
Gold Royalty Corporation: Q2 2023 Financial Snapshot History - The Raw Numbers
Note: The numbers are indicated in .
| GROY |
| 2Q22 |
| 3Q22 |
| 4Q22 |
| 1Q23 |
| 2Q23 |
| Total Revenues $ million |
| 1.907 |
| 0.866 |
| 0.582 |
| 0.770 |
| 0.47 |
| Quarterly Earnings in $ million |
| -3.44 |
| -4.68 |
| -2.20 |
| -3.08 |
| -2.50 |
| EBITDA $ million |
| -2.13 |
| -3.91 |
| -2.11 |
| -2.74 |
| -1.93 |
| EPS (diluted) $ per share |
| -0.03 |
| -0.04 |
| -0.02 |
| -0.02 |
| -0.02 |
| Operating Cash Flow $ million |
| -4.21 |
| 0.62 |
| -4.53 |
| -2.06 |
| -1.34 |
| CapEx in $ |
| 3.61 |
| 0.66 |
| 0.01 |
| 0.03 |
| 0.12 |
| Free Cash flow |
| -7.81 |
| -0.04 |
| -4.54 |
| -2.09 |
| -1.45 |
| Total Cash in $ million |
| 17.10 |
| 14.25 |
| 9.69 |
| 9.80 |
| 5.78 |
| Total LT Debt in $ million |
| 9.74 |
| 9.41 |
| 9.49 |
| 9.93 |
| 9.93 |
| Dividend $/ share |
| 0.01 |
| 0.01 |
| 0.01 |
| 0.01 |
| 0 |
| Shares Outstanding (diluted) |
| 134.37 |
| 134.90 |
| 143.91 |
| 144.29 |
| 144.56 |
| Production in GEOs |
| 2Q22 |
| 3Q22 |
| 4Q22 |
| 1Q23 |
| 2Q23 |
| Gold Equivalent Production GEO |
| 1,004 |
| 517 |
| 336 |
| 406 |
| 237 |
| Gold Price $/Oz |
| 1,899 |
| 1,675 |
| 1,732 |
| 1,889 |
| 1978 |
Data Source : The company's financial report.
Gold Production and Balance Sheet Details
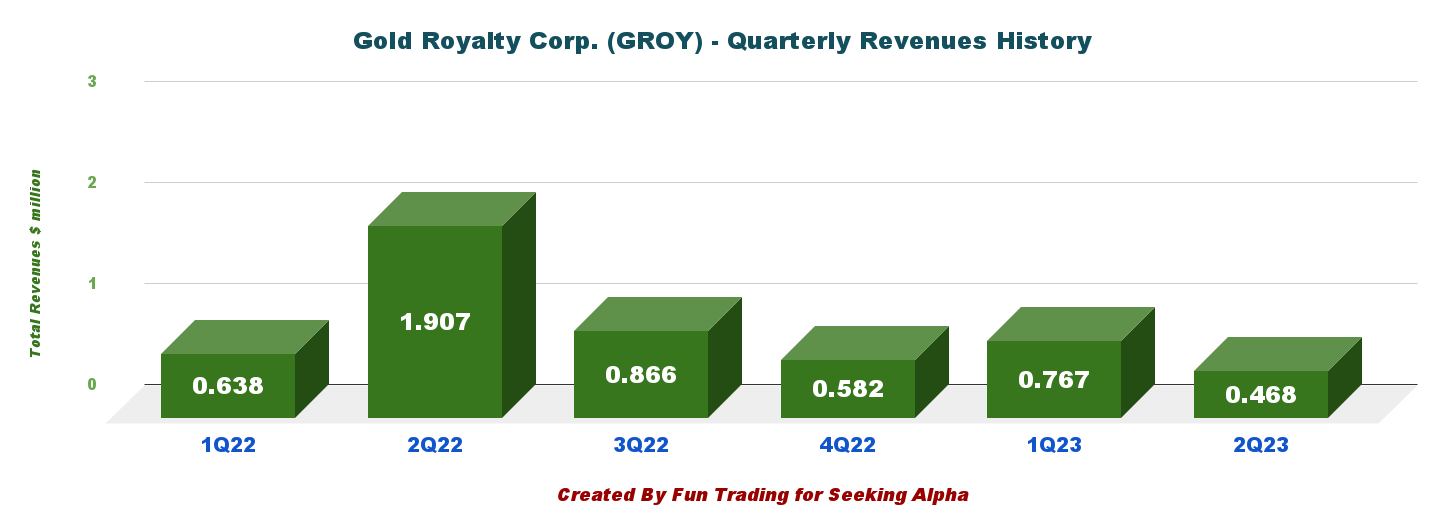
1 - Revenues were $0.47 million for the second quarter of 2023
GROY Quarterly Revenue History (Fun Trading)
Revenues for the second quarter of 2023 were $0.468 million , down significantly from $1.907 million in the same quarter a year ago and down from $0.767 million in 1Q23. Net loss was $2.50 million in 2Q23.
Total Revenue and Land Agreement Proceeds in the second quarter were lower than expected primarily due to resequencing of production at the Barnat Pit at Canadian Malartic. Full year Total Revenue and Land agreement Proceed guidance of $5.5 million to $6.5 million is currently maintained as the shortfall in revenue from Canadian Malartic is expected to be substantially recovered in the second half of the year. (Press release)
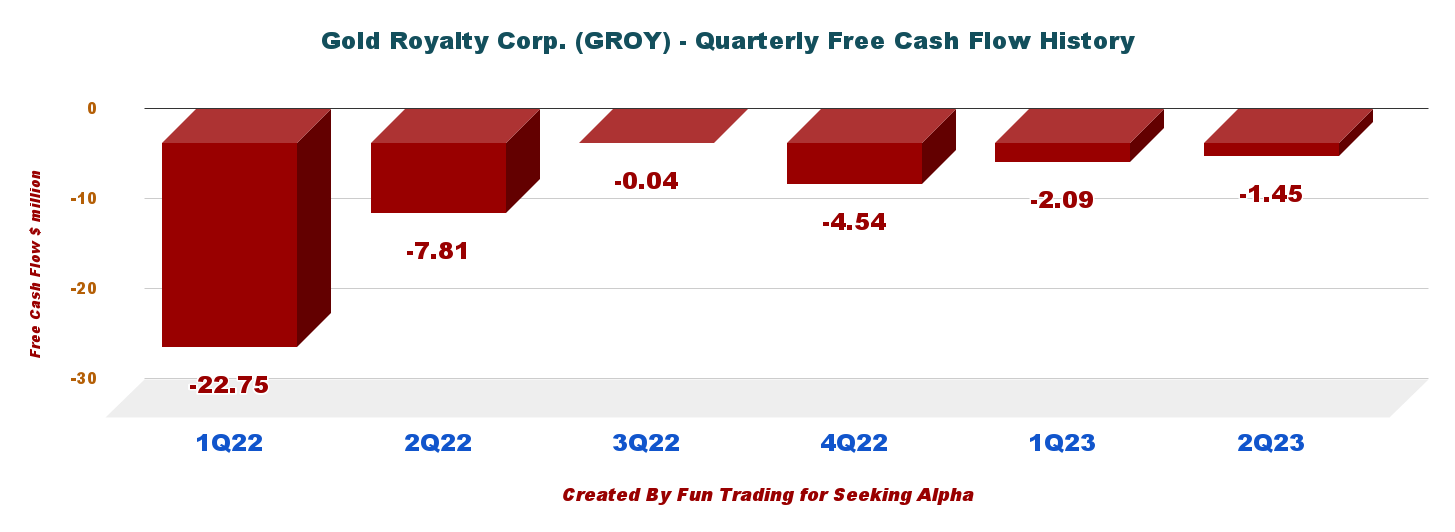
2 - Free cash flow was negative $1.45 million for 2Q23
GROY Quarterly Free Cash Flow History (Fun Trading)
Note: Generic free cash flow is the cash from operations minus CapEx.
GROY is in the expansion phase, which will probably last several quarters or years, depending on the price of gold. Thus, the company is not generating free cash flow on a one-year basis.
During the quarter ending June 30, 2023, free cash flow was negative $1.45 million. Trailing 12-month free cash flow is now negative $8.12 million.
We can understand that GROY cannot afford to pay a dividend in this situation.
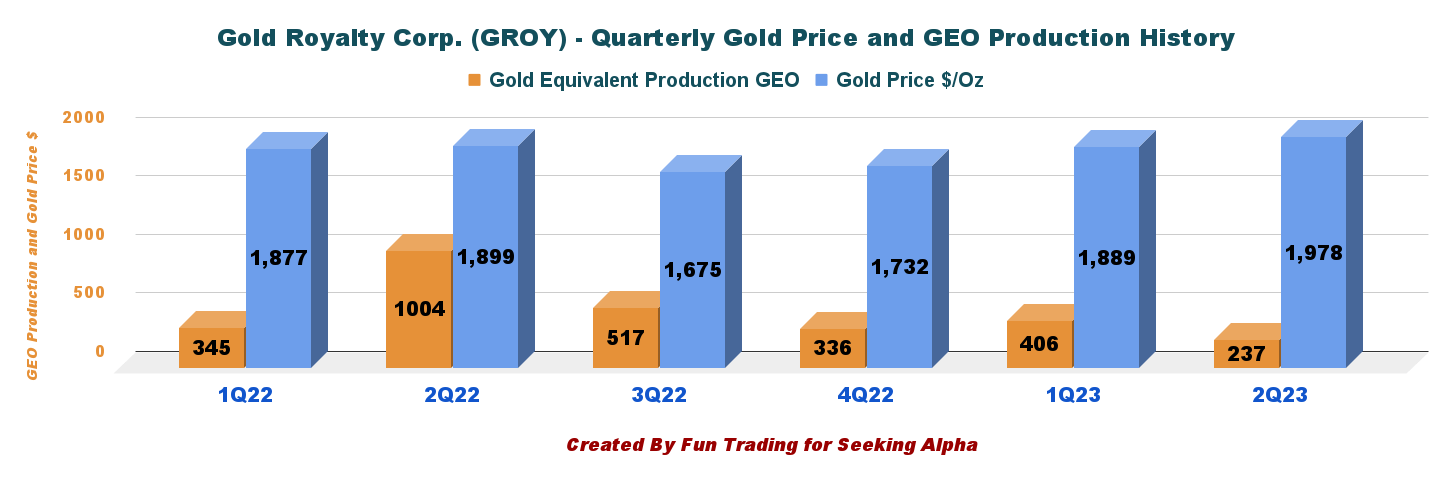
3 - Gold equivalent production details. Total production was 237 GEOs in 2Q23.
GROY Quarterly GEO Production and Gold Price History (Fun Trading)
The gold equivalent production was 237 GEOs in 2Q23, sold at $1,978 per GEO . The production was at a record low due to the resequencing of production at the Barnat Pit at Canadian Malartic.
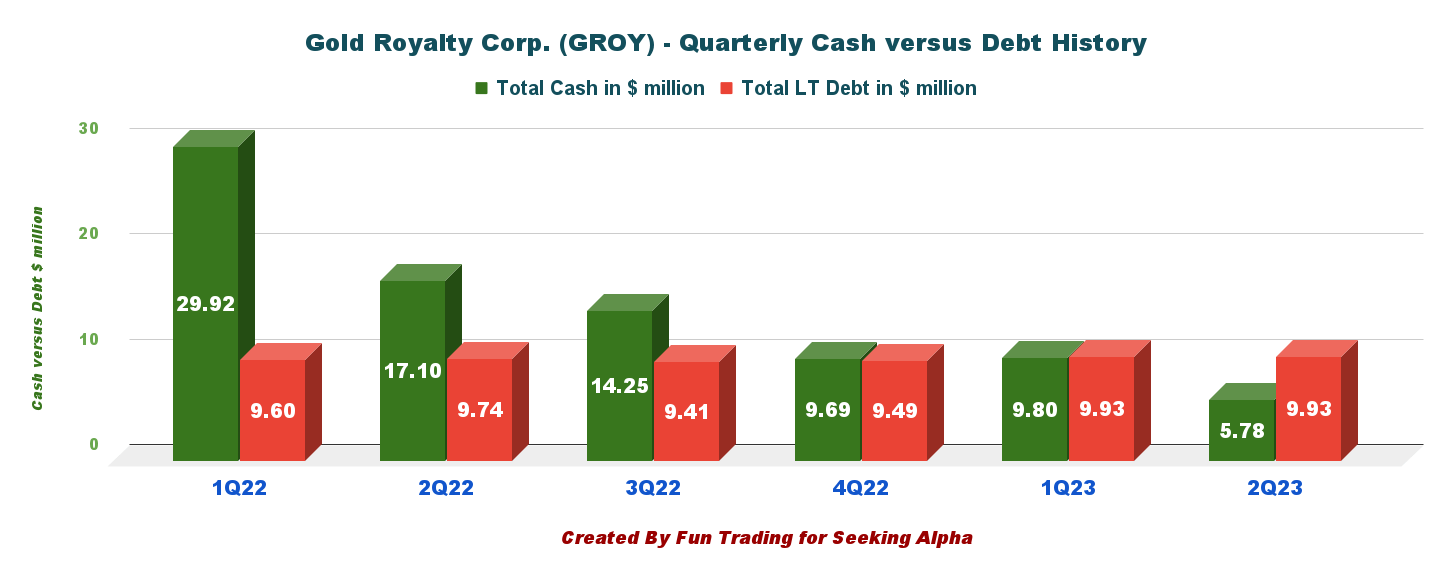
4 - Cash and debt
GROY Quarterly Cash versus Debt History (Fun Trading)
Cash on hand is $5.78 million , and long-term debt was $9.93 million at the end of June 2023.
Warning: At-The-Market Program a source of concern ( emphasis added ):
On August 15, 2022, the Company entered into an equity distribution agreement with a syndicate of agents, providing for the issuance of up to $50 million shares of GRC shares from the treasury to the public from time to time pursuant to an "at the market" equity program.
During the three months ending June 30, 2023, net cash used in financing activities was $2.6 million, primarily representing proceeds from the distribution of shares of $0.4 million, interest payment of $0.3 million, and dividend payment of $2.6 million.
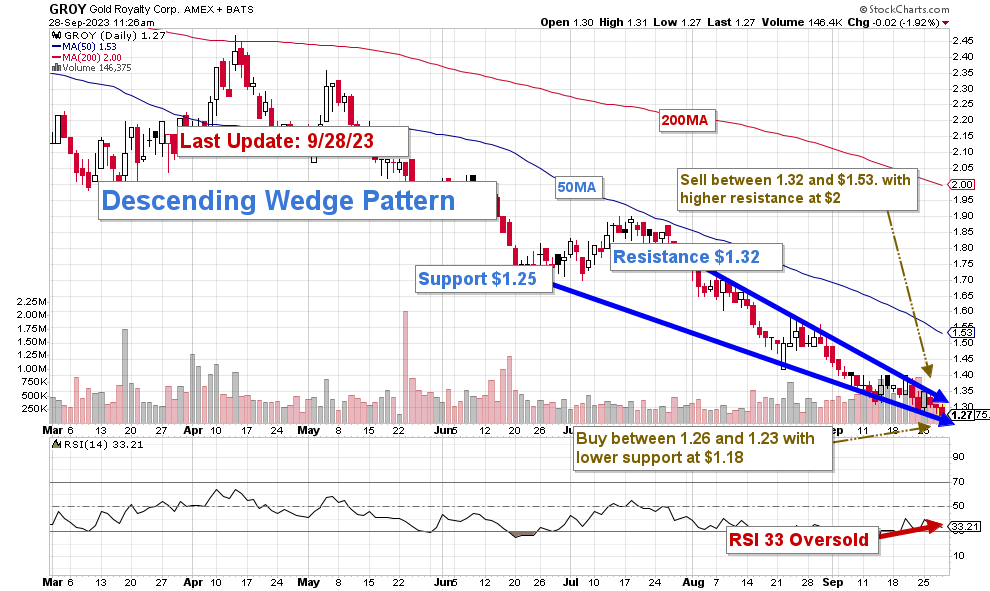
Technical Analysis (Short Term) and Commentary
GROY TA chart (Fun Trading StockCharts)
Note: The graph is adjusted from dividends.
GROY forms a descending or falling wedge pattern, with resistance at $1.32 and support at $1.25. We are at the end of the pattern, which suggests a possible breakout soon. RSI is 33, which is oversold.
The falling wedge pattern is a bullish chart pattern that can indicate a potential continuation of an uptrend or a reversal of a downtrend.
The basic strategy is to keep a small core long-term position and use about 85% to trade LIFO while waiting for a higher final price target to sell your core position. GROY could be an acquisition candidate down the road.
GROY is a very small streamer and fluctuates significantly. Hence, trading a large part of your position is perfectly adapted to this development phase.
I recommend selling a part of your position at $1.32 to $1.53 , with a potential higher target of $2.00. Buying between $1.26 and $1.23 is reasonable, with possible lower support at $1.18.
Watch gold like a hawk.
Warning: The TA chart must be updated frequently to be relevant. It is what I am doing in my stock tracker. The chart above has a possible validity of about a week. Remember, the TA chart is a tool only to help you adopt the right strategy. It is not a way to foresee the future. No one and nothing can.
For further details see:
Gold Royalty Corp.: What A Slide