RING - Gold: Sentiment Is Yet To Technically Speak (Technical Analysis)
Summary
- Gold has seen a bounce since inflation spiraled in the latter part of 2022.
- If you believe a market moves in waves of buying and selling, you will know that on the macro chart, Gold has only formed what could be perceived as a wave one.
- We will look at where the two missing waves may come in this structure and look for bullish targets should they form.
The Elliott Wave Theory works in five primary waves. In order for those five waves to form, you must first have a third wave. My theory (The Three Wave Theory) looks for the third wave to numerically copy the parameters of the wave one low to high. The reason for this is that if we can see the wave one low and high price points in financial market before or including the rejection wave two, the highest probability lies in the wave three numerically replicating the preceding waves before its significant rejection. In trading terms, that means you enter as the third wave breaks out and exit or partially exit taking profit when and if the third wave hits its projected target. My interpretation is that is where the highest probability lies that a human can gauge from a financial chart that a market will go between two price points.
I recently read an article from a prominent contributor and analyst who has stood the test of time in wave theory analysis, Avi Gilburt, about how sentiment is speaking in the bullish move upwards in Gold. Yes, there appears to be a very large drive upwards from the $1600 region on the weekly chart that has a number of different targets that either have been achieved or are on their way to being achieved.
However, there is one majorly important signal lacking on the macro monthly timeframe, and that is a rejection wave two. A bearish rejection candle or candles wave two in a bullish three wave pattern is the key ingredient to pave the way for the third wave to take a market to both higher pastures and target. Looking at the monthly chart for gold, the rejection wave two has yet to form, and without that we have no third wave target.
In this article, we will start by checking in with the weekly chart to look at a complex three wave pattern that had led to an anomaly of Fibonacci highs, and most importantly gauge where we may get the imperative rejection candle or candles on the monthly chart while also trying to gauge what may be causing this big move in Gold and how far it might actually go.
Inflation
In times of rising or high inflation, Gold is generally seen as a safe haven for investors. With what seems to be a recent tug of war between CPI data and an exact decision on interest rates from the federal reserve, Gold has risen as this cloak and dagger scenario lingers on.
What was a recent bottom in Gold and why?
To be exact, from a C Trader chart, $1614.79 was the recent bottom back in September 2022 just a month after the S&P500 (SP500) suffered a collapse in any potential bullish movement following the Jackson hole speech, combined with CPI data showing a continuing rise in inflation.
What was the first tangible wave pattern that drove this commodity higher?
Bottoming so far at $1614.79 was very nearly not a bottom. In fact, Gold came within just under $2 from eliminating the three wave structure on the weekly chart by retracing from $1729 to $1616.62.
Ultimately, it again re-bottomed at the latter, leaving the initial $1614.79 as the actual low so far before going on to break out into a third wave that has already replicated its wave one target and landed at $1844, which we can see in the chart below.
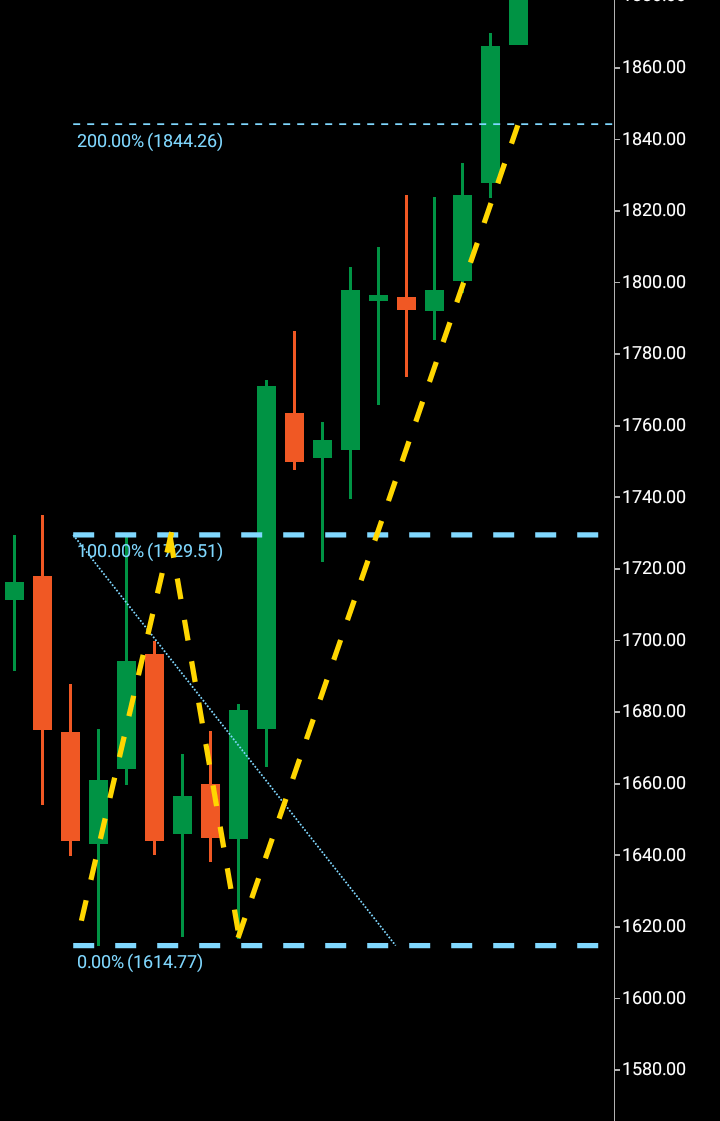
Now we can examine the move further north of this third wave on the weekly chart. Once a third wave has numerically copied its wave one, it may continue higher through the Fibonacci levels. This is particularly the case in time-frames that look to climb through to create a three wave pattern on the monthly chart, and that is exactly what is leading us to our next section in this article. But, before we do, let's examine the third wave on the weekly and what additional Fibonacci levels it's climbing through.
If you would like to understand how to identify wave patterns and how they climb through time-frames, the link to my book (The Ward Three Wave Theory) is in my Seeking Alpha bio.
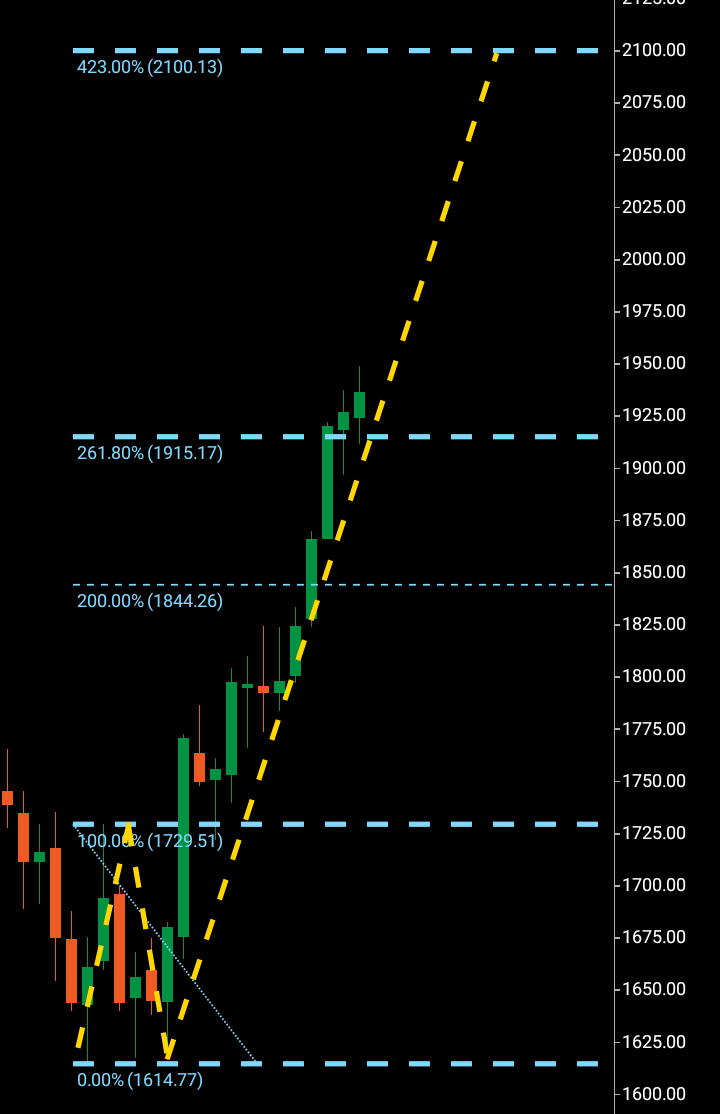
We can see on the weekly chart below that the Fibonacci 261 level has also been bypassed at $1915, with the next technical stop at $2100. This is where we will now move to the monthly chart, as it is either of these levels that may find the rejection area on this higher timeframe chart and we will look to plan for that scenario in both areas, leading us to a potential bullish target should the rejection come at either.
Gold weekly Fibonacci levels (C Trader )
Before we do, we will look at the skeleton of the weekly Fibonacci levels transferred onto the monthly chart. We see three months of very bullish movement upwards combined with the Fibonacci levels from the lower timeframe. We can also see this structure is clearly lacking a rejection candle, paving the way for a macro bullish third wave.
Gold monthly chart without rejection (C Trader )
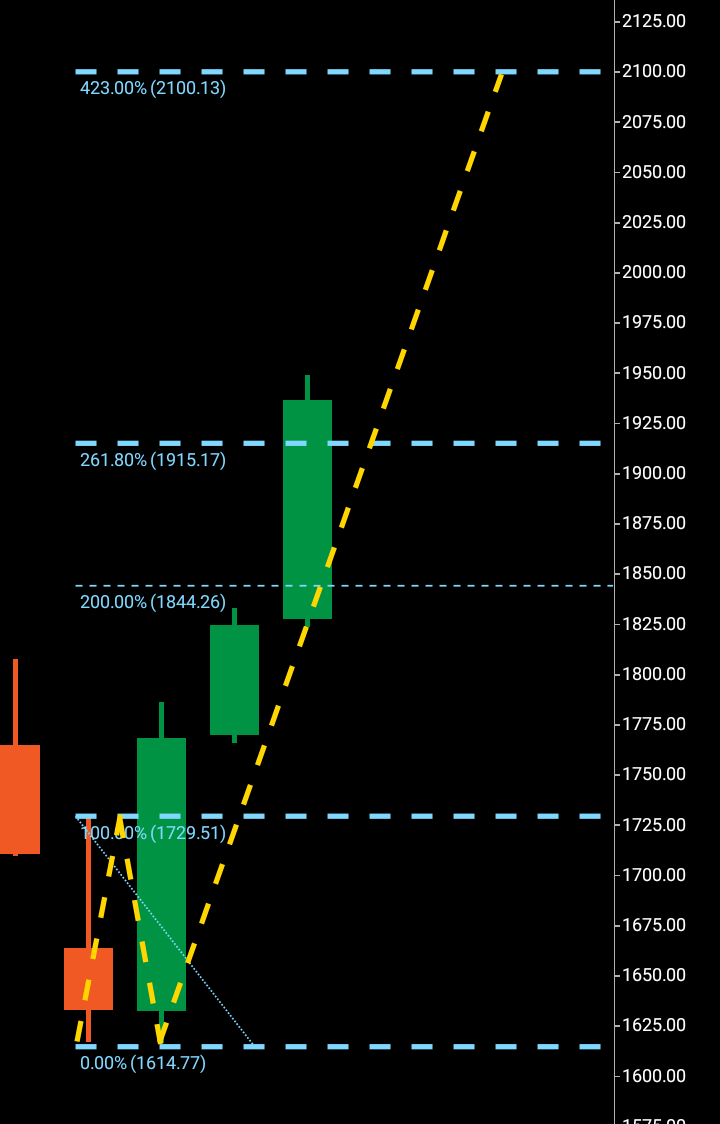
Now we can move to look at if the rejection were to come around now, which is circa the Fibonacci 261 from the weekly chart. We can see below the structure is lacking the wave two, but charting for the rejection and third wave breakout at this price region. $2281 would be a direct target should the rejection form and be beaten from here, and it is interesting to see there is confluence target of $2488 at the Fibonacci 261 from the article I recently read.
Gold monthly chart with possible rejection level (C Trader )
Finally, we will move to chart the rejection arriving at $2100, which is the Fibonacci 423 of the weekly chart. In this case, if the monthly rejection arrived and was beaten, it would give a direct target of $2587, and the additional Fibonacci numbers are once again charted in this scenario should it materialize and Gold keeps climbing higher.
Gold secondary possible rejection level (C Trader )
To summarize, it is really all down to where the monthly wave two will come and if price will climb above the wave two, launching the third wave. This would give an exact target that remains the illusive piece to this technical puzzle. Until this rejection arrives, I will select hold for this commodity.
If you would like to be informed when my articles are published on Seeking Alpha, please follow me.
About the Three Wave Theory
The three wave theory was designed to be able to identify exact probable price action of a financial instrument. A financial market cannot navigate it's way significantly higher or lower without making waves. Waves are essentially a mismatch between buyers and sellers and print a picture of a probable direction and target for a financial instrument. When waves one and two have been formed, it is the point of higher high/lower low that gives the technical indication of the future direction. A wave one will continue from a low to a high point before it finds significant enough rejection to then form the wave two. When a third wave breaks into a higher high/lower low the only probable numerical target bearing available on a financial chart is the equivalent of the wave one low to high point. It is highly probable that the wave three will look to numerically replicate wave one before it makes its future directional decision. It may continue past its third wave target but it is only the wave one evidence that a price was able to continue before rejection that is available to look to as a probable target for a third wave. The link to the Ward Three Wave Theory can be found in my bio.
For further details see:
Gold: Sentiment Is Yet To Technically Speak (Technical Analysis)